Post pandemic, insurance investors have suffered a perfect storm of high inflation, historic investment losses and a hardening reinsurance market. It may be an opportunity to collectively revisit enterprise risk management programs and investment strategy.
Summary
Property & Casualty insurance companies have suffered a hardening reinsurance market, historic losses and high inflation, creating the perfect opportunity for insurers to revisit their risk management approach. We believe:
- Enterprise Risk Management (ERM) programs are essential
- Now is a good time to review risk models and policies amid rising market and claims volatility
- Given persistent inflation, the impact on loss ratios calls for an even greater alignment of investment policy and underwriting policy
Insight’s insurance team has a history of helping clients model investment risks and downside risks to their surpluses to supplement their strategic planning process and believe such analysis could be key for many insurance company investors looking ahead.
A perfect storm for insurance companies
Inflation breached 9% in 2022, forcing the Federal Reserve to aggressively tighten policy rates from the zero-bound to above 5%.
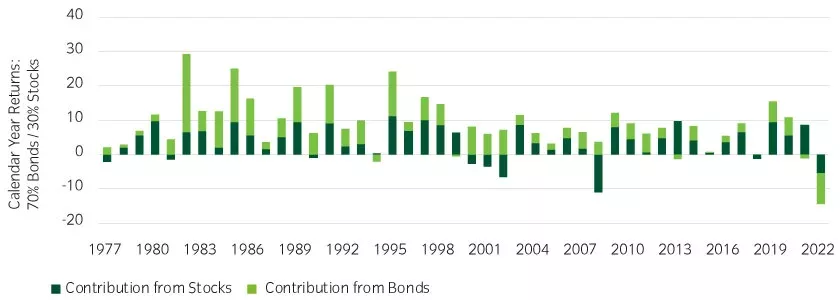
Rising rates made 2022 the worst year for bond returns since the creation of the broad market index in 19761, the first instance of consecutive annual losses, and the first time that bonds and stocks both lost value in almost 50 years (Figures 1 and 2). Further, inflation tends to erode premiums, and increase claims severity trends.
Figure 1: A hypothetical P&C insurer with a 70% fixed income and 30% equity allocation saw no diversification benefit in 20222
Source: Bloomberg, December 2022
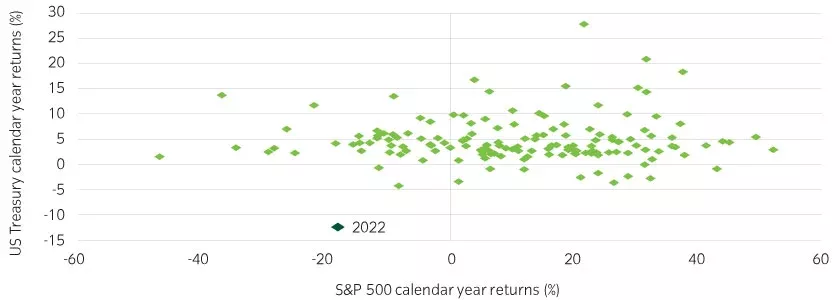
Figure 2: Calendar year 2022 was truly an outlier for investment returns3
Source: Bloomberg, December 2022 *Data back to 1876. Past performance is not indicative of future results. Investment in any strategy involves a risk of loss which may partly be due to exchange rate fluctuations.
Reinsurance costs rise due to weather-related events, and reduced capital for writing new business
Fitch estimated that 2022 was the third costliest year ever for weather-related events for insurers and reinsurers. Further, poor 2022 investment results reduced the amount of capital available for insurance companies to write new business, further pushing up reinsurance costs. For 2023, Fitch estimates property reinsurance premiums will increase 20% to 60%4. Insurers appeared to keep 90% of their direct premiums, retaining more risk on an absolute basis to manage reinsurance costs (Table 1).
Table 1: Insurance companies needed to write more premiums, retaining more risk as reinsurance costs rose5
| Premium Analysis | P&C Industry Collected Premiums ($thousand) |
| | 2018 | 2019 | 2020 | 2021 | 2022 |
| Direct premiums written | 678,266,386 | 712,471,198 | 729,019,771 | 797,828,423 | 875,988,888 |
| Ceded premiums | 59,997,247 | 72,948,876 | 73,538,937 | 81,704,095 | 99,284,018 |
| Net premiums written | 618,269,139 | 639,522,322 | 655,480,834 | 716,124,328 | 776,704,870 |
Source: S&P Capital IQ - P&C Industry, P&C Income Statement as of September 2022
This trend has been particularly difficult for smaller insurers, as they are less able to negotiate reinsurance premiums and are less able to tolerate lower levels of reinsurance protection. The P&C industry has used, on average, 10% of direct premiums to buy reinsurance coverage over the last four years3, implying smaller insurers have generally exceeded that level.
Lessons learned and future-proofing for the next perfect storm
Will your enterprise be ready for the next one-in-150-year event?
Calendar-year 2022 data offers the opportunity to test the effectiveness of your enterprise risk management (ERM) program and your company’s risk-tolerance limits.
Persistent volatility and the cycle of uncertainty across multiple factors from rates, inflation, geopolitics as well as environmental challenges are pressuring the insurance industry, necessitating a re-evaluation of core ERM processes.
We believe an overhaul of ERM processes can help insurance companies prepare for the future. In our view, the current underwriting and markets cycle presents many compelling opportunities for insurers to:
- Work collaboratively with investment managers to align underwriting pricing assumptions with capital market assumptions to establish strategic investment guidelines to reduce volatility in net income and ultimately to lower volatility in statutory surplus.
- Retroactively test the effectiveness of ERM policies and revisit risk tolerance limits for all major risks and reinforce the need to implement a holistic approach to modeling surplus risk.
- Consider how recent banking-sector stress exposes liquidity risk and the need for diversification as well as awareness of where liquidity is held.
Investment policy should not be independent of underwriting policy
Insight’s dedicated team of insurance specialists has a long history of working with insurers to model underwriting results and investment results by strategically aligning projected total return assumptions with underwriting pricing assumptions and establishing target volatility limits for investment income and underwriting income.
Adjusting and aligning capital market assumptions are important for two reasons:
- P&C industry ERM practices favor a holistic approach to manage volatility in net income results.
- Projected investment income assumptions used for rates planning are more accurate.
Investment income is the primary driver of the P&C insurance industry profitability (Table 2).
Table 2: Investment Income has dominated P&C historical Net Income Results6
| P&C insurer's income ($thousand) statement summary |
| | 2018 | 2019 | 2020 | 2021 | Sep-2022 (YTD) |
| Net underwriting gain/loss | 2,614,640 | 7,807,426 | 11,917,349 | (521,488) | (19,918,654) |
| Investment income | 67,728,698 | 67,334,159 | 63,764,308 | 73,914,328 | 56,818,589 |
| Other income | (6,090,826) | (6,354,629) | (5,225,323) | (3,477,025) | (4,206,684) |
| Net income after FIT | 60,752,127 | 63,051,828 | 60,729,489 | 63,237,293 | 33,045,593 |
Source: S&P Capital IQ - P&C Industry, P&C Income Statement as of 9/30/2022
The dominance of investment income on P&C insurers’ income statements presents a great opportunity for insurers to leverage the modelling capabilities of Insight Investment’s insurance solutions team to better understand downside risk to surplus as it pertains to underwriting risk, reserve risk, liquidity risk and investment risk.
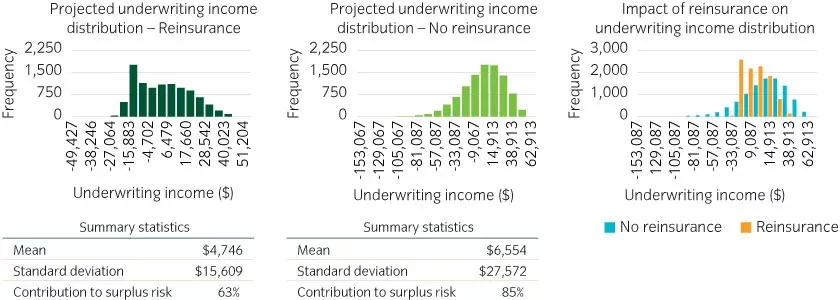
Insight’s team assists clients with dynamic financial analysis, which includes stress testing, strategic asset allocation, and forecasting downside risk to statutory surplus or net position. Figure 3 is a visual representation of the impact of reinsurance coverage on income distribution.
Figure 3: Impact of lower reinsurance coverage on downside risk to surplus7
Source: S&P Capital IQ – client Dynamic Risk Modeling Analysis as of 12/30/2020
The extreme range in outcomes provides further support for implementing a more holistic approach to insurance underwriting risk and investment policy objectives, thereby raising the probability that certainty of outcome is achievable.
1 Bloomberg US Aggregate Index. Past performance is not indicative of future results. Investment in any strategy involves a risk of loss which may partly be due to exchange rate fluctuations.
2 Bloomberg, December 2022
3 Bloomberg, December 2022 *Data back to 1876. Please see index descriptions at the back of the document. The S&P 500 represents equities and the Bloomberg US Treasury Index represents US Treasuries. Past performance is not indicative of future results. Investment in any strategy involves a risk of loss which may partly be due to exchange rate fluctuations.
4 Fitch, December 2022
5 S&P Capital IQ - P&C Industry, P&C Income Statement as of September 2022
6 S&P Capital IQ - P&C Industry, P&C Income Statement as of 9/30/2022
7 S&P Capital IQ – client Dynamic Risk Modeling Analysis as of 12/30/2020
IMPORTANT DISCLOSURES
This document has been prepared by Insight North America LLC (INA), a registered investment adviser under the Investment Advisers Act of 1940 and regulated by the US Securities and Exchange Commission. INA is part of ‘Insight’ or ‘Insight Investment’, the corporate brand for certain asset management companies operated by Insight Investment Management Limited including, among others, Insight Investment Management (Global) Limited, Insight Investment International Limited and Insight Investment Management (Europe) Limited (IIMEL).
Opinions expressed herein are current opinions of Insight, and are subject to change without notice. Insight assumes no responsibility to update such information or to notify a client of any changes. Any outlooks, forecasts or portfolio weightings presented herein are as of the date appearing on this material only and are also subject to change without notice. Insight disclaims any responsibility to update such views. No forecasts can be guaranteed.
Nothing in this document is intended to constitute an offer or solicitation to sell or a solicitation of an offer to buy any product or service (nor shall any product or service be offered or sold to any person) in any jurisdiction in which either (a) INA is not licensed to conduct business, and/or (b) an offer, solicitation, purchase or sale would be unavailable or unlawful.
This document should not be duplicated, amended, or forwarded to a third party without consent from INA. This is a marketing document intended for institutional investors only and should not be made available to or relied upon by retail investors. This material is provided for general information only and should not be construed as investment advice or a recommendation. You should consult with your adviser to determine whether any particular investment strategy is appropriate.
Assets under management (AUM) represented by the value of the client’s assets or liabilities Insight is asked to manage. These will primarily be the mark-to-market value of securities managed on behalf of clients, including collateral if applicable. Where a client mandate requires Insight to manage some or all of a client’s liabilities (e.g. LDI strategies), AUM will be equal to the value of the client specific liability benchmark and/or the notional value of other risk exposure through the use of derivatives. Regulatory assets under management without exposures can be provided upon request. Unless otherwise specified, the performance shown herein is that of Insight Investment (for Global Investment Performance Standards (GIPS), the ‘firm’) and not specifically of Insight North America. A copy of the GIPS composite disclosure page is available upon request.
Past performance is not a guide to future performance, which will vary. The value of investments and any income from them will fluctuate and is not guaranteed (this may partly be due to exchange rate changes). Future returns are not guaranteed and a loss of principal may occur. Targeted returns intend to demonstrate that the strategy is managed in such a manner as to seek to achieve the target return over a normal market cycle based on what Insight has observed in the market, generally, over the course of an investment cycle. In no circumstances should the targeted returns be regarded as a representation, warranty or prediction that the specific deal will reflect any particular performance or that it will achieve or is likely to achieve any particular result or that investors will be able to avoid losses, including total losses of their investment.
The information shown is derived from a representative account deemed to appropriately represent the management styles herein. Each investor’s portfolio is individually managed and may vary from the information shown. The mention of a specific security is not a recommendation to buy or sell such security. The specific securities identified are not representative of all the securities purchased, sold or recommended for advisory clients. It should not be assumed that an investment in the securities identified will be profitable. Actual holdings will vary for each client and there is no guarantee that a particular client’s account will hold any or all of the securities listed.
The quoted benchmarks within this document do not reflect deductions for fees, expenses or taxes. These benchmarks are unmanaged and cannot be purchased directly by investors. Benchmark performance is shown for illustrative purposes only and does not predict or depict the performance of any investment. There may be material factors relevant to any such comparison such as differences in volatility, and regulatory and legal restrictions between the indices shown and the strategy. Transactions in foreign securities may be executed and settled in local markets. Performance comparisons will be affected by changes in interest rates. Investment returns fluctuate due to changes in market conditions. Investment involves risk, including the possible loss of principal. No assurance can be given that the performance objectives of a given strategy will be achieved. Insight does not provide tax or legal advice to its clients and all investors are strongly urged to consult their tax and legal advisors regarding any potential strategy or investment.
Information herein may contain, include or is based upon forward-looking statements within the meaning of the federal securities laws, specifically Section 21E of the Securities Exchange Act of 1934, as amended. Forward-looking statements include all statements, other than statements of historical fact, that address future activities, events or developments, including without limitation, business or investment strategy or measures to implement strategy, competitive strengths, goals expansion and growth of our business, plans, prospects and references to future or success. You can identify these statements by the fact that they do not relate strictly to historical or current facts. Words such as ‘anticipate’, ‘estimate’, ‘expect’, ‘project’, ‘intend’, ‘plan’, ‘believe’, and other similar words are intended to identify these forward-looking statements. Forward-looking statements can be affected by inaccurate assumptions or by known or unknown risks and uncertainties. Many such factors will be important in determining our actual future results or outcomes. Consequently, no forward-looking statement can be guaranteed. Our actual results or outcomes may vary materially. Given these uncertainties, you should not place undue reliance on these forward-looking statements.
Insight and BNY Mellon Securities Corporation are subsidiaries of BNY Mellon. BNYMSC is a registered broker and FINRA member. BNY Mellon is the corporate brand of the Bank of New York Mellon Corporation and may also be used as a generic term to reference the Corporation as a whole or its various subsidiaries generally. Products and services may be provided under various brand names and in various countries by subsidiaries, affiliates and joint ventures of the Bank of New York Mellon Corporation where authorized and regulated as required within each jurisdiction. Unless you are notified to the contrary, the products and services mentioned are not insured by the FDIC (or by any government entity) and are not guaranteed by or obligations of the Bank of New York Mellon Corporation or any of its affiliates. The Bank of New York Mellon Corporation assumes no responsibility for the accuracy or completeness of the above data and disclaims all expressed or implied warranties in connection there with. Personnel of certain of our BNY Mellon affiliates may act as: (i) registered representatives of BNY Mellon Securities Corporation (in its capacity as a registered broker-dealer) to offer securities, (ii) officers of the Bank of New York Mellon (a New York chartered bank) to offer bank-maintained collective investment funds and (iii) associated persons of BNY Mellon Securities Corporation (in its capacity as a registered investment adviser) to offer separately managed accounts managed by BNY Mellon Investment Management firms.
Disclaimer for Non-US Clients: Prospective clients should inform themselves as to the legal requirements and tax consequences within the countries of their citizenship, residence, domicile and place of business with respect to the purchase and ongoing provision of advisory services. No regulator or government authority has reviewed this document or the merits of the products and services referenced herein.
This document is directed and intended for ‘institutional investors’ (as such term is defined in various jurisdictions). By accepting this document, you agree (a) to keep all information contained herein (the ‘Information’) confidential, (b) not use the Information for any purpose other than to evaluate a potential investment in any product described herein, and (c) not to distribute the Information to any person other than persons within your organization or to your client that has engaged you to evaluate an investment in such product.
Telephone conversations may be recorded in accordance with applicable laws.
© 2023 Insight Investment. All rights reserved.