Key Insights
- Securitized markets participated in the year‑end cross‑asset rally, leading to gains for 2023.
- After a relatively light 2023, issuance is expected to pick up a bit in 2024, but technicals remain positive.
- We currently like asset‑backed securities, are more neutral on commercial mortgage‑backed securities, and are less keen on collateralized loan obligations and non‑agency mortgages.
In 2023’s final quarter, securitized credit markets joined in the cross‑asset rally that kicked off at the end of October. At that juncture, Federal Reserve policymakers—including some of the more hawkish voices—began hinting that they were pleased with progress made in subduing inflation and could consider proactively cutting interest rates sooner than previously conveyed to facilitate a soft economic landing. The Fed’s December meeting confirmed the market’s growing speculation that the central bank was finished tightening and could begin lowering rates in the first half of 2024. Committee members forecast three cuts in 2024, up from two in the previous economic projections. Meanwhile, the market expected even more easing, with six 25‑basis‑point cuts implied in the fed funds futures market at year‑end.
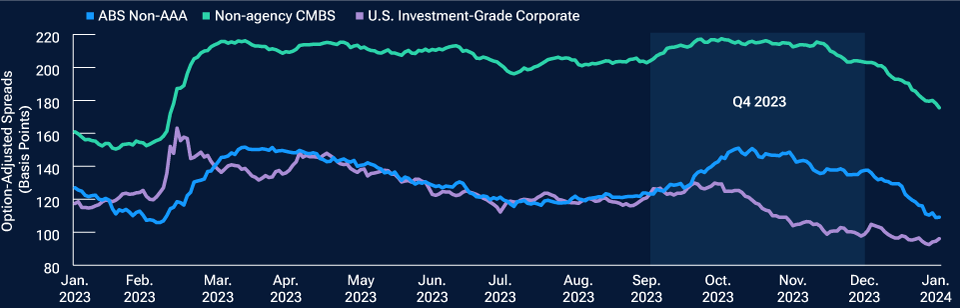
After being hammered by rapidly rising rates and high interest rate volatility in 2022 and the first half of 2023, securitized credit markets rallied strongly into year‑end, lifting total and excess returns mostly into positive territory. After starting slower than corporate credit, the securitized credit rally gained momentum in January, making up some lost ground (Figure 1).
Broadly strong performance to close out 2023
For the quarter, the four main flavors of securitized credit—asset‑backed securities (ABS), commercial mortgage‑backed securities (CMBS), collateralized loan obligations (CLOs)1, and non‑agency residential mortgage‑backed securities (RMBS)—delivered solid total and excess returns. With their shorter‑duration profiles, absolute returns for ABS and CLOs were less robust than those for the generally longer‑duration CMBS and RMBS markets2. From an excess return perspective, RMBS and CLOs were the market leaders amid significant credit spread tightening3. CMBS delivered positive excess returns, even at the lower end of the rating spectrum, where spreads remain quite wide. With spreads starting from tighter levels, ABS generally produced the lowest excess returns. Interestingly, despite strong risk‑on sentiment, AAA rated ABS, which trade at tight spread levels, outperformed non‑AAA rated ABS based on Bloomberg index data4.
For the full year, RMBS and CLOs generally produced the largest total and excess returns. Indeed, the JP Morgan CLOIE Post‑Crisis Index generated its best calendar year return—10.54%—since the CLO benchmark’s 2011 inception. CLOs rated below investment grade returned upward of 20%. ABS and non‑agency CMBS generated comparable total returns for the year at 5.54% and 5.42%, respectively5. Likewise, the sectors’ excess returns were similar; ABS produced 1.24% of spread‑driven return, while CMBS generated 1.14%. With fundamental concerns about the commercial real estate (CRE) market remaining an overhang, BBB rated CMBS, which possess thinner structural protections against collateral losses, ended 2023 with excess returns of ‑6.06%—one of the few negative areas in global credit markets. However, spreads at the bottom of the capital structure began to tighten as the securitized credit rally gained breadth and momentum into the new year.
Supply lower in 2023 ex ABS
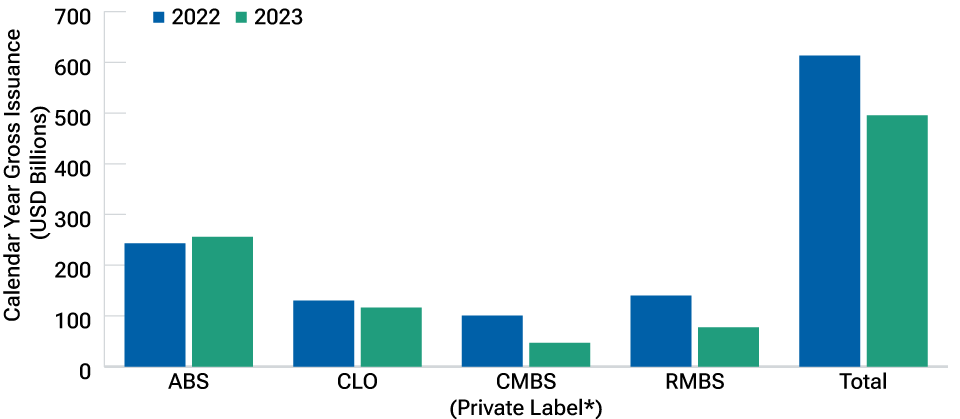
Overall issuance was significantly lower in 2023 compared with 2022, which itself saw a meaningful decline following record levels in 2021 (Figure 2). Gross supply in the private‑label CMBS market fell by 54% to USD 46.5 billion, though issuance picked up in the second half of the year as sentiment gradually improved. In contrast with the prior year, supply was heaviest in the conduit market, down only 16%. The single‑asset/single‑borrower (SASB) and CRE CLO subsectors saw declines of 77% and 70%, respectively, as an inverted yield curve and high risk premiums due to fundamental concerns made financing in those mostly floating rate markets prohibitive.
The RMBS market likewise experienced a significant decline in gross issuance across the board. After being hit with more supply than the market could handle in 2022, RMBS issuance dropped by nearly half in 2023 to USD 77 billion. In percentage terms, the biggest declines were in the agency investor, nonperforming loan, single family rental (SFR), and credit risk transfer (CRT) subsectors, while the reperforming loan and nonqualified mortgage (non‑QM) subsectors experienced smaller drop‑offs. Net issuance was essentially zero as the amount of older bonds that were paid down largely offset new issuance, providing an important technical support for the market.
Gross supply of CLOs stood at USD 116 billion, down from USD 130 billion in 2022 but comparable with the years prior to the global pandemic. About 83% of the 2023 total was true new issuance, though refinancings, resets, and reissues of previous deals edged higher than 2022.
The ABS sector bucked the trend and saw supply increase by 5% to USD 256 billion. Bonds backed by auto loans and leases accounted for much of the increase. Issuance declined for credit cards, utility, and whole‑business securitizations and was relatively flat in most other areas.
Supply may pick up somewhat in 2024
After a lull around the December holidays, the primary market ramped up in the first weeks of the new year as issuers took advantage of overwhelming demand. In January, many new deals were several times oversubscribed as investors competed for securitized bonds. Tight spreads in the investment‑grade corporate market and strong flows into diversified fixed income funds led asset managers to put cash to work in securitized markets. As a result, spreads have significantly narrowed from their 2023 wides, resulting in less compelling valuations and conviction downgrades from our securitized products team, as we will discuss.
In 2024, supply is expected to be somewhat higher than in 2023, particularly if the Fed cuts rates proactively and is successful in engineering a soft economic landing. A higher‑for‑longer rate environment or cuts in response to a recession could subdue issuance. We expect volumes for ABS to be in line with or slightly higher than those for 2023. Credit card issuance could be lower if banks tighten lending standards amid rising delinquencies. On the other hand, auto loan ABS supply is likely to remain high. And there could be a pickup in issuance of credit‑linked notes, infrastructure (e.g., fiber and data center), dealer floor plan, and student loan ABS.
CLO issuance could be slightly higher this year. The arbitrage incentive for issuers is strained because bank loan spreads have tightened relative to CLO liability spreads over the past year. However, that factor does not always deter issuance, as witnessed in 2018–2019. Moreover, an ample amount of CLOs are trading near or above par value, which could encourage a refinancing wave. And demand from Japanese institutions could increase, especially if the gap between U.S. and Japanese rates compresses, reducing hedging costs. U.S. banks could also return to the market, particularly if lower money market yields ease the pace of deposit outflows.
Supply for RMBS is likely to rise slightly if mortgage rates decline from expensive levels and continued strength in the labor market encourages homebuying. Likewise, CMBS supply could see an increase if borrowing costs fall to levels that make refinancing property loans more economical. A sustained improvement in sentiment and demand, which would likely require some positive developments, could also stimulate supply.
A battle between technicals and valuations
Entering 2024, we have witnessed a competition between valuations and market technicals. So far, technicals are winning the contest. Demand has overwhelmed abundant supply despite valuations having broadly risen, in many cases, to the more expensive side of fair value. BBB rated CMBS stand out as the lone remaining area of real cheapness. While that area is beginning to look interesting as higher‑quality CMBS offer less value, it is certainly not for the faint of heart, given expected volatility. The real risk of losses for lower‑rated CMBS also demands careful collateral and deal structure analysis. Whether the recent supply and demand imbalance is a seasonal fillip or a more lasting trend remains to be seen, but we expect spreads to continue to tighten in the near term as securitized credit markets play catch‑up to corporate credit markets.
ABS still attractive
Our securitized team’s sector screening framework begins with an analysis of valuations and then adjusts for fundamental trends, liquidity and sentiment, and technical factors. With this framework, we currently see the best opportunities in ABS. We recently downgraded our conviction in CMBS to neutral. We downgraded our outlook for RMBS to negative and maintained lower conviction in CLOs due mainly to valuations, though we still see pockets of opportunity in both sectors.
Based on our relative value analysis, valuations for ABS are positive to neutral as new issues often offer at least some pricing concession to help the market digest the heavy supply. Sector fundamentals are broadly neutral. Consumer bankruptcies have been increasing, and the resumption of student loan payments is a headwind that will crimp the ability of some borrowers to make debt payments. We expect continued—but manageable—increases in delinquencies and losses across consumer ABS. Yet most deal structures have more than enough credit enhancement to absorb expected losses even in a worst‑case economic scenario. Meanwhile, liquidity and sentiment are overwhelmingly positive, leading us to believe that spreads could hold firm or tighten further.
Within ABS, our analysts’ best ideas are currently in whole‑business securitizations—bonds backed by essentially all of the cash‑generating assets of companies like restaurant chains and fitness franchises—trading at discounted prices. We also like discounted timeshare bonds. In both cases, we believe specific issues will be called before maturity, which would result in price appreciation. We also like subordinated equipment and certain types of prime auto loans and leases.
A neutral view on CMBS
We lowered our outlook on CMBS to neutral. As noted, while there is still cheapness in lower‑quality CMBS, senior and junior AAA rated issues that have less credit risk no longer look as enticing from a valuation perspective. Sector fundamentals remain on a negative trajectory, with delinquencies and negative headlines most acutely affecting the office segment, where limited access to capital is pressuring issuers. Even if defaults are avoided, there remains a continued risk that office loans are modified or extended if borrowers are unable to fully pay off principal at maturity. There are also fundamental concerns for retail loans as sales increasingly move from physical stores to online channels, and for multifamily properties, particularly floating rate bonds issued in 2021–2022 when prices for apartment buildings peaked. Industrial properties and more senior conduit bonds look better from a fundamental perspective.
Areas in CMBS that we favor include seasoned lodging‑related SASB bonds that have continued cash flow growth and are nearing maturity. We believe some will be refinanced or paid down before the final maturity date, potentially leading to price gains. In the multifamily space, subordinate bonds issued by Freddie Mac that lack a government guarantee could benefit from strong technicals due to scarcity and solid collateral performance. And we see pockets of opportunity in more senior conduit new issues offering high coupons.
Less constructive on CLOs and RMBS
CLOs have the least attractive valuations of the major sectors. Fundamentals are not overly concerning but are also not shining. The major rating agencies continue to downgrade more leveraged loans than they upgrade. Falling interest coverage ratios due to high rates and weaker earnings growth may exacerbate this trend. Our high yield team believes that the bank loan default rate will rise closer to 4% by year‑end, which is above the longer‑term average but not excessive. However, in default situations, recovery rates have been trending well below historical levels. An increasing amount of outstanding CLOs are also nearing the end of their reinvestment periods, when active trading is no longer allowed, so it is important to monitor the remaining loans in CLO portfolios for default risk. We partner with our high yield analyst team to do so.
Rather than outright selling CLOs, we have shifted our focus. With spreads much tighter on existing deals, we have focused less on the secondary market and instead have turned more to the primary market, looking for deals offering decent price concessions. Spreads on AAA rated CLOs have tightened significantly relative to AA rated CLOs, and we are now favoring the latter. We are also looking to shift assets into CLO managers that we hold in high regard.
Finally, we have a less constructive view on RMBS due solely to valuations. Fundamentals remain stable. There has been modest fundamental deterioration in spots, but continued home price appreciation has helped homeowners build equity, and a strong labor market helps mortgagors keep up with payments. Sentiment and liquidity have improved, and technicals remain positive with a steady supply of bonds being well received. That said, the market is pricing in a very low probability of tail risks should there be a market liquidity event or sudden economic data downturn.
Within RMBS, we generally prefer seasoned SFR bonds and see return opportunities in select discounted non‑QM bonds if rates rally. Likewise, we see potential in discounted agency investor bonds backed by investment properties, as well as in discounted prime jumbo loans. We are less keen on CRT securities, which performed very well in 2023. Our distaste is not due to credit concerns but rather due to limited further upside potential.
In 2024, supply is expected to be somewhat higher than in 2023....
Entering 2024, we have witnessed a competition between valuations and market technicals.
Authors
Christopher Brown, CFA
Head of Securitized Products and Fixed Income Portfolio Manager
Ramon de Castro
Portfolio Manager, Agency and Non‑agency Mortgages
Jean‑Marc Breaux, CFA
Sector Portfolio Manager, Securitized Credit
[2] Duration measures the sensitivity of a bond’s price to changes in interest rates. Bonds with longer duration have higher sensitivity to changes in interest rates.
Securitized credit lagged corporate credit in Q4 2023
(Fig. 1) Securitized markets played catch‑up in early 2024
January 31, 2023, through January 31, 2024.
Past performance is not a reliable indicator of future performance.
Source: Bloomberg Index Services Limited. Please see Additional Disclosures page for additional information.
Indexes shown are the Bloomberg Non‑Agency Investment‑Grade CMBS Index, the non‑AAA rated credit quality tranches of the Bloomberg ABS Index, and the Bloomberg U.S. Corporate Investment Grade Index.
A basis point equals one hundredth of one percentage point, or 0.01%.
Securitized issuance generally lower in 2023
(Fig. 2) ABS countered the trend, driven by auto‑loan supply
Source: JP Morgan. See Additional Disclosures.
*Excludes agency CMBS.
T. Rowe Price cautions that economic estimates and forward‑looking statements are subject to numerous assumptions, risks, and uncertainties, which change over time. Actual outcomes could differ materially from those anticipated in estimates and forward‑looking statements, and future results could differ materially from historical performance. The information presented herein is shown for illustrative, informational purposes only. Any forecasts are based on subjective estimates about market environments that may never occur. Any historical data used as a basis for this analysis are based on information gathered by T. Rowe Price and from third‑party sources and have not been independently verified. Forward‑looking statements speak only as of the date they are made, and T. Rowe Price assumes no duty to and does not undertake to update forward‑looking statements.
“Bloomberg®” and the Bloomberg ABS, Bloomberg Non‑Agency Investment Grade CMBS: Eligible for U.S. Aggregate Indexes, and the Bloomberg U.S. Corporate Investment Grade Index are services marks of Bloomberg Finance L.P. and its affiliates, including Bloomberg Index Services Limited (“BISL”), the administrator of the index (collectively, “Bloomberg”) and have been licensed for use for certain purposes by T. Rowe Price. Bloomberg is not affiliated with T. Rowe Price, and Bloomberg does not approve, endorse, review, or recommend this product. Bloomberg does not guarantee the timeliness, accurateness, or completeness of any data or information relating to this product.
Information has been obtained from sources believed to be reliable, but J.P. Morgan does not warrant its completeness or accuracy. The index is used with permission. The index may not be copied, used, or distributed without J.P. Morgan’s prior written approval. Copyright © 2024, J.P. Morgan Chase & Co. All rights reserved.
This material is being furnished for general informational and/or marketing purposes only. The material does not constitute or undertake to give advice of any nature, including fiduciary investment advice, nor is it intended to serve as the primary basis for an investment decision. Prospective investors are recommended to seek independent legal, financial and tax advice before making any investment decision. T. Rowe Price group of companies including T. Rowe Price Associates, Inc. and/or its affiliates receive revenue from T. Rowe Price investment products and services. Past performance is not a reliable indicator of future performance. The value of an investment and any income from it can go down as well as up. Investors may get back less than the amount invested.
The material does not constitute a distribution, an offer, an invitation, a personal or general recommendation or solicitation to sell or buy any securities in any jurisdiction or to conduct any particular investment activity. The material has not been reviewed by any regulatory authority in any jurisdiction.
Information and opinions presented have been obtained or derived from sources believed to be reliable and current; however, we cannot guarantee the sources’ accuracy or completeness. There is no guarantee that any forecasts made will come to pass. The views contained herein are as of the date written and are subject to change without notice; these views may differ from those of other T. Rowe Price group companies and/or associates. Under no circumstances should the material, in whole or in part, be copied or redistributed without consent from T. Rowe Price.
The material is not intended for use by persons in jurisdictions which prohibit or restrict the distribution of the material and in certain countries the material is provided upon specific request. It is not intended for distribution to retail investors in any jurisdiction.
Australia—Issued by T. Rowe Price Australia Limited (ABN: 13 620 668 895 and AFSL: 503741), Level 28, Governor Phillip Tower, 1 Farrer Place, Sydney NSW 2000, Australia. For Wholesale Clients only.
Canada—Issued in Canada by T. Rowe Price (Canada), Inc. T. Rowe Price (Canada), Inc.’s investment management services are only available to Accredited Investors as defined under National Instrument 45‑106. T. Rowe Price (Canada), Inc. enters into written delegation agreements with affiliates to provide investment management services.
Colombia, Chile, Mexico, Perù, Uruguay—This material is prepared by T. Rowe Price International Ltd ‑ Warwick Court, 5 Paternoster Square, London, EC4M 7DX which is authorised and regulated by the UK Financial Conduct Authority ‑ and issued and distributed by locally authorized distributors only. For professional investors only.
DIFC—Issued in the Dubai International Financial Centre by T. Rowe Price International Ltd which is regulated by the Dubai Financial Services Authority as a Representative Office. For Professional Clients only.
EEA—Unless indicated otherwise this material is issued and approved by T. Rowe Price (Luxembourg) Management S.à r.l. 35 Boulevard du Prince Henri L‑1724 Luxembourg which is authorised and regulated by the Luxembourg Commission de Surveillance du Secteur Financier. For Professional Clients only.
Hong Kong—Issued by T. Rowe Price Hong Kong Limited, 6/F, Chater House, 8 Connaught Road Central, Hong Kong. T. Rowe Price Hong Kong Limited is licensed and regulated by the Securities & Futures Commission. For Professional Investors only.
New Zealand— Issued by T. Rowe Price Australia Limited (ABN: 13 620 668 895 and AFSL: 503741), Level 28, Governor Phillip Tower, 1 Farrer Place, Sydney NSW 2000, Australia. No Interests are offered to the public. Accordingly, the Interests may not, directly or indirectly, be offered, sold or delivered in New Zealand, nor may any offering document or advertisement in relation to any offer of the Interests be distributed in New Zealand, other than in circumstances where there is no contravention of the Financial Markets Conduct Act 2013.
Singapore—Issued by T. Rowe Price Singapore Private Ltd. (UEN: 201021137E), 501 Orchard Rd, #10‑02 Wheelock Place, Singapore 238880. T. Rowe Price Singapore Private Ltd. is licensed and regulated by the Monetary Authority of Singapore. For Institutional and Accredited Investors only.
South Africa—Issued in South Africa by T. Rowe Price International Ltd (TRPIL), Warwick Court, 5 Paternoster Square, London EC4M 7DX, is an authorised financial services provider under the Financial Advisory and Intermediary Services Act, 2002 (Financial Services Provider (FSP) Licence Number 31935), authorised to provide “intermediary services” to South African Investors. TRPIL’s Complaint Handling Procedures are available to clients upon request. The Financial Advisory and Intermediary Services Act Ombud in South Africa deals with complaints from clients against FSPs in relation to the specific services rendered by FSPs. The contact details are noted below: Telephone: +27 12 762 5000, Web: www.faisombud.co.za, Email: info@faisombud.co.za
Switzerland—Issued in Switzerland by T. Rowe Price (Switzerland) GmbH, Talstrasse 65, 6th Floor, 8001 Zurich, Switzerland. For Qualified Investors only.
UK—This material is issued and approved by T. Rowe Price International Ltd, Warwick Court, 5 Paternoster Square, London EC4M 7DX which is authorised and regulated by the UK Financial Conduct Authority. For Professional Clients only.
USA—Issued in the USA by T. Rowe Price Associates, Inc., 100 East Pratt Street, Baltimore, MD, 21202, which is regulated by the U.S. Securities and Exchange Commission. For Institutional Investors only.
© 2024 T. Rowe Price. All Rights Reserved. T. ROWE PRICE, INVEST WITH CONFIDENCE, and the Bighorn Sheep design are, collectively and/ or apart, trademarks of T. Rowe Price Group, Inc.
ID0006749 (02/2024)
202402‑3374920