As we get under way in 2022, a combination of factors could lead to periods of higher volatility in both interest rates and credit spreads. Another global wave of COVID-19-induced remote work and partial lockdowns are affecting everyday lives as well as the broader economic outlook. Most central banks have started reducing monetary policy support, with some starting to raise policy rates. More US fiscal stimulus is still on the table, but midterm elections could stall negotiations. The pandemic has also snarled supply chains, exacerbating inflationary pressures. And economic growth remains challenged.
Download PDF
Unlike mutual funds or hedge funds that can experience outflows in volatile markets, well-established insurance companies typically see steady inflows from policy premiums, regardless of volatility. Demand for life-insurance policies has surged since COVID-19 arrived, and higher savings rates have spurred annuity sales. Strong, reliable inflows make insurers one of the largest global bond investors, and we expect fixed-income demand to remain strong regardless of market conditions.
If volatility returns in 2022, insurance investors have another opportunity to reposition their portfolios and take advantage of market dislocations. We recommend three avenues to enhance risk-adjusted income in portfolio construction: favor collateralized loan obligations (CLOs), add emerging markets (EM) as credit spreads widen and maximize opportunities in private assets.
Regarding private assets, we see particular value in investment-grade private placements and commercial real estate debt. For insurers who can provide liquidity, we think the private placement market can be an attractive supplement for public bond portfolios, given their extra protection from covenants and potential added economics from make-whole prepayments and coupons. Within commercial real estate, we favor transitional lending: we see the supply of upcoming maturities driving demand for capital combined with attractive deal terms that have generally been lender-favorable.
Macro Backdrop: Interest Rates Likely to Rise
With inflation no longer viewed as transitory, yields on global government bonds have risen from pandemic lows, and year-over-year inflation rates should stay elevated. Given these factors and potential near-term rate hikes, we expect interest rates, especially in short and intermediate maturities, to rise as the economy improves and people return to work. In our view, the market appreciates the risks from the increase in rates—only a surprise in the pace and magnitude of hikes would be a curveball. Investors should monitor the increase in real rates closely, and we expect the relationship between COVID-19, inflation and monetary policy to remain front and center throughout 2022.
Supply: Insurers Have Plenty to Choose From
Strong demand for US dollar–denominated assets has fueled robust issuance, with a combined $9 trillion of net issuance over the past two years. Net issuance in Europe has also grown, topping $300 billion in both 2019 and 2020, giving investors more options to steer capital across regions and currencies.
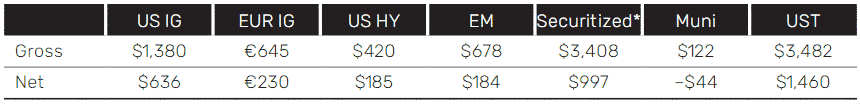
Looking ahead, market consensus points to robust debt issuance again in 2022, though growing more slowly than in 2021: forecasts call for $9.5 trillion of gross US debt issuance ($3.4 trillion net issuance). While the heavy new-issuance calendar could mean more opportunities for insurers to choose from, it also poses the risk of pushing spreads wider if demand from other investor segments falters.
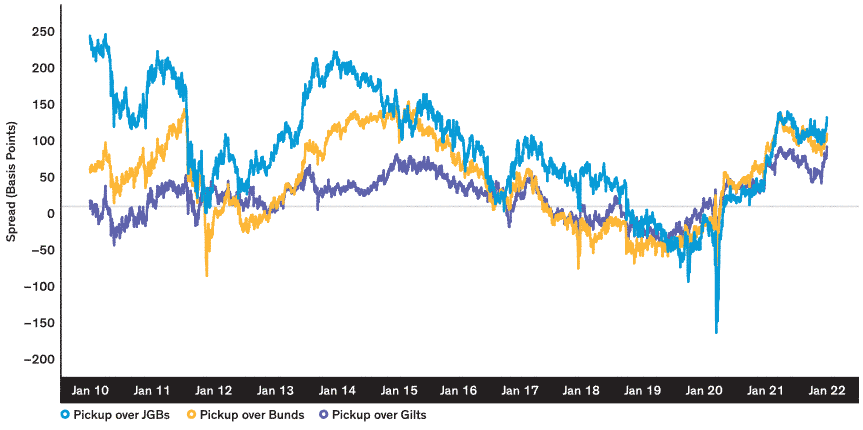
On an FX-adjusted basis, US government bond yields look more attractive than those of comparable Bunds or JGBs (Display 1). Non-US based insurance investors should look to take advantage of higher FX-adjusted yielding assets in the US. Historically, we’ve seen large inflows from foreign investors when FX-adjusted yields become attractive or when local bond supplies are limited (due to either supply constraints or excess demand from local central banks).
2022 Issuance Forecasts $Bn
Current analysis and forecasts do not guarantee future results.
Sources: JPM, Citi, BofA, Barclays, Goldman Sachs
*Securitized Gross includes ABS: asset-backed security, Agency MBS: mortgage-backed security, CLO: collateralized loan obligation, CMBS: commercial mortgage-backed security, CRT: Credit Risk-Transfer Securities, RMBS: residential mortgage-backed security; Net includes all except ABS
Display 1: Relative Attractiveness of US Government Bonds
US Treasury Pickup vs. Foreign Sovereign Debt
Current analysis does not guarantee future results.
Source: Wells Fargo Securities
Sector Outlook and Positioning Recommendation
Rates and Term Structure Matter: Prefer Floating-Rate vs. Fixed-Rate Structure
Interest rates will likely be the main driver of credit spread changes in 2022, and yields have already turned upward in the first few weeks of the year, especially in the front end. We can study any number of past rate-hike cycles for perspective, but we believe that the cycle starting in December 2015 (one rate hike) and the one starting in December 2016 (multiple rate hikes through late 2019) are most relevant.
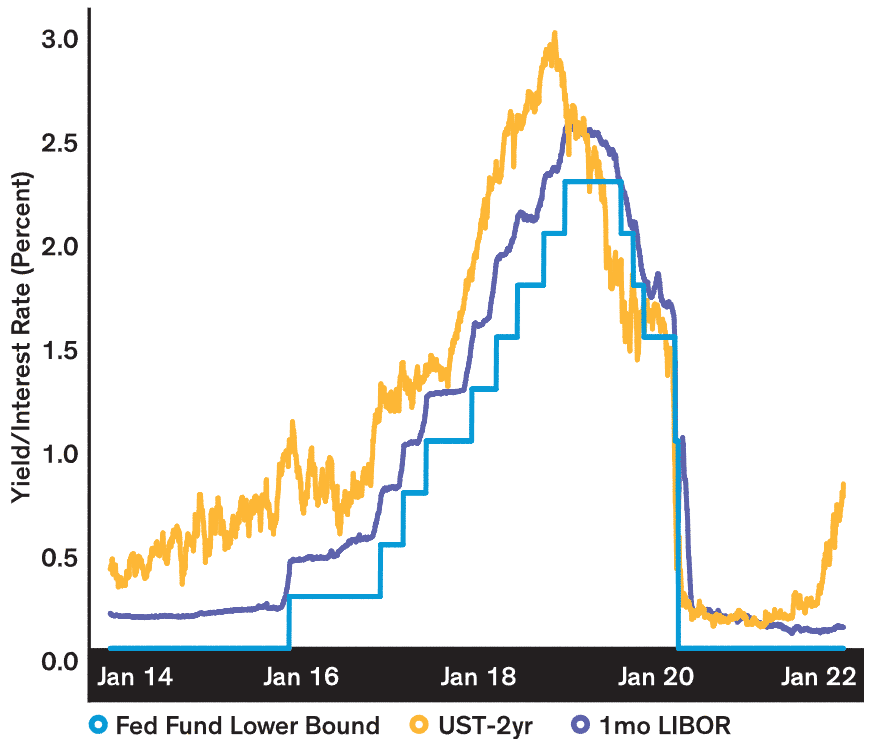
Historical data demonstrate that short-term US Treasury yields—the two-year yield, for example—reflect the market’s expectations for the future path of interest rates (Display 2). Year-to-date, the two-year yield has risen more than 70 basis points (b.p.). LIBOR tends to be anchored to the Fed funds. Unlike fixed-rate assets, prices on floating-rate assets pegged to LIBOR are generally insulated from the impact of higher rates. So, when the Fed raises policy rates, LIBOR should rise by more, giving floating-rate securities higher coupon rates going forward.
Display 2: Short-Term Rates Reflect Market Expectations
Current analysis does not guarantee future results.
Source: Bloomberg, AB
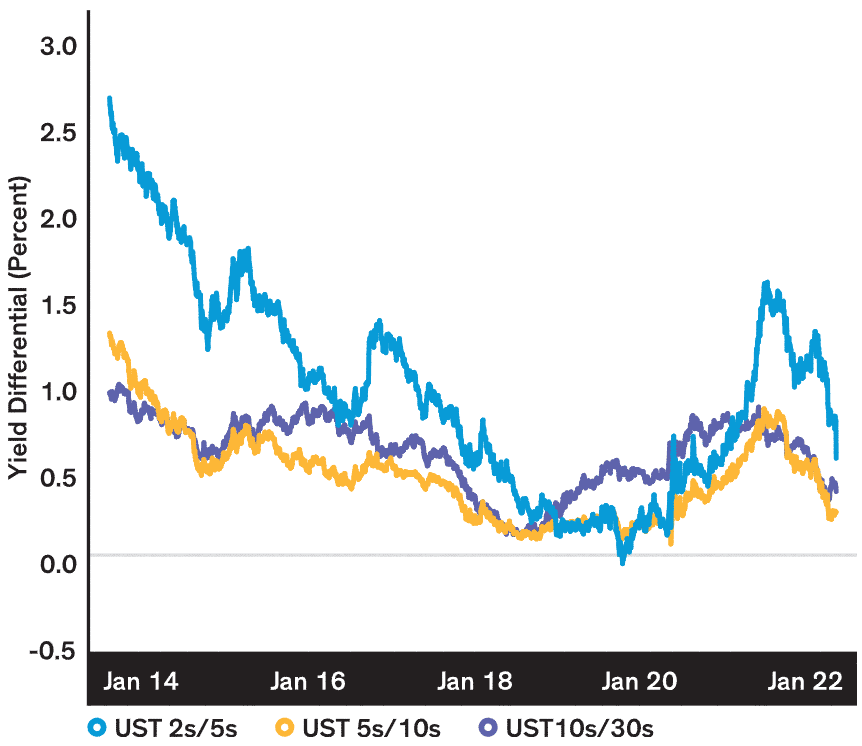
Display 3: US Treasury (UST) Curve Comparison
Current analysis does not guarantee future results.
Source: Bloomberg, AB
In the 2016 rate-hike cycle, the 2/5-year portion of the yield curve bear-flattened as 2-year yields rose faster than 5-year yields. This eventually pushed that segment of the curve into inverted territory, which many consider to be a leading indicator of an approaching economic recession. The 5/10-year and 10/30-year segments of the curve both flattened initially, but the 10/30-year segment reversed course and started to steepen again in mid- to late-2018, toward the end of the cycle.
We expect the yield curve experience to resemble the one from the 2016 cycle (Display 3). Yields should gradually rise in 2022, with increases concentrated in the front and intermediate parts of the curve. Our economic forecast is for at least three Fed rate hikes next year, the first one by 25 b.p.; we expect the 10-year US Treasury yield to hover around 1.75%-2.25%, resulting in a flatter US Treasury yield curve.
Express Rate Views by Deploying Incremental Cash Flows
Insurers are less likely to reposition their portfolio term structures in response to rate volatility, because specific cash-flow and duration-matching objectives are unique. But they can express their rate views by deploying incremental flows or excess liquidity after meeting asset-liability matching (ALM) objectives. Insurers should also explore strategies that serve dual purposes: achieving ALM and being opportunistic in response to market movements. In our view, a credit-duration barbell is worth considering: it would satisfy ALM while focusing more heavily on credit-spread duration than interest-rate duration.
For example, insurers could replace a portion of fixed-rate allocations with floating-rate assets that have a principal-payment profile (or spread-duration profile) similar to their fixed-rate counterparts. In effect, this strategy would maintain spread duration (satisfying ALM needs) and reduce interest-rate duration in a rising-rate environment.
Let’s assume that an insurance company has a liability requiring cash flows from 3-year, 5-year, 7-year, 10-year and 30-year assets. Traditional ALM would call for buying fixed-rate assets in those maturity buckets. However, in a rising rate environment, the insurer would miss out on investing at higher future yields if it allocates only to fixed-rate instruments. As a way to maintain the overall cash-flow profile but reduce duration risk, the insurer could explore adding floating-rate assets like collateralized loan obligations (CLOs), replacing the 5-year and 7-year fixed-rate assets. The cash-flow profile would stay the same and unrealized losses would be insulated by the higher coupon resets from floating-rate allocations.
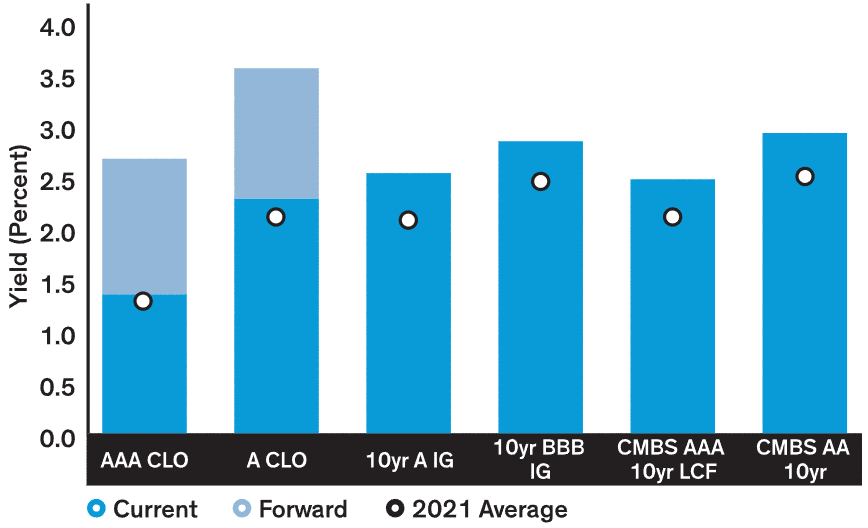
Display 4: CLO Upside Potential
Current analysis and forecasts do not guarantee future results.
Note: CLO forward yields using market pricing convention
As of January 15, 2022 | Source: JPM, AB
Despite Demand, Still Value in CLOs
Insurers’ demand for private-label US securitized assets, particularly CLOs, has grown in recent years. Insurance investors have once again become more comfortable with securitized assets—a comfort that had declined in the wake of the Great Financial Crisis (GFC). CLOs offer attractive yield-spread advantages compared with lower-rated investment-grade corporates, and they stand to benefit from higher rates (Display 4).
We continue to see value in CLOs and would recommend an allocation to this sector, though the popularity of the trade with insurance investors has made it somewhat less attractive. US insurers held about 20% of outstanding US CLOs as of 2020. While the 2021 figure hasn’t been released yet, we wouldn’t be surprised to see a higher share. Despite the sector’s growth, it’s still relatively illiquid, especially in secondary issues. In 2021, $29 billion of CLOs were exchanged, a 3.6% decline from 2020 levels; excluding B-rated and equity tranches, trading was down 10.5% from 2020.
Greater regulatory scrutiny in recent months adds to the CLO challenges. Also, while spreads are still attractive, the recent increase in rates has diminished the all-in yield advantage for floating-rate assets versus fixed-rate assets. For these reasons, the attractiveness of this trade has dampened, but we still find value in allocating to CLOs, given the portfolio-construction benefits of floating-rate assets in a rising-rate environment.
We see value in other securitized assets classes, too, particularly in commercial mortgage-backed securities (CMBS), esoteric asset-backed securities (ABS) and a new generation of non-agency residential mortgage-backed securities (RMBS).
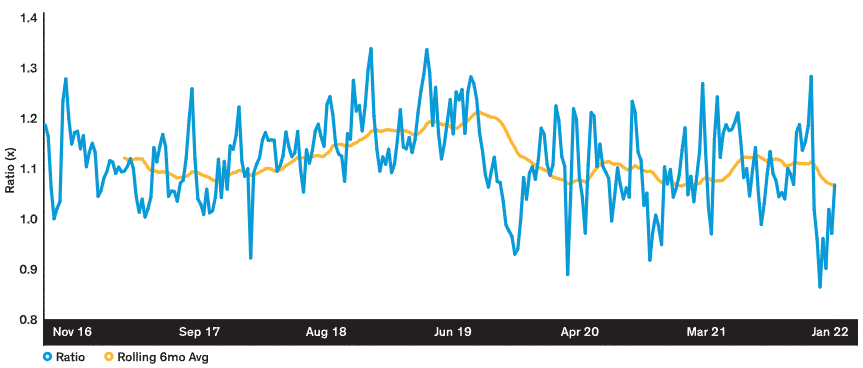
Display 5: Ratio Of A-Rated Corporates To AAA-Rated CMBs
Current analysis and forecasts do not guarantee future results.
Source: Bloomberg, AB
Despite Demand, Still Value in CLOs
- Insurers have been steady CMBS buyers, accounting for about 20% of the outstanding market, but most insurance companies also invest in direct loans—commercial mortgage loans (CML). Overall real estate exposure is a key consideration for insurers, so we see a natural cap on incremental CMBS appetite. That’s because relative value must be assessed across all commercial real estate sectors: CMLs, CMBS and real estate investment trusts (REITs).
- At current yield spreads, we see marginally better relative value in conduit CMBS versus investment-grade (IG) corporates (Display 5), though we expect the gap to close. We also think insurers can benefit from allocating to single-asset, single-borrower (SASB) and commercial real estate (CRE) CLOs, because these once-smaller CMBS subsectors have recently grown. SASB and CRE CLOs made up 70% of 2021 total CMBS gross issuance, compared with less than 30% in 2011. We like these assets’ floating-rate nature in a rising rate environment; we recommend focusing on the top of the capital structure, since these assets can be prone to idiosyncratic risk. Esoteric ABS offer attractive value, especially given the climb in shorter-term rates in 2022. But we view this trade as opportunistic: the market is still small, making it hard to build a significant allocation.
- Insurance investors should monitor opportunities in the second-generation (2.0) non-agency RMBS market. We’ve seen rising new collateral origination from private mortgage companies as a result of a strong US housing market and pullback of government-sponsored enterprise (GSE) financing. In 2021, jumbo 2.0, non-qualifying mortgages and investor-pool RMBS gross issuance reached $110.5 billion. Insurance companies should seek to tap into 2.0 non-agency sectors, given that strong housing fundamentals are expected to continue in 2022.
Emerging Market Debt: Buy Into Spread Widening
Headwinds Likely to Fade During 2022
EM debt benefited from a series of tailwinds in 2021, including policy support, compelling valuations versus developed markets (DM) and a positive technical environment. We expect more of a balance between headwinds and tailwinds for this asset class in 2022, which will create opportunities and challenges for investors.
Several factors could contribute to EM volatility in the coming year, including a declining growth gap between EM and DM gross domestic product (GDP). More stubborn global inflation and hawkish policy tilts from most global central banks will also create some ups and downs. Slowing growth in China and several meaningful EM elections could also contribute to volatility.
However, we see most of these headwinds fading as the year progresses, which should shift the balance in favor of several tailwinds that could provide an attractive entry point. For one thing, despite the declining GDP growth gap, we still expect robust global growth to support EM economies. Those economies are still in a relatively comfortable external position, with basic balances near 20-year highs. Another plus is that weak EM prices late in 2021 have created pockets of value, while the exit of crossover investors has left a cleaner technical backdrop behind.
Strategic EM Debt Allocation Remains Warranted
Despite near-term headwinds in EM, we continue to advocate a strategic allocation to EM for insurance companies, given its strong historical performance relative to DM.
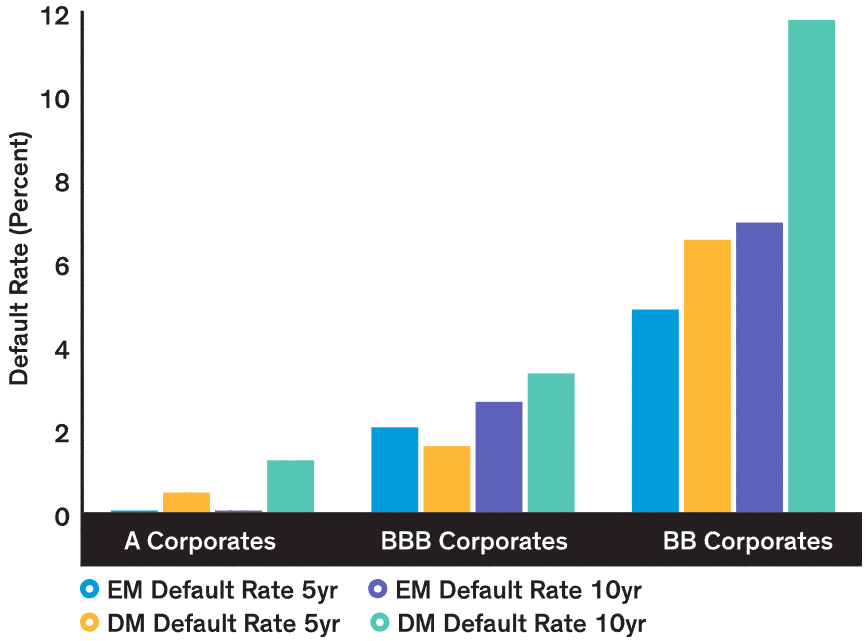
One aspect of EM’s relative attractiveness versus DM is within default rates (Display 6). According to S&P’s annual default study, EM corporates compare favorably with DM in the A-rating category; the picture is more mixed in BBB, with EM default rates slightly higher over the 5-year period but slightly lower over 10 years. EM default rates have been materially lower than DM default rates in the BB cohort. While capital-intensive, at times, BB EM corporates offer attractive risk-adjusted relative value versus BB DM corporates.
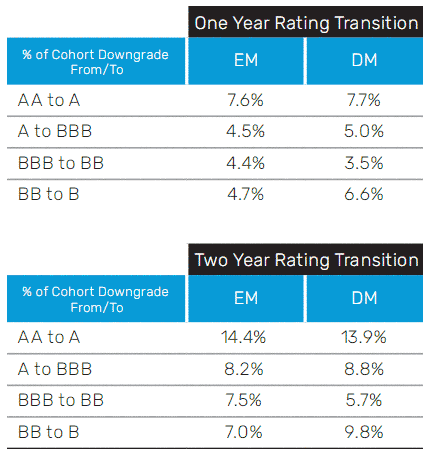
Most insurance capital regimes rely on ratings from agencies. Therefore, in addition to historical default rates, rating migration is equally important—downgrades could lead to higher capital charges. As shown below, EM rating migration compares favorably to DM in the AA, A and BB categories (with EM downward rating migration generally at or below DM). Meanwhile, EM downward migration in BBB appears somewhat higher than DM (the BBB category represents the largest rating category in terms of EM outstanding debt).
Display 6: EM VS. DM Default Rates
Cumulative Average
Historical analysis does not guarantee future results.
Source: S&P EM Default Study: 1997-2019. Includes corporates only.
Comparison of EM and DM Rating Transitions
Current analysis does not guarantee future results.
Source: S&P EM Rating Study—covering rating changes over 1997-2019 period, corporates only
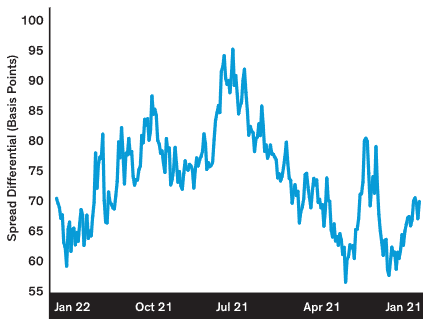
Display 7: Relative Widening Between EM IG VS. US IG Presents Opportunity To Add
Current analysis does not guarantee future results.
Source: Bloomberg
A broad look at default and downgrade data for EM corporates suggests that the risk profile of the EM corporate sector isn’t much different than that of the DM corporate sector.
Unlike many other fixed income assets, EM is very heterogenous and fragmented. For example, EM corporates and EM sovereigns have performed differently in terms of spread movement during market shocks over the past 15 years. We analyzed cross-sector spread performance during the early days of the COVID-19 pandemic, the Fed overshoot in 2018, the commodity market distress from 2014 to 2016, the taper tantrum in 2013 and the GFC:
- EM government spreads have been less volatile than DM corporate spreads, except for during the 2013 taper tantrum.
- A-rated EM corporate volatility has been similar to that of A-rated DM corporates (again, except for the tantrum period).
- BBB-rated EM corporate spreads have widened more than DM BBB in absolute terms; in percentage terms, though, widening was comparable (except for during the taper tantrum).
- During the GFC, EM corporates widened more than their US industrial counterparts (both A and BBB) but less than US financials.
- The underperformance of EM during the taper tantrum highlights the general sensitivity of EM debt to central bank tightening cycles, which also partially explains why EM debt has underperformed DM since late 2021.
Based on the mix of EM headwinds and tailwinds, we prefer hard-currency sovereign and corporate debt, though it’s critical to be selective. Our historical analysis suggests a benefit from holding EM hard-currency assets over time, given their attractive risk-adjusted returns. Diverging fundamentals across a broad, diverse set of countries will drive distinctions across the asset class, making active management even more important.
It’s hard to time a perfect entry into EM, so we recommend a steady weighted-average-cost approach: accelerating investment when EM-to-DM spreads widen (Display 7) and slowing or pausing when spreads narrow. When adding EM to insurance portfolios, we’ve always preferred diversifying broadly across issuers, countries, industries and sectors. We think investors can take advantage of dislocations within this market with a measured approach. As the relative yield advantage for EM versus US IG increases, we’d view it as an opportunity for insurers to add exposure. Within EM, we believe EM sovereign debt is a good alternative to high-quality corporates at their current levels; moreover, EM corporates could bring higher risk-adjusted return than DM corporates when their basis widens.
Making the Most of Private Credit
Protecting the Downside with Private Placements
We see value in private assets, including private placements, private ABS and private credit, for insurance companies that can be a liquidity provider to these markets. Over the years, insurers have boosted their allocation to private assets to enhance income and diversification, and we expect private placements—the largest subsector of private assets—to remain a core allocation in 2022.
Private placements’ appeal stems from their potential risk mitigation, enhanced income and diversification.
To cushion against the downside, covenants could limit issuers from engaging in activities that might erode value for credit investors. From an income perspective, private placements still offer a yield premium over comparable public bonds, and insurers can pocket extra income from fees, coupon increases and make-whole premiums. Portfolio diversification is critical, and private placements offer industry, issuer and geographic diversification opportunities. The issuance pipeline has been strong over the past year, and investors can still reliably buy positions in size.
Attractive Environment for Commercial Mortgages
As we mentioned earlier, insurers often must consider their real estate exposure through multiple channels, such as CMBS, REITs and CML. We believe the CML space, similar to private placements, can provide a meaningful yield pickup versus public sectors for insurers who have liquidity to give. We saw a decline in transaction activity in early 2020 due to COVID-19 disruptions, but lending activity resumed in the fourth quarter. With financing activity also accelerating, levels quickly rebounded to those seen pre-COVID-19.
The supply of maturing loans is expected to be significant, which will generate consistent demand for capital, particularly in the transitional/pre-stabilized loan space. We’ve also seen borrowers increasingly favor unlevered transitional lenders due to the simple relationship, low execution risk and certainty of closing. Deal terms are expected to favor lenders over the foreseeable future, supported by an inconsistent reset of property valuations across certain sectors in selective markets, wider spreads and tighter covenant structures.
In Europe, we saw COVID-19 accelerate the lending market’s structural shift away from the dominant position of banks toward alternative lenders. Also, wider spreads and reduced competition in the region create a uniquely favorable entry point for insurers looking to add commercial real estate exposure via European lending platforms.
A Final Word
ESG will remain top of mind for insurers as they think about 2022 goals. Just as we’ve seen an influx of ESG structures in the market, investors are also likely to see an influx of tools and resources to help them evaluate investment opportunities and ESG-related portfolio risks. A better understanding of not only the ESG opportunity set but a portfolio’s ESG scores or carbon footprint enables more informed portfolio construction and meaningful policies on responsible investing.
In closing, we expect 2022 to be a challenging year, but insurance investors can enhance their income by embracing market volatility and a rising-rate environment. From a portfolio construction perspective, we think a spread-duration barbell strategy can help satisfy ALM while also focusing more heavily on credit-spread duration rather than interest-rate duration. Additionally, the floating-rate structure of CLOs should give investors a cushion against negative price action, with upside potential from a relative spread perspective.
Within EM, we recommend a structural allocation for insurers, given the attractiveness of spread and performance over its US counterparts. And in private assets, we think insurers with liquidity to give should pursue the investment-grade private placement market in addition to enhancing their real estate exposure via commercial mortgages.
Download PDF
There is no guarantee that any projection, forecast or opinion in this material will be realized. Past performance does not guarantee future results.
The information contained herein reflects the views of AllianceBernstein L.P. or its affiliates and sources it believes are reliable as of the date of this publication. AllianceBernstein L.P. makes no representations or warranties concerning the accuracy of any data. The views expressed herein may change at any time after the date of this publication. This document is for informational purposes only and does not constitute investment advice. AllianceBernstein L.P. does not provide tax, legal or accounting advice. It does not take an investor’s personal investment objectives or financial situation into account; investors should discuss their individual circumstances with appropriate professionals before making any decisions. This information should not be construed as sales or marketing material or an offer or solicitation for the purchase or sale of any financial instrument, product or service sponsored by AllianceBernstein or its affiliates.
Note to Canadian Readers: AllianceBernstein provides its investment-management services in Canada through its affiliates Sanford C. Bernstein & Co., LLC and AllianceBernstein Canada, Inc. Note to European Readers: European readers should note that this document has been issued by AllianceBernstein Limited, which is authorised and regulated in the UK by the Financial Conduct Authority. The registered office of the firm is: 50 Berkeley Street, London W1J 8HA. Note to Australian Readers: This document has been issued by AllianceBernstein Australia Limited (ABN 53 095 022 718 and AFSL 230698). The information in this document is intended only for persons who qualify as “wholesale clients,” as defined in the Corporations Act 2001 (Cth of Australia), and should not be construed as advice. Note to Readers in Vietnam, the Philippines, Brunei, Thailand, Indonesia, China, Taiwan and India: This document is provided solely for the informational purposes of institutional investors and is not investment advice, nor is it intended to be an offer or solicitation, and does not pertain to the specific investment objectives, financial situation or particular needs of any person to whom it is sent. This document is not an advertisement and is not intended for public use or additional distribution. AllianceBernstein is not licensed to, and does not purport to, conduct any business or offer any services in any of the above countries. Note to Readers in Malaysia: Nothing in this document should be construed as an invitation or offer to subscribe to or purchase any securities, nor is it an offering of fund-management services, advice, analysis or a report concerning securities. AllianceBernstein is not licensed to, and does not purport to, conduct any business or offer any services in Malaysia. Without prejudice to the generality of the foregoing, AllianceBernstein does not hold a capital-markets services license under the Capital Markets & Services Act 2007 of Malaysia, and does not, nor does it purport to, deal in securities, trade in futures contracts, manage funds, offer corporate finance or investment advice, or provide financial-planning services in Malaysia. Note to Singapore Readers: This document has been issued by AllianceBernstein (Singapore) Ltd. (“ABSL”, Company Registration No. 199703364C). AllianceBernstein (Luxembourg) S.à r.l. is the management company of the portfolio and has appointed ABSL as its agent for service of process and as its Singapore representative. AllianceBernstein (Singapore) Ltd. is regulated by the Monetary Authority of Singapore. This advertisement has not been reviewed by the Monetary Authority of Singapore. Note to Taiwan Readers: AllianceBernstein L.P. does not provide investment advice or portfoliomanagement services or deal in securities in Taiwan. The products/services illustrated here may not be available to Taiwan residents. Before proceeding with your investment decision, please consult your investment advisor. Note to Hong Kong Readers: This document is issued in Hong Kong by AllianceBernstein Hong Kong Limited (聯博香港有限公司), a licensed entity regulated by the Hong Kong Securities and Futures Commission. This document has not been reviewed by the Hong Kong Securities and Futures Commission. Note to Readers in Japan: This document has been provided by AllianceBernstein Japan Ltd. AllianceBernstein Japan Ltd. is a registered investmentmanagement company (registration number: Kanto Local Financial Bureau no. 303). It is also a member of the Japan Investment Advisers Association; the Investment Trusts Association, Japan; the Japan Securities Dealers Association; and the Type II Financial Instruments Firms Association. The product/service may not be offered or sold in Japan; this document is not made to solicit investment.
The [A/B] logo is a registered service mark of AllianceBernstein and AllianceBernstein® is a registered service mark used by permission of the owner, AllianceBernstein L.P.
© 2022 AllianceBernstein L.P., 1345 Avenue of the Americas, New York, NY 10105