


BondCliQ
85 Broad Street
New York 10004
info@bondcliq.com
(929) 276-2547

Chris White
Founder / CEO
The BondCliQ Team
About BondCliQ
BondCliQ is a Daas solution specifically designed to optimize corporate bond market data for all market participants. Our advanced data infrastructure allows us to deliver an enhanced comprehensive suite of innovative suite of intelligence products that can be customized and easily integrated into technology ecosystems.
Making Market Data Easy
Our dynamic dashboards put credit markets in the palm of your hands.
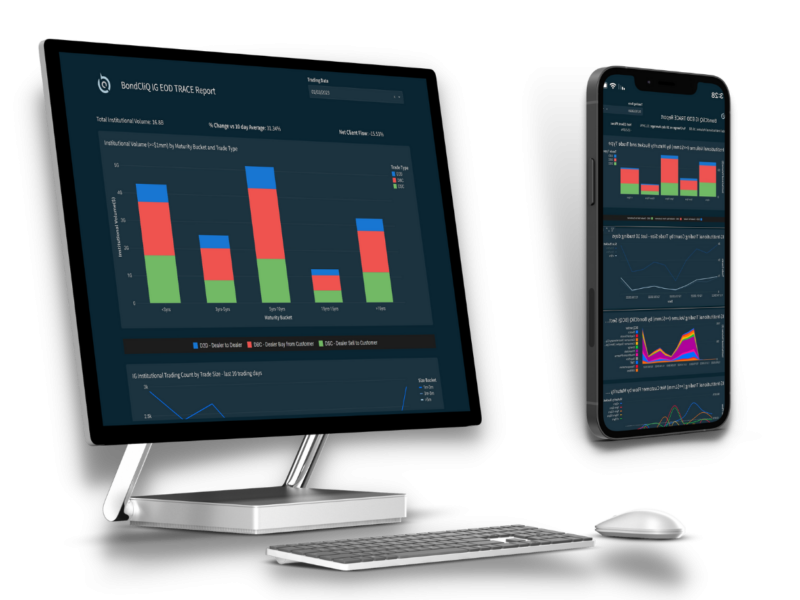
Institutional IG or HY End of Day TRACE Dashboard
The IG and HY EOD TRACE Dashboards, delivered daily, allow the user to quickly source the holistic and granular information they need to stay ahead of the curve on institutional liquidity.
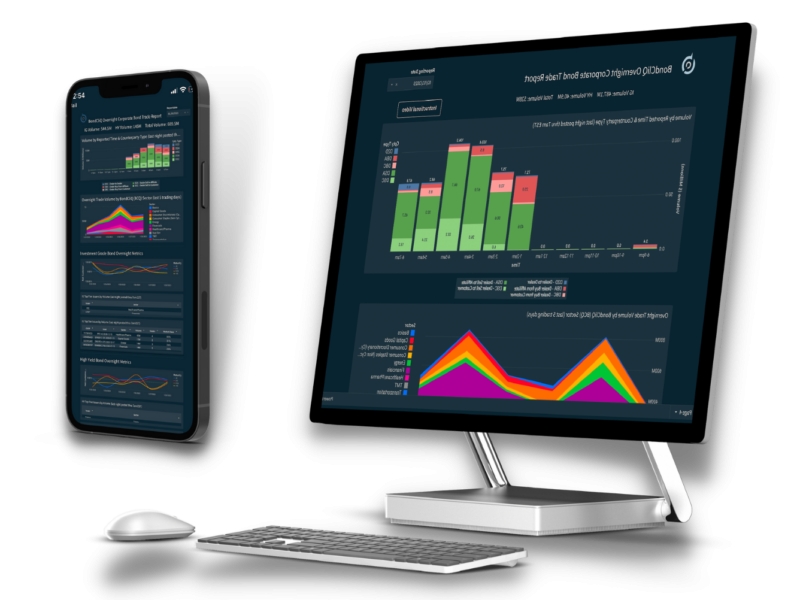
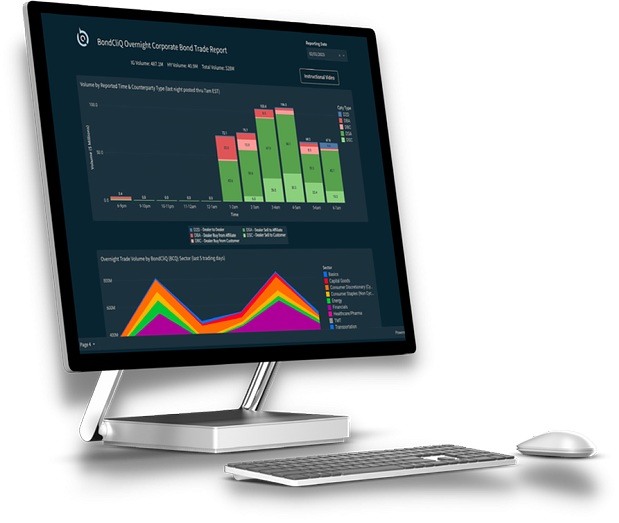
Overnight Trade Dashboard
The Overnight Trade Dashboard is a dynamic, multi-display dashboard that allows the viewer to quickly visualize previous night Investment grade and high yield Corporate Bond trade volume with dynamic easy-to-view visuals.
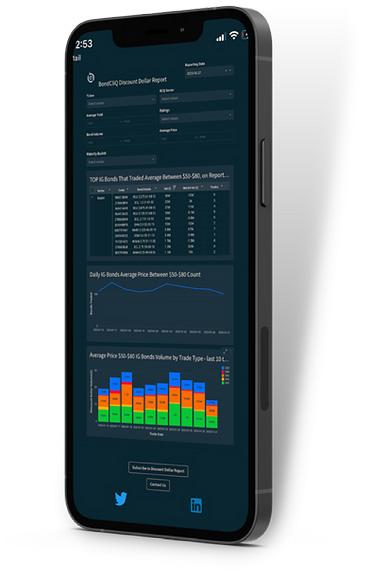
Discount Dollar Dashboard
The Discount Dollar Dashboard is a dynamic dashboard that captures data for all investment grade bonds that traded between $50 and $80 the previous trading day and is emailed to the user the following morning.
Portfolio Trading Dashboard
This dashboard highlights previous week investment grade and high yield Portfolio Trading volumes. We present how portfolio trading flows compare to non-portfolio trading flows conveniently broken down by sector and maturity buckets. We also display data on the top 20 portfolio trades on the week via a table with sortable filters.