An examination of underwriting metrics and losses through 60 years of economic cycles
Executive Summary
- We compiled the longest-known dataset of commercial mortgage-loan performance, ranging from 1957-2020, with more granular performance information from 1974-2020.
- We used this history to re-examine findings from other commercial mortgage studies and confirmed that loans underwritten late in economic cycles carry more risk, but found the risk was mostly limited to higher-leverage loans.
- We also examined common underwriting metrics for their efficacy as measures of risk throughout economic cycles and found that the efficacy of debt-yield is increased when measured relative to capitalization rates.
Overview
Commercial mortgage loans (CMLs) have become an important component of private investment portfolios over the past 30 years. Interest in commercial mortgages began growing as the sector was institutionalizing in the 1990s1 and continued to grow in more recent years as mortgages found utility within an expanding array of investment structures. Private commercial mortgage-debt funds, for instance, have shown 11% average annual fundraising increases over the past 10 years.2
Increasing interest in the sector has also brought increasing levels of historical performance information and analytical tools to assist investors with managing risk. This report is part of MetLife Investment Management’s (MIM) and Moody’s continuing contribution to that effort. In this report, we will discuss the challenge of using loan-to-value (LTV), debt-service coverage ratios (DSCR), and debt yield to underwrite commercial mortgages throughout the economic cycle. In general, loan-to-value is understood to mean the amount of debt loaned against a property, divided by the value of a property. Debt-service coverage ratio refers to the net operating income of property, divided by the debt service payment. Lastly, debt yield is the net operating income, divided by the outstanding principal balance on a property.

This report is an update and expansion from the 2005 report “Case Study of Leverage and Default Risk over a Full Real Estate Cycle,” published by Moody’s and based largely on MIM’s commercial mortgage-portfolio history. This report expands on that analysis in four ways. First, we updated the study’s results with 16 years of additional MIM commercial mortgage experience (2005-2020) and include commercial mortgage-backed securities (CMBS) performance from 1998-2020 from Moody’s. CMBS are essentially pools of commercial mortgages, packaged to be purchased as one instrument, or several instruments with distinct credit characteristics. Second, we provide our thoughts on why different underwriting metrics were better or worse in helping investment managers understand and limit losses during previous economic cycles. Third, we discuss the historical performance of common underwriting metrics and highlight potential limitations of the debt-yield measure that became increasingly popular after 2008. Finally, we offer thoughts on the unique risks posed by loans underwritten late in an economic cycle.
A Brief History of Commercial Mortgage Default Risk Studies
Over the past thirty years, the availability of commercial mortgage-performance history has increased substantially. As a result, lenders have become more efficient at analyzing mortgages. In the early 1990s, performance history from life insurance companies was generally all that was available for study (bank loans also existed, but they often relied on sponsor guarantees and mortgage collateral). The advent of CMBS increased liquidity in the commercial mortgage market and contributed to better information collection and transparency of commercial mortgage pricing.
Major studies of private mortgages and CMBS are discussed below. However, CMBS was still a new asset class during the 1990s. As a result, there were limited studies done on CMBS performance during this period.
However, once introduced, these instruments became increasingly popular as more investors could now purchase interests in commercial mortgages, thus increasing liquidity in the overall commercial mortgage market. As the availability of historical performance results increased, studies and reports focused on commercial mortgages evolved and refined our understanding of the sector. Although we haven’t listed all of the studies on the commercial mortgage market, below we briefly summarize key findings from a few of the more significant ones.
In 1991, Mark Snyderman published the report “Commercial Mortgages: Default Occurrence and Estimated Yield Impact.” This report used data from the American Council of Life Insurance Companies and is widely considered to be one the first comprehensive reports to rigorously analyze default risk in the commercial mortgage industry. The report focused on vintage risk (risk associated with when debt was issued) and the severity of loss in loans underwritten by insurance companies over a 12-year period. The paper concludes that defaults can cost 35 to 50 bps of yield over the lifetime of a portfolio and found that defaults generally peak in years two and three at roughly 1.6%, then fall back to approximately 1% per year thereafter.
Snyderman and Howard Esaki updated and expanded this report eight years later in 1999 with their study, “Commercial Mortgage Defaults: An Update.” Esaki and Goldman published an additional update in 2005 with the study “Commercial Mortgage Defaults: 30 years of History.” These updates included loan information from more than twice as many loans as the original study and analyzed loan performance through the real estate downturn of the early 1990s.
One key finding from the update was that loss severity from liquidated loans, or loans that were eventually sold at a loss to other investors, decreased by roughly 300 bps, or from 36% to 33%. The updates also found that default rates continue to rise through year seven, in contrast to the year-three peak found in Snyderman’s original study.
In 2005, Moody’s, using MIM mortgage data, completed the study “U.S. CMBS: Case Study of Leverage and Default Risk Over a Full Real Estate Cycle.” This report quantitatively considered vintage risk in relationship to the business cycle. Specifically, it found that over 30% of high LTV loans3 from the worst vintages had credit events, or some form of default associated with them, versus 11% of average LTV loans from the same vintage.
The MetLife Investment Management and CMBS Datasets4
MIM has been lending in commercial real estate for more than 75 years and thus has an established history on loan performance over time and through economic cycles. Moreover, combining the MIM data with more recently available CMBS data creates a comprehensive pool of information from which to analyze loan-loss rates. Lenders incur these losses in a variety of ways, but most commonly via accepting a discounted payoff for the loan, foreclosing on the property, or selling the loan at a loss to a third party. MIM believes that loss rates are one of the most important measures of commercial mortgage-loan performance, particularly for institutional lenders which typically have hold-to-maturity strategies.
Historical loss rates can vary by lender for several reasons. The two most significant reasons are the nature of economic downturn and differences in lenders’ risk tolerance levels.
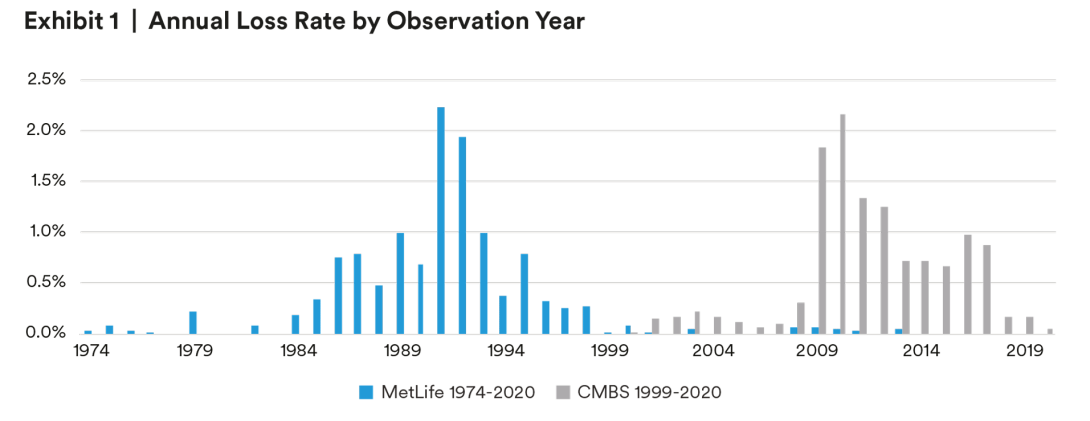
For example, prior to the formation of the CMBS market, MIM’s commercial mortgage portfolio5 experienced elevated losses during the late 1980s and early 1990s downturns, as Exhibit 1 illustrates. However, performance improved during the subsequent downturns of the early 2000s and 2007-2008. MIM’s improved performance was primarily due to our commercial mortgage platform pursuing more lower-leverage loans following the early 1990s recession. Additionally, some portion of the losses can be attributed to the nature of the different recessions, which we will discuss in the next section.
Loan Performance and the Nature of Recessions
There are two types of risk measures that investment managers generally focus on when underwriting loans. The first is debt-service risk, which is the risk of the property income being insufficient to cover mortgage payments. The second is maturity risk, which is the risk of the borrower being unable to refinance or pay off the loan when the final payment is due (maturity). We believe these two risks take on differing importance depending on the economic environment.
Examples of each of these two types of risk can be observed in recent economic downturns. During the early 1990s, property values declined along with the number of savings & loan banks offering commercial real estate loans. This made refinancing a challenge. Similarly, during the Global Financial Crisis of 2007/2008, property values also declined more than property incomes. Therefore, in both scenarios, the inability to refinance a loan at maturity (maturity risk) was a greater driver of defaults than was the ability to service the debt (i.e., cover the mortgage payments). Conversely, during the downturn of the early 2000s (Tech Bubble), values were stable, but property incomes declined. This created higher debt-service risk as more borrowers found it difficult to cover their mortgage payments due to lower property incomes.
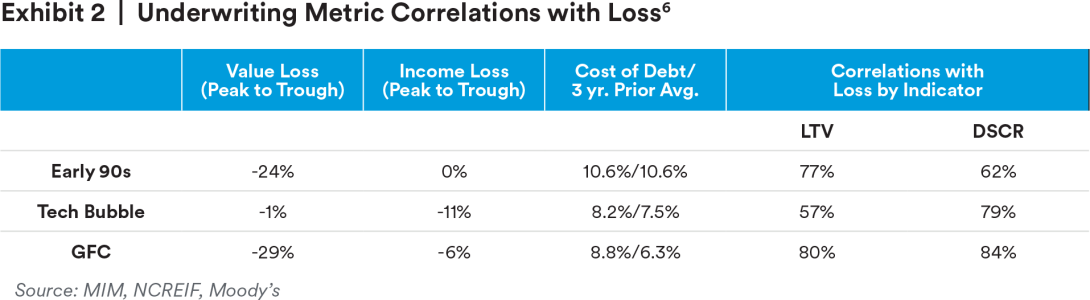
Exhibit 2 provides historical context, which helps to illustrate the difference between the two risk profiles. During the slowdowns of the early 1990s and 2007/2008, loss rates were more correlated with LTVs (relative to the early 2000s). Specifically, loans with a higher initial LTV (properties that had a larger amount of debt placed on them), had a higher probability of defaulting during these two downturns. This was because loans that were maturing during these periods were a challenge to refinance as the value of the underlying assets had materially declined.
More specifically, when the value of the denominator ( the “V” in “LTV”) falls, the overall LTV ratio rises. For example, a maturing 60% LTV loan ($60M) on an asset originally valued at $100M would require a refinance at an 80% LTV, if the asset value declined by 25%,to $75M (.8*$75M=$60M). Typically, 80% or higher LTV loans are more challenging to find, and thus, in this example, the risk of not being able to refinance (maturity risk) the loan would be high.
In contrast, the early 2000s downturn caused by the tech bubble saw property incomes decline, but property value losses were minimal. As a result, the correlation of LTVs to losses during this period was lower than in other recessions. So, if our example loan from above was maturing, the risk of not being able to refinance because values declined would be low, but the risk of being unable to continue to make payments on the loan (debt-service risk) should be higher. This is because property incomes declined during the tech recession more so than in other recessions.
The correlation of DSCR to losses was also high during the GFC of 2007/2008, suggesting that both debt-service coverage (ability to make payments) and LTV (amount of debt placed against the property and the ability to refinance) were important factors during this recession. This is partially due to increases in the interest rates available to borrowers during this period.
In summary, economic history suggests that appropriate risk management requires being mindful of both the debt-service risk and maturity risk that a downturn can expose.
Managing Risk with Common Underwriting Metrics7
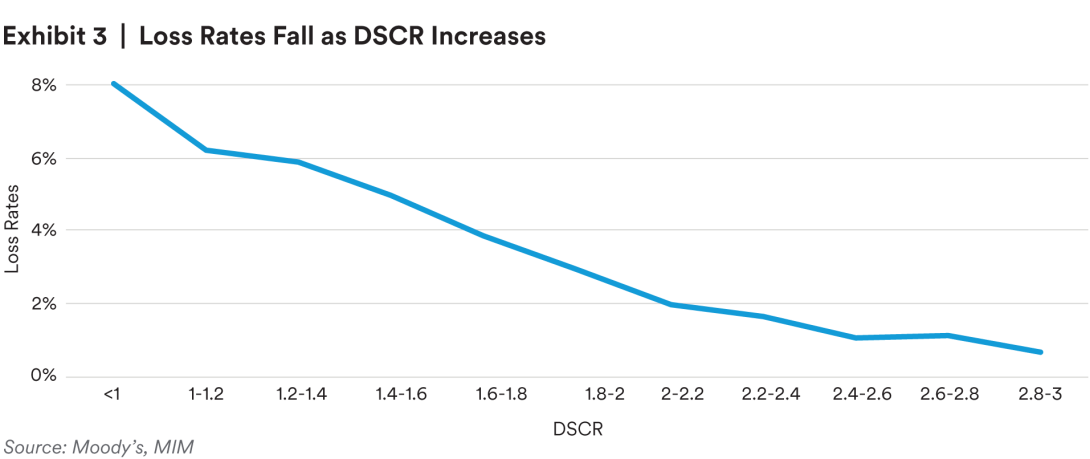
When used appropriately, operating income and market-value-based underwriting metrics have been reliable tools for underwriting risk in commercial mortgages. In Exhibit 3, we show longterm loss rates by DSCR at the time of origination. The chart shows that historically, loss rates generally declined as DSCRs increased. This relationship can be simplified as: properties with higher operating incomes to cover debt-service payments generally pose less of a risk to lenders. In general, the chart above illustrates that significant declines in loss rates occur as underwritten debt-service coverage increases above 1.6x in the dataset we studied.
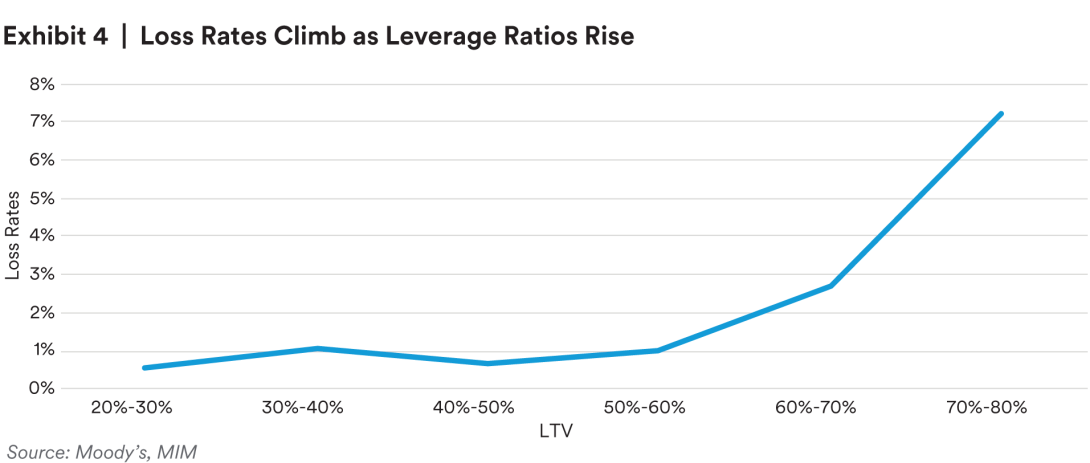
Similarly, as Exhibit 4 shows, as transaction loan-to-value ratios increased, loss rates also rose in the pool of loans we examined. This relationship can be simplified as: properties with higher levels of debt relative to their value pose a greater risk to lenders. The exhibit below suggests that loss rates can increase materially as LTVs move above 70%.
In contrast to LTV and DSCR, debt yield measures the available net operating income of a property relative to the size of the first-lien debt and implies what yield a debt holder might expect in the case of a foreclosure and assumption of property ownership.
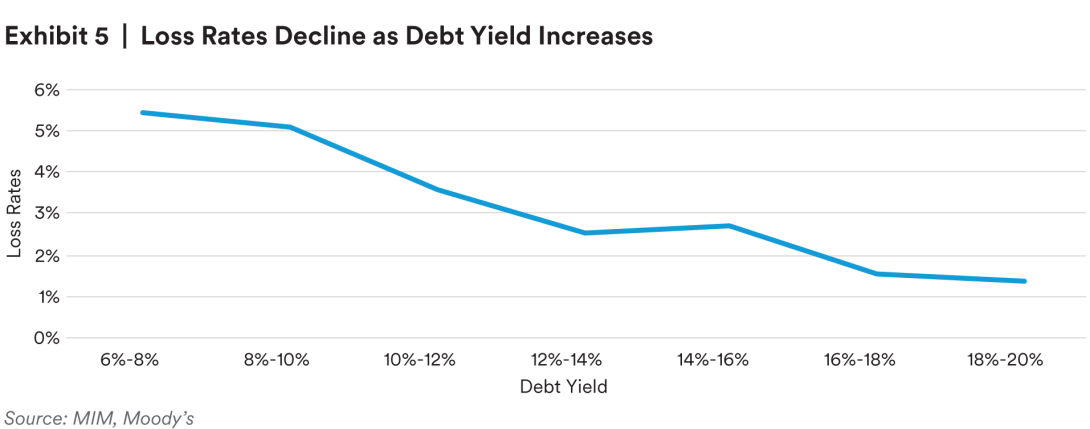
In general, this measure appears to offer a similar level of guidance in managing risk as LTV and DSCR. As Exhibit 5 indicates, portfolios underwritten with lower debt yields generally tend to exhibit higher loss rates than those underwritten with higher debt yields.
DSCR and Debt Yield as Risk Management Metrics8
Lenders typically use DSCRs to estimate a borrower’s ability to repay a loan. However, a DSCR can be challenging to interpret as longer payback periods or lower interest rates can produce higher DSCRs that are not truly indicative of lower risk to the lender if there is a market downturn and/or a foreclosure.
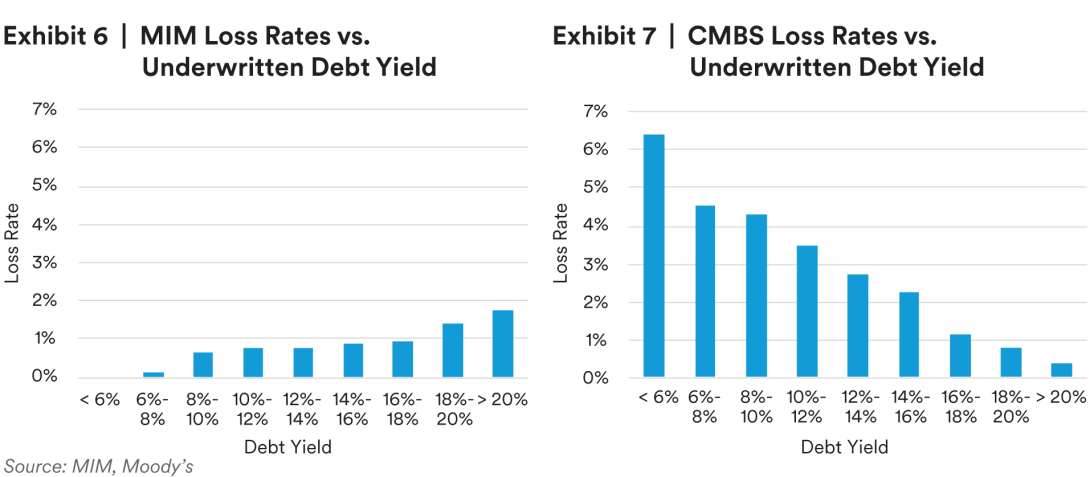
Debt yield can be a more meaningful measure than DSCR of property performance since debtservice coverage can appear deceptively strong in a low interest-rate environment. Debt yield typically offers a lender a more standardized view of risk as it indicates potential returns if the borrower can no longer stay in possession of the property. However, MIM’s experience with this metric has been the opposite of the larger CMBS history.
Debt Yield May Be an Incomplete Measure of Risk
Exhibit 7 indicates that, historically, CMBS loans have had lower loss rates for those loans with higher debt yields. Counterintuitively, MIM’s specific experience with losses relative to debt yield has been the opposite of the CMBS dataset (Exhibit 6). Put into context, CMBS data is implying that high debt yields are an indicator of lower risk for commercial mortgages; however, MIM’s experience would imply that the inverse is true.
The disparity is explained by the fact that MIM simply underwrote more high LTV loans during the late 1980s, a period when cap rates and debt yields were also higher. And higher LTV loans tend to carry more risk and produce more losses.
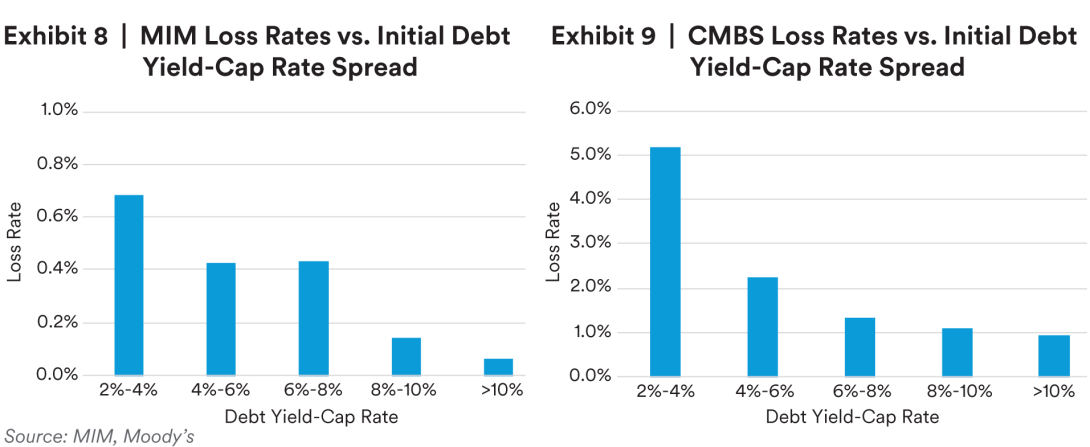
However, our findings also suggest that loans with smaller differences between debt yields and capitalization rates, or the value investors are willing to pay for a dollar of real estate income, show higher loss rates in both the MIM and CMBS histories. The similarity in pattern of losses between MIM and the larger CMBS dataset using this variation suggests that debt yield relative to cap rates may be more predictive of losses across a range of economic environments and lender-risk profiles than debt yield alone (Exhibits 8 & 9).
In summary, we believe debt yield as a risk-management metric can offer a unique and effective measurement of the risk associated with a loan. However, our historical analysis suggests that debt yields relative to the existing cap-rate environment may offer additional insight on the effectiveness of debt yield as an underwriting metric.
Managing Risk Relative to Position in Economic Cycle (Vintage Risk Magnifies Asset Risk)9
Whereas the paper completed in 2005 examined the impact of LTV metrics throughout the economic cycle, we have expanded the analysis to include the performance of DSCRs and debt yield as well. We also measured how these metrics performed at the end of the economic cycle, when GDP growth is typically slowing down.
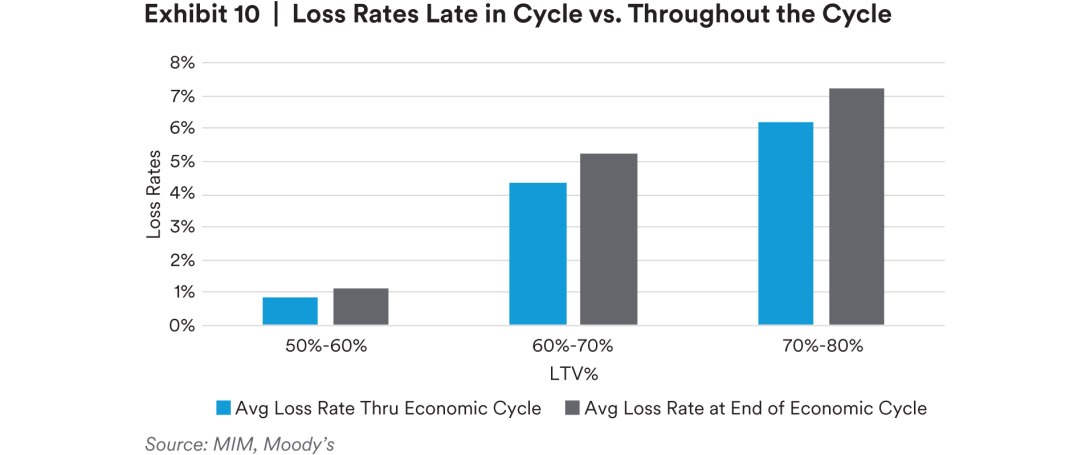
Exhibit 10 suggests that losses for properties with lower leverage ratios have loss levels that are similar, regardless of where the vintage fell within the cycle. However, loans underwritten late in the cycle that had higher leverage ratios10, had greater loss rates than high leverage loans underwritten at any other point in the economic cycle.
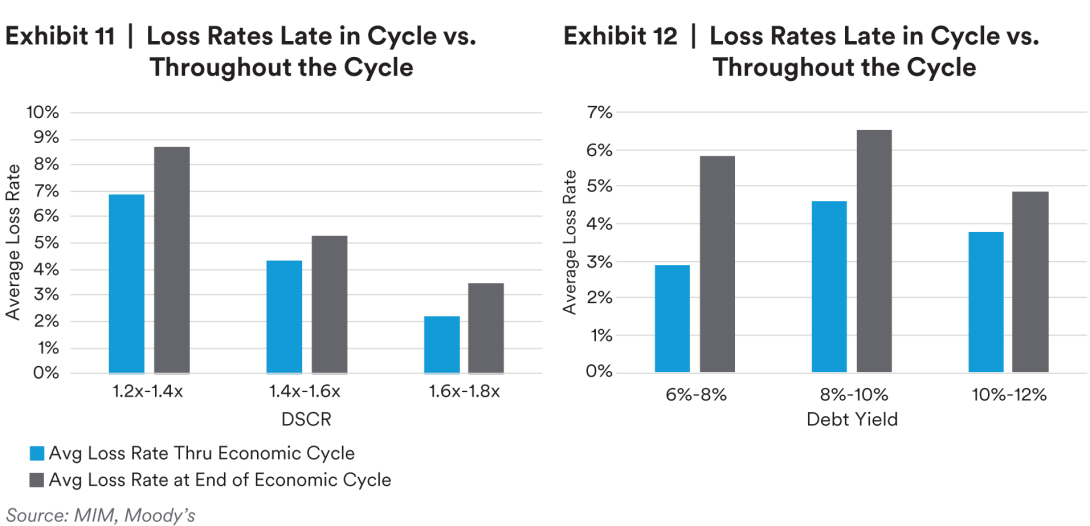
This holds true for both debt-service coverage ratios and debt yield as well. Exhibits 11 & 12 demonstrate that for both measures, incremental decreases in both DSCR and debt yield at initial underwriting can result in materially larger loss rates for transactions done near the end of an economic cycle, versus the entire cycle.
Managing Risk with Common Economic Cycle Indicators11
To further test our findings regarding underwriting late in the cycle, we designed a simple hypothetical back test with three scenarios.12
- First, a baseline is calculated using the unadjusted, late-cycle loss rates of all loans.
- Second, we simulate only investing in loans with LTVs of less than 70%13 when a common business cycle index (Moody’s) indicated extended weakening in the economy.
- Third, we simulate underwriting no high LTV loans when CRE values14 were at a five-year high.
- Lastly, we simulate underwriting no high LTV loans at all, regardless of economic conditions.15
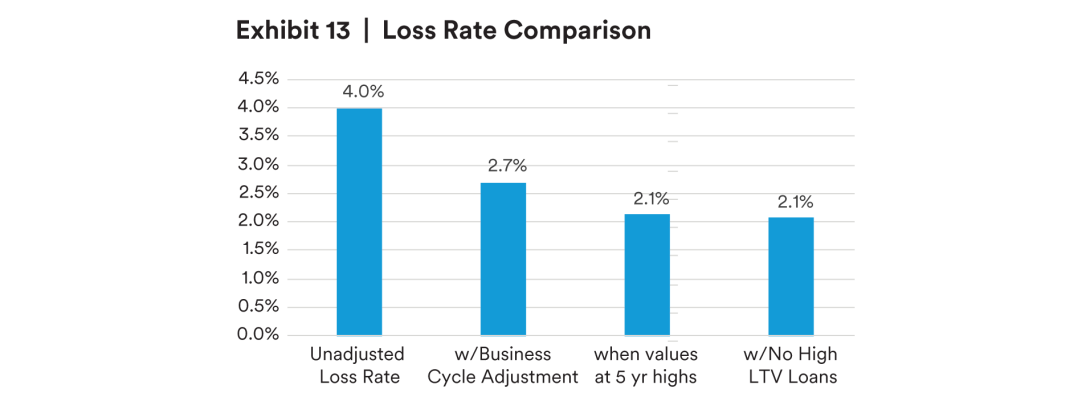
Not surprisingly, our tests showed that simply not underwriting any high LTV loans at all would have lowered loss rates (Exhibit 13). This can be understood as simply lowering tolerance for risk decreases expected losses. However, the back test also showed that underwriting lower LTV loans exclusively when a business cycle index showed weakening in the economy, or when property values were high relative to recent history, could produce a similar reduction in loss rate. Notably, not underwriting high-leverage loans when values are high produces almost identical loss rates as underwriting no high-leverage loans at all, with possibly less reduction of total loan volume. In other words, limiting higher-risk loans late in an economic cycle can reduce loss rates. And it is possible to gauge how late we are in the cycle, at least for underwriting purposes, from commonly available indices and pricing metrics.
Our goal with this hypothetical back test isn’t to suggest alternate underwriting procedures but rather to show further confirmation that positioning in the economic cycle can be a significant factor in managing risk within higher LTV pools of loans, more so than in lower LTV pools.
Finally, the historical loan performance also shows that while higher-leverage loans tend to carry higher compensation to lenders for assuming the additional risk, the compensation level is not equal at all points in the cycle. During prior periods, the risk premium has tended to be widest during an economic recovery and tightest as the length of the economic expansion increases. According to our analysis of historical mortgage spreads, similar-risk loans underwritten early in an economic cycle have averaged a 1.5x higher spread-to-Treasury as compared to loans underwritten later in the economic expansion cycle16. This suggests that both the risk and the value proposition for underwriting higher-leverage loans diminishes as an economic cycle matures.
Conclusion
Understanding the historical performance of common loss metrics can offer additional guidance in managing risk in commercial mortgage portfolios. We also conclude that debt yield is generally useful as an underwriting metric, but it requires the context of the cap-rate environment to be effective in mitigating losses across all market environments and lender-risk profiles.17
Lastly, like previous studies, we found that the position in the economic cycle when a loan is underwritten is significant, but that significance is largely concentrated in loans with higher leverage. The analysis shows, not surprisingly, that loss rates from higher-leverage loans can increase substantially if underwritten late in an economic cycle. In contrast, loans with more conservative leverage ratios appear to present similar levels of risk no matter when in the cycle they are underwritten.
Endnotes
1 Managing the Crisis: The FDICand RTC Experience
2 Preqin Database, YE 2021.
3 “High LTV” is generally defined as in the 70%-80% LTV range
4 CMBS data includes primarily conduit and fusion loans for all commercial property types, as compiled by Moody’s.
5 The MetLife Investment Management Commercial Mortgage portfolio history is comprised of loans originated from 1957-2021. In the early decades these loans were primarily originated for MetLife Insurance Company, but in recent decades are comprised of a greater concentration of loans originated for other investors.
6 Lifetime loss by year underwritten, or vintage. Value and income losses based on NCREIF data.
7 Exhibits 3 and 4 are based on the combined losses from the 1974-2021 MIM series and 1998-2020 CMBS series. Losses are depicted as an average annual rate.
8 Exhibits 6 and 7 are based on the combined losses from the 1974-2021 MIM series and 1998-2020 CMBS series. Losses are depicted as an average annual rate.
9 Exhibits 8 and 9 are based on the combined losses from the 1974-2021 MIM series and 1998-2020 CMBS series. Losses are depicted as an average annual rate.
10 For this paper, we define “end of cycle” as the three-year period leading up to a recession.
11 Exhibits 11 and 12 are based on the combined losses of 1974-2020 MIM series and 1998-2020 CMBS series. Losses are depicted as an average annual rate.
12 The back-test in exhibit 13 is based on losses on loans held by The MetLife Investment Management Commercial Mortgage portfolio over the time-period spanning from 1983 through 2017. This time-period was chosen to capture data from the beginning of the economic cycle that led into the recession of the early 1990’s thru the peak commercial real estate pricing levels achieved during the recovery from the GFC. Overall, losses from loans originated during this period totaled a cumulative 4%, or an average of .12% per year.
13 This scenario excludes loans underwritten when the Moody’s Business Cycle Index (BCI) indicated an overly extended growth phase of the business cycle. This indicator resulted in higher LTV loans exclusions in the years 1998 thru 1990, 1997 thru 2000, and 2007 thru 2008. Losses from loans originated during this period, excluding these loans, were roughly 2.7% cumulatively or 8 bps per year on average.
14 Values calculated using NCREIF -NPI Indices
15 In this case we define high LTV loans as those with 70%- 80% LTVs.
16 American Council of Life Insurers data 2002- 2018 17 DY/Cap Rate is the inverse of LTV. We believe DY minus Cap Rate, however, captures economic and capital market factors in a way that DY, DSCR and LTV do not.
Read more from MetLife
Disclaimer
This material is intended solely for Institutional Investors, Qualified Investors and Professional Investors. This analysis is not intended for distribution with Retail Investors. This document has been prepared by MetLife Investment Management (“MIM”) solely for informational purposes and does not constitute a recommendation regarding any investments or the provision of any investment advice, or constitute or form part of any advertisement of, offer for sale or subscription of, solicitation or invitation of any offer or recommendation to purchase or subscribe for any securities or investment advisory services. The views expressed herein are solely those of MIM and do not necessarily reflect, nor are they necessarily consistent with, the views held by, or the forecasts utilized by, the entities within the MetLife enterprise that provide insurance products, annuities and employee benefit programs. The information and opinions presented or contained in this document are provided as of the date it was written. It should be understood that subsequent developments may materially affect the information contained in this document, which none of MIM, its affiliates, advisors or representatives are under an obligation to update, revise or affirm. It is not MIM’s intention to provide, and you may not rely on this document as providing, a recommendation with respect to any particular investment strategy or investment. Affiliates of MIM may perform services for, solicit business from, hold long or short positions in, or otherwise be interested in the investments (including derivatives) of any company mentioned herein. This document may contain forward-looking statements, as well as predictions, projections and forecasts of the economy or economic trends of the markets, which are not necessarily indicative of the future. Any or all forward-looking statements, as well as those included in any other material discussed at the presentation, may turn out to be wrong. All investments involve risks including the potential for loss of principle and past performance does not guarantee similar future results. In the U.S. this document is communicated by MetLife Investment Management, LLC (MIM, LLC), a U.S. Securities Exchange Commission registered investment adviser. MIM, LLC is a subsidiary of MetLife, Inc. and part of MetLife Investment Management. Registration with the SEC does not imply a certain level of skill or that the SEC has endorsed the investment advisor. This document is being distributed by MetLife Investment Management Limited (“MIML”), authorised and regulated by the UK Financial Conduct Authority (FCA reference number 623761), registered address 1 Angel Lane, 8th Floor, London, EC4R 3AB, United Kingdom. This document is approved by MIML as a financial promotion for distribution in the UK. This document is only intended for, and may only be distributed to, investors in the UK and EEA who qualify as a “professional client” as defined under the Markets in Financial Instruments Directive (2014/65/EU), as implemented in the relevant EEA jurisdiction, and the retained EU law version of the same in the UK. MIMEL: For investors in the EEA, this document is being distributed by MetLife Investment Management Europe Limited (“MIMEL”), authorised and regulated by the Central Bank of Ireland (registered number: C451684), registered address 20 on Hatch, Lower Hatch Street, Dublin 2, Ireland. This document is approved by MIMEL as marketing communications for the purposes of the EU Directive 2014/65/EU on markets in financial instruments (“MiFID II”). Where MIMEL does not have an applicable cross-border licence, this document is only intended for, and may only be distributed on request to, investors in the EEA who qualify as a “professional client” as defined under MiFID II, as implemented in the relevant EEA jurisdiction. For investors in the Middle East: This document is directed at and intended for institutional investors (as such term is defined in the various jurisdictions) only. The recipient of this document acknowledges that (1) no regulator or governmental authority in the Gulf Cooperation Council (“GCC”) or the Middle East has reviewed or approved this document or the substance contained within it, (2) this document is not for general circulation in the GCC or the Middle East and is provided on a confidential basis to the addressee only, (3) MetLife Investment Management is not licensed or regulated by any regulatory or governmental authority in the Middle East or the GCC, and (4) this document does not constitute or form part of any investment advice or solicitation of investment products in the GCC or Middle East or in any jurisdiction in which the provision of investment advice or any solicitation would be unlawful under the securities laws of such jurisdiction (and this document is therefore not construed as such). For investors in Japan: This document is being distributed by MetLife Asset Management Corp. (Japan) (“MAM”), 1-3 Kioicho, Chiyoda-ku, Tokyo 102- 0094, Tokyo Garden Terrace KioiCho Kioi Tower 25F, a registered Financial Instruments Business Operator (“FIBO”) under the registration entry Director General of the Kanto Local Finance Bureau (FIBO) No. 2414. For Investors in Hong Kong S.A.R.: This document is being issued by MetLife Investments Asia Limited (“MIAL”), a part of MIM, and it has not been reviewed by the Securities and Futures Commission of Hong Kong (“SFC”). MIAL is licensed by the Securities and Futures Commission for Type 1 (dealing in securities), Type 4 (advising on securities) and Type 9 (asset management) regulated activities. For investors in Australia: This information is distributed by MIM LLC and is intended for “wholesale clients” as defined in section 761G of the Corporations Act 2001 (Cth) (the Act). MIM LLC exempt from the requirement to hold an Australian financial services license under the Act in respect of the financial services it provides to Australian clients. MIM LLC is regulated by the SEC under US law, which is different from Australian law. 1 MetLife Investment Management (“MIM”) is MetLife, Inc.’s institutional management business and the marketing name for subsidiaries of MetLife that provide investment management services to MetLife’s general account, separate accounts and/or unaffiliated/third party investors, including: Metropolitan Life Insurance Company, MetLife Investment Management, LLC, MetLife Investment Management Limited, MetLife Investments Limited, MetLife Investments Asia Limited, MetLife Latin America Asesorias e Inversiones Limitada, MetLife Asset Management Corp. (Japan), and MIM I LLC and MetLife Investment Management Europe Limited.