Key Takeaways
- We believe emerging market (EM) corporate debt can offer insurers an attractive opportunity set based on risk, return and diversification.
- The combination of ratings and yield potential are prompting some insurers to consider adding EM corporate debt to their portfolios.
- Loomis Sayles can work with insurers to help create an appropriate EM corporate debt allocation based on their portfolio requirements.
Are insurers missing an opportunity when it comes to their limited allocation to emerging market corporate debt? We think so.
Comparing the top 50 insurers in each of the categories of life, property & casualty (P&C) and health, the largest average allocation to EM credit was 2.9% of bonds held at the end of 2021. That included exposure to EM sovereigns.1
Opportunity
We believe broadening a core allocation to include EM corporates (augmented by sovereigns when deemed appropriate) may make sense for insurers challenged with investing capital.It can help insurance portfolios achieve:
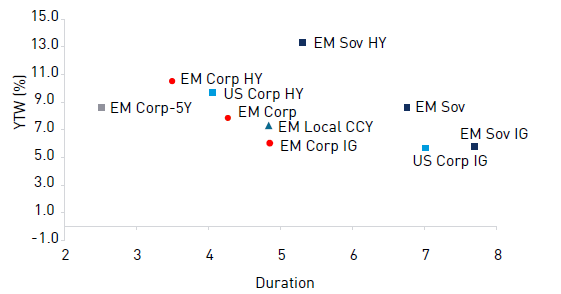
1. a meaningful pickup in yield for a given rating and duration (see Figure 1),
2. diversification of issuer-specific and sector risk and
3. favorable total-return opportunities relative to other US fixed income sectors over a market cycle.
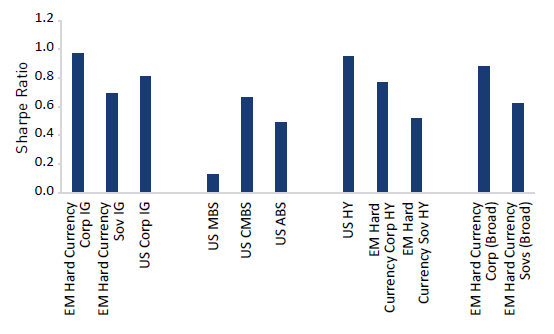
The qualities listed above help distinguish EM corporate debt from other asset classes in terms of risk and return. As Figure 2 demonstrates, over the long term, EM corporate debt has generated a historically favorable Sharpe Ratio when compared to other investment options.
Figure 1 - Yield Versus Duration
as of 30 September 2022
Sources: Loomis Sayles, J.P. Morgan, Barclays, Merrill Lynch, and Bloomberg LP. Data as of 30 September 2022. See Endnotes for indices used. Indices are unmanaged and do not incur fees. It is not possible to invest directly in an index. This marketing communication is provided for informational purposes only and does not represent the actual or expected future performance of any investment product
Past market experience is no guarantee of future results.
Figure 2 - Risk-Adjusted Returns
Sources: J.P. Morgan, ICE BofA. Based on weekly returns annualized 31 December 2011 to 31 December 2021. See Endnotes for index names.
Past market experience is no guarantee of future results.
Growing Opportunity Set
As long-time investors in EM corporate debt, we have seen the sector evolve and grow. Industrialization, urbanization and an expanding middle class have fueled EM growth over the years. Not surprisingly, an increased corporate presence in the emerging world has accompanied this economic transformation and expanded the investment universe. In addition to regional and niche players, emerging markets are home to many strong global enterprises, some of which are world leaders in their respective industries. One result has been more investment choices for investors.
Ratings Process Can Contribute to Inefficiencies
In our view, rating agencies heavily weight a company’s scale and track record when it comes to assigning credit ratings to a debut issuer. Our internal analysis places greater emphasis on issuers’ underlying fundamentals and future growth prospects. Also, an EM corporate debt rating can be limited to that of its country’s rating. Both instances can create market inefficiencies. In our experience, fundamental research can help identify these opportunities of mispriced credit risk. This analysis can also uncover improving credit stories within the EM corporate universe and opportunities to extract the risk premium or alpha.
Taking a broader market view, in comparison to its developed market (DM) counterparts, we believe EM corporate bond issuers tend to focus more on achieving an investment grade (IG) rating. Also, we have seen some EM corporates raising debt for productive purposes versus for financial engineering.
Advantages of EM Corporate Debt Characteristics
In our view, EM corporate bonds can offer insurers a strong value proposition within the EM debt universe. Given the idiosyncratic risks and characteristics of EM corporate bonds, we believe fundamental investors have an opportunity to pinpoint potential sources of uncorrelated alpha and excess return.
Risk Premiums
For example, a characteristic of EM corporate debt is the overcompensation, or risk premiums, investors receive relative to default risk. In such an environment, comprehensive analysis and research has the potential to identify mispriced securities, event-driven opportunities and market trends. This characteristic may contribute to the significantly higher weighting of corporates versus sovereigns within the EM bond holdings of the top 50 insurers in the life (79.4% vs. 20.6%, respectively), P&C (86.4% vs. 13.6%) and health (83.3% vs. 16.7%) categories.2
Solid Fundamentals
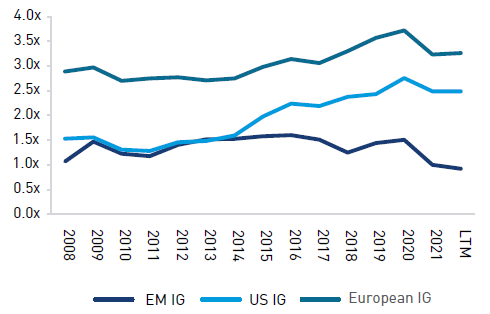
The burgeoning EM corporate debt universe retains a broad reputation as a high yield (HY) debt substitute. We do not think this characterization is accurate. The EM corporate opportunity set is skewed toward IG. EM corporates have been, on average, less leveraged than US corporates across the credit spectrum.
Net Leverage Comparison EM IG VS. DM IG
Net Leverage Comparison EM HY VS. DM HY

Sources for right and left chart: J.P. Morgan, Bloomberg, CapitalIQ.
As of September 2022 (most recent data available).
Reflections on Expanding the Opportunity Set
From a default perspective, EM HY corporates have demonstrated an average historical level comparable with US HY. In fact, during select periods of severe market stress, including the global financial crisis in 2008 and the emergence of COVID in 2020, EM HY corporates outperformed US HY.
In the year ending 31 December 2022, EM HY corporates underperformed US HY as pockets of extreme pressure linked to the Russia/Ukraine war and distress in the Chinese property sector drove elevated levels. Importantly, defaults have not been broad based. Excluding these discrete pockets, the EM HY default rate stood at a benign 1.2% year-to-date through 30 September 2022, versus 1.5% for US HY.
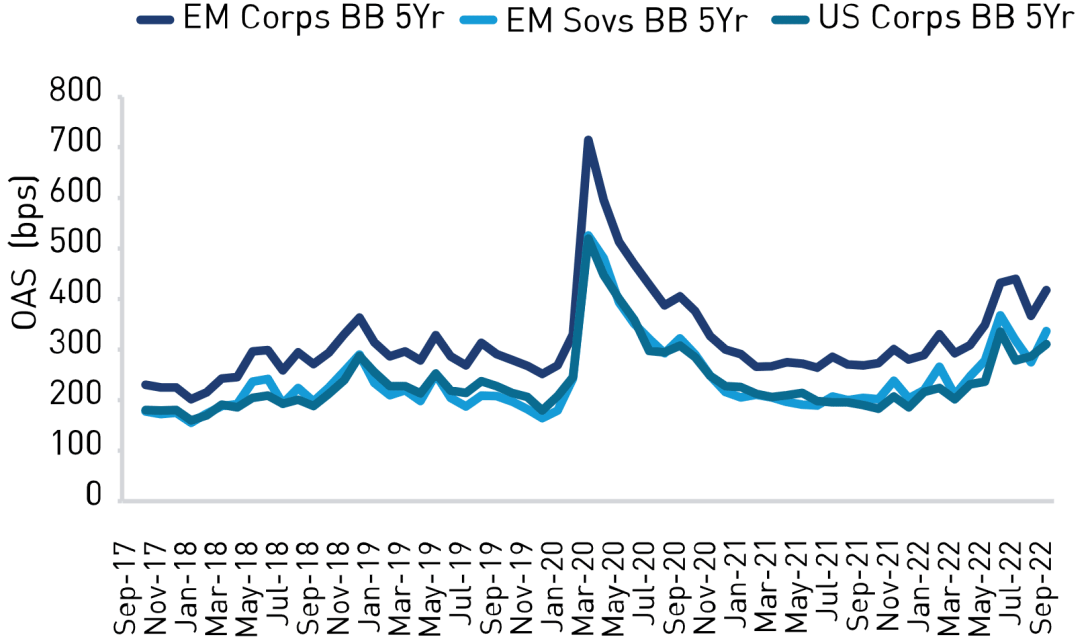
In our opinion, EM corporate valuations do not reflect these advantages. On a matched-ratings basis, EM corporates have offered a consistent spread premium to their EM sovereign and DM corporate counterparts.
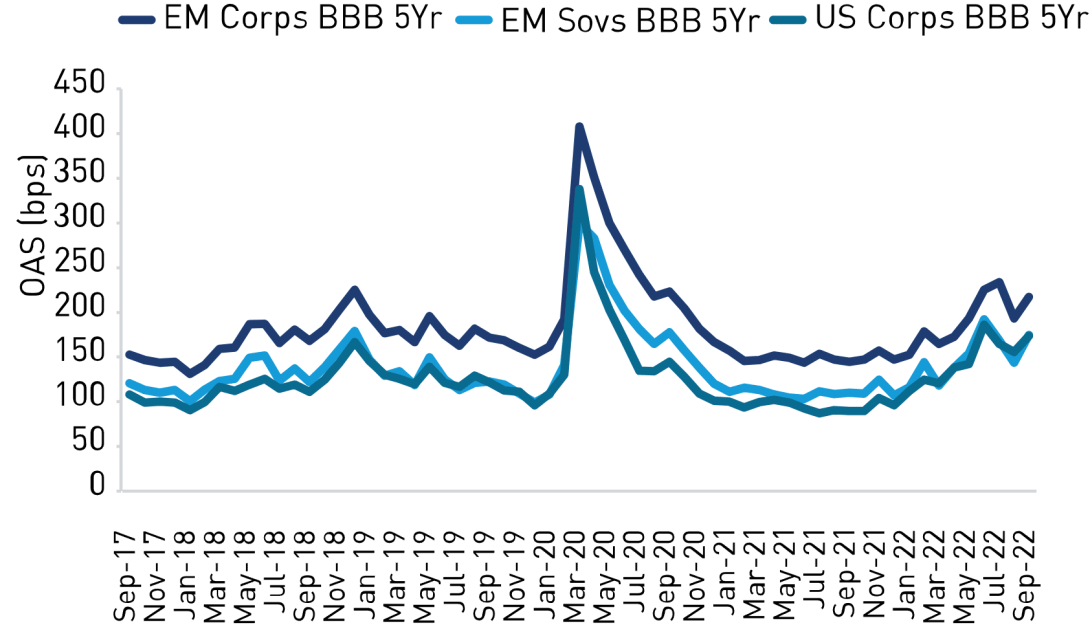
Spread Comparison 5-YR BB
Spread Comparison 5-YR BBB
Sources for right and left chart: Loomis Sayles, as of 30 September 2022. Indices are unmanaged and do not incur fees. It is not possible to invest directly into an index. Indices do not represent the actual or expected future performance of any investment product.
Past market experience is no guarantee of future results.
Research Matters
The additional yield potential in the EM corporate sector can be considered compensation for factors such as liquidity risk and the incremental effort required to appropriately analyze issuers across a universe of 60 plus countries. The importance of fundamental credit research cannot be overstated. We think insurance investors should look for EM companies with strong market positions and solid cash flow, the same qualities they would seek in DM corporates, while incorporating solid research on the breadth of variables in the emerging markets, including sovereign risk, accounting transparency differences, sovereign and family ownership, sector structure and evolution, among other factors.
Role of Soverigns
We see opportunistic roles for sovereigns in insurance mandates. Sovereigns typically offer longer durations than those of EM corporate debt. For example, life insurers appear to be allocating to EM long corporates and sovereigns in their asset liability management in lieu of long US corporates.
We have recently seen opportunities to add diversification and duration extension with EM sovereigns in 30- and even 40-year tenors. We also consider investments in sovereigns when there is a favorable view on a country but a limited corporate bond opportunity.
Core or Non-Core- Is It Just Semantics?
Avoid letting terminology limit your investment approach. Instead, let liability requirements or duration objectives prescribe what a core allocation should encompass. With these factors identified, an asset manager can help determine appropriate maturities, ratings and concentration limits.
At the end of 2021, EM corporate and sovereign holdings of the top 50 life, P&C and health insurers were skewed to IG. The overall rating of insurance EM bond holdings was BBB (P&C) and BBB+ (Life and Health). EM corporates across IG and HY can offer a yield premium to their comparably rated DM counterparts. In our view, insurers should not focus on EM corporate exposure as just a substitute for US HY corporates, but rather as part of their IG portfolios.
We collaborate with insurance companies to help identify custom EM corporate debt investment universes with the potential to generate the yield and return to meet the insurer’s core allocation objectives.
Implications: EM Corporate Debt and Insurance Regulatory Requirements
While insurers globally invest in EM, there are distinct aspects of the US statutory regulatory system that typically limit insurers to hard-currency exposure through separate accounts. Our analysis showed the top 50 life, P&C and health insurers had negligible holdings in local-currency EM debt. We believe it’s critical at the outset for the insurer to establish their primary objectives for the mandate, and the resulting implications for the allocation.
| FEATURES | CONSIDERATIONS |
| Target size of allocation | Separate account vs. pooled vehicle structure. |
| Desire for local-currency exposure | Consider pooled vehicle structure to efficiently gain access to currency risk. |
| Target duration | Longer issuance available in sovereigns vs. corporates. |
| Book yield vs. total return orientation | Book-yield mandates will require careful consideration of longer-term fundamentals of a company to avoid potential future impairements. Greater ability to invest in smaller, less liquid issues. |
| “Core” holding vs. “Plus” | Limits on IG. Benchmarks offer varying levels of HY exposure. |
| Stand-alone allocation vs. part of a broader “Plus” mandate | Consider multi-asset credit mandate to invest across the spectrum of credit for insures seeking a broader exposure. |
Conclusion
The EM corporate asset class can offer an attractive risk and return opportunity set. For insurers needing to deploy capital and increase diversification, we believe EM corporate debt can be a strong option.
1 Source: S&P Global Market Intelligence / Bloomberg. As of 31 December 2021 (most recent data available). See Data Table 1 in Endnotes.
2 Source: S&P Global Market Intelligence / Bloomberg. As of 31 December 2021 (most recent data available). See Data Table 2 in Endnotes.
Download PDF
Authors
Elisabeth Colleran, CFA
Portfolio Manager, Emerging Market Debt

Erik Troutman, CFA, FSA, MAAA
Insurance Strategist, Co-Director, Institutional Advisory Group
Colin Dowdall, CFA
Director of Insurance Solutions
Endnotes
Yield versus Duration chart:
EM Sov HY = J.P. Morgan Emerging Markets Bond Index, EM Corp HY = J.P. Morgan Corporate Emerging Markets Bond Index (CEMBI) Broad Diversified High Yield, EM CORP IG = J.P. Morgan CEMBI Broad Diversified Investment Grade Index, EM Sov IG= J.P. Morgan EMBI Global Investment Grade Index, US HY = Bloomberg Barclays US High Yield Index, US IG = Bloomberg Barclays US Aggregate Corporates, EM Corp = J.P. Morgan Corporate Emerging Markets Bond Index (CEMBI Broad Diversified), EM CORP 1-5yr = 50% J.P. Morgan CEMBI Broad Diversified 1-3year Index, 50% J.P. Morgan CEMBI Broad Diversified 3-5year Index.Sharpe Ratio Chart:
| EM Hard Currency Corp IG | JP Morgan CEMBI Broad Diversified IG Index |
| EM Hard Currency Sovereign IG | JP Morgan EMBI Global Diversified IG Index |
| US Corporate | ICE BofA US Corporate Index |
| US MBS | ICE BofA US Mortgage Backed Securities Index |
| US CMBS | ICE BofA US Fixed Rate CMBS Index |
| US ABS | ICE BofA US Fixed Rate Asset Backed Securities Index |
| EM Hard Currency Corp HY | JP Morgan CEMBI Broad Diversified HY Index |
| EM Hard Currency Sovereign HY | JP Morgan EMBI Global Diversified HY Index |
US HY
EM Hard Currency Corp (Broad) | ICE BofA US High Yield Index
JP Morgan CEMBI Broad Diversified Index |
| EM Hard Currency Sovereign (Broad) | JP Morgan EMBI Global Diversified Index |
Table 1
| | Median | Average |
| % of Bonds | % of Bonds |
| EMD (corporates & sovereigns) (IG/HY) | EMD (corporates & sovereigns) (IG/HY) |
| Top 50 US Life Insurers | 2.7 | 2.9 |
| Top 50 US P&C Insurers | 0.6 | 1.2 |
| Top 50 US Health Insurers | 0.7 | 1.1 |
Source: S&P Global Market Intelligence /Bloomberg. As of 31 December 2021. Top 50 based on YE 2020 Total Assets. Table 2
| | Median % EM Debt Owned by Top 50 Insurers |
| Top 50 US Life Insurers | Top 50 US P&C Insurers | Top 50 US Health Insurers |
| EMD Sovereign (%) | 20.6 | 13.6 | 16.7 |
| EMD Corporates (%) | 79.4 | 86.4 | 83.3 |
Source: S&P Global Market Intelligence / Bloomberg, As of 31 December 2021. Top 50 based on YE 2021 Total Assets. Table 3
| | Median % EM Debt Owned by Top 50 Insurers |
| EMD Securities | US Life | US P&C | US Health |
| Investment Grade (NAIC 1/2) | 89.8 | 87.2 | 92.0 |
| High Yield (NAIC 3-6) | 10.2 | 12.8 | 8.0 |
| Overall Rating of EM Holdings | BBB+ | BBB | BBB+ |
Source: S&P Global Market Intelligence / Bloomberg. As of 31 December 2021. Top 50 based on YE 2021 Total Assets. NAIC: National Association of Insurance Commissioners.
Disclosure
This marketing communication is provided for informational purposes only and should not be construed as investment advice. Any opinions or forecasts contained herein reflect the subjective judgments and assumptions of the authors only, and do not necessarily reflect the views of Loomis, Sayles & Company, L.P. Investment recommendations may be inconsistent with these opinions. There is no assurance that developments will transpire as forecasted or that actual results will be different. Data and analysis does not represent the actual, or expected future performance of any investment product. Information, including that obtained from outside sources, is believed to be correct, but Loomis cannot guarantee its accuracy. This information is subject to change at any time without notice.
Diversification does not ensure a profit or guarantee against a loss.
Any investment that has the possibility for profits also has the possibility of losses, including loss of principal.
Indexes are unmanaged and do not incur fees. It is not possible to invest directly in an index.
Information obtained from outside sources is believed to be correct, but Loomis Sayles cannot guarantee its accuracy. This material cannot be copied, reproduced or redistributed without authorization.
LS Loomis | Sayles is a trademark of Loomis, Sayles & Company, L.P. registered in the US Patent and Trademark Office.
MALR030322