Once private equity investors sign a fund commitment, they begin a 10- to 15-year relationship with the GP. With time horizons this long, it’s no wonder the asset class attracts life insurers and pension funds; it’s also clear why many perceive private equity to be a waiting game. That shorter-term investors also invest in private equity, however, indicates the asset class is not as illiquid as the long fund life would suggest. To quantify the liquidity of these investments, we look at the duration of private equity cash flows and crunch the numbers from different angles using our proprietary data.
The Toolbox
The tool we use to get a handle on the liquidity of private equity investments is duration. Why do we need something in addition to the hold period? The timing of the last distribution can be very different from when, on average, distributions were paid. Some funds have small residual net asset value (NAV) distributed in year 15, but 99% of the distributions were paid out by year 9. Similarly, there can be a large difference between when contributions were paid, on average, and the close of the fund. A buyout fund typically has an investment period of five or six years. In vintages where deals are hard to come by in early years, most of the contributions may occur late in the investment period.For a concrete example, see Figure 1. In this hypothetical fund, most contributions are paid between years 1 and 4; most distributions happen between years 6 and 10. The fund life is 15 years, which tells you very little about when the action happened! Most of the cash flows occurred before year 10. Duration allows us to idealize the cash flows of a fund as an investment with two cash flows: one contribution, and one distribution. Duration comes in two flavors, based on available data:» Cash flow duration, requiring all contributions and distributions;
» Performance duration, requiring the internal rate of return (IRR) and the total value multiple (TVM).
We take a closer look at these measures next to see what they mean and when to use them.
CASH FLOW DURATION
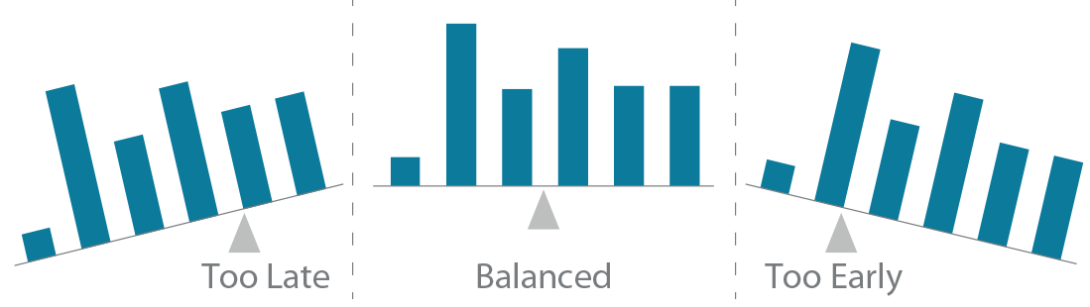
Cash flow duration is the difference between the average distribution time and the average contribution time. For example, given equal contributions of $1 million apiece at years 1, 2, and 3, respectively, the average contribution time is right in the middle—year 2. This is a center of mass: the contributions will “balance” exactly at the average contribution time. See Figure 2.
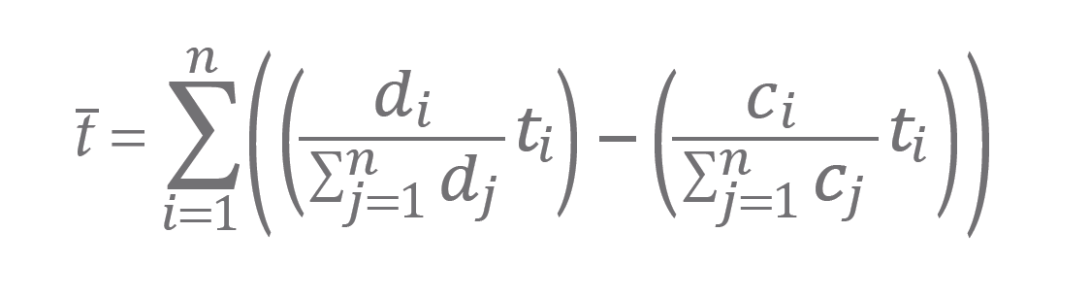
In general, given contributions c1, c2, … , cn (positive or zero) and distributions d1, d2, … , dn (positive or zero) at times t1, t2, … , tn (in years), the cash flow duration is
which is precisely the average distribution time less the average contribution time. See Figure 3 for an example of this calculation. For a liquidated fund with no distributions, there is no average distribution time. The last report date can be used as a substitute. On the fund level, it is rare for no money to be returned.
Cash flow duration idealizes the irregular cash flows of a fund as one contribution and one distribution. The contribution happens at the average contribution time. Its size is the sum of all contributions. The distribution happens at the average distribution time. Its size is the sum of all distributions. This flavor of duration measures the waiting time between these two averages. Now look back at Figure 1. The hold period was 15 years, but most cash flow activity happened between years 1 and 9. With average distributions at around seven years, and average contributions just shy of three years, the cash flow duration is 4.25 years. This gives a better summary of the wait between contributions and distributions.
Cash flow duration can also be computed using discounted cash flows—or present value.1 In this case, with equal contributions of $1 in years 1, 2, and 3, the average contribution time would not be year 2 but a bit less.2 For example, using 8% as the discount rate, the contribution values come to $1, $1(1.08)-1 ≈ 0.93, and $1(1.08)-2 ≈ 0.86. The average contribution time is 1.95 years. A natural discount rate would be the IRR. However, because the IRR emphasizes early cash flows when positive, and late cash flows when negative, for the purposes of this paper, we compute cash flow duration using raw, undiscounted cash flows.
FIGURE 1 | FUND CASH FLOWS
Source: StepStone, 2018.
For illustrative purposes only.
FIGURE 2 | AVERAGE TIME OF CASH FLOWS
Source: StepStone, 2018.
For illustrative purposes only.
FIGURE 3 | CASH FLOW DURATION

Source: StepStone, 2018.
For illustrative purposes only.
PERFORMANCE DURATION
Performance duration is useful when the TVM and IRR are available but the underlying cash flows are not. This second flavor of duration answers the following question: How long would an initial investment of $1—compounded at the IRR—need in order to achieve the realized TVM?3 In other words, given the investment IRR and TVM, find t̂ such that
As with cash flow duration, this simplifies the many cash flows of a fund down to one initial contribution and one distribution after t̂ years have elapsed. See Figure 4.
The direct formula for performance duration, t̂, is
where log( ) refers to the natural logarithm. For two different investments with the same IRR, the one with the higher TVM will have the higher performance duration. This is intuitive, as an initial investment of $1 will have to compound at the IRR longer to get to a higher payout. Similarly, for two investments
with the same TVM, the one with the smaller IRR will have a higher performance duration. Compounding $1 at a smaller rate will require more time to get to the same final payout.
When no capital is returned on the investment (TVM=0 and IRR=-1), then performance duration can’t be calculated as above. In this case, the time until write-off may be a good proxy. Now look back at Figure 1. For these cash flows, the TVM is 1.7x. The IRR is 13%. That leaves a performance duration of 4.25 years. While the hold period of 15 years didn’t give us a feeling for the timing of the underlying cash flows, both definitions of duration tell us that on average, our money came back with growth after 4.25 years.
FIGURE 4 | PERFORMANCE DURATION
Source: StepStone, 2018.
For illustrative purposes only.
COMPARISON
For an investment with one contribution and one distribution, these two measures coincide. For a fund investment with contributions and distributions spread over time, however, there will be differences. To get a feeling for these two notions of duration, we computed both measures for a subset of buyout funds. Starting with 1,081 unique buyout funds, we drilled down to a subset of 332 USD-denominated buyout funds between vintages 1985 and 2007.4 Funds in these vintages are liquidated or closer to liquidation than later vintages.
Still, we include unrealized investments in the IRR and TVM where applicable. For a fair comparison, we also added the unrealized to the distributions when computing the cash flow duration.
To compare across funds, we use a single currency. To fairly evaluate the duration of a manager, we use fund currency. Under these constraints, we get the largest sample by selecting USD-denominated funds.
The average difference between cash flow duration and performance duration was 0.22 years. This means cash flow duration tends to be a little higher on average, but similar. On a stand-alone basis, there were a few outliers where the difference was one to two years. See Figure 5 (bottom). With results this similar, either measure can be used for larger sample sizes. However, when looking at one or two funds, the choice can matter. For single funds, we like to use cash flow duration, because it is a straightforward summary of the raw5 timing of contributions and distributions.
FIGURE 5 | DURATION COMPARISON FOR BUYOUT FUNDS

Source: StepStone, 2018.
Trends over Time
Fund durations vary over time. In vintages in which companies are costly (e.g., high market P/E ratios) during the investment period, it can take longer to achieve a good sale price, even when the operating metrics of the company look attractive. Bridge financing can delay average contribution times and will reduce duration, all else equal.6 For our subset of buyout funds, we look at the median cash flow duration and the average, weighted by invested capital. See Figure 6. Early vintages have just a couple of funds, so the average durations vary. Notably, in 1992, the average cash flow duration was over six years, whereas the median is under four years.
In this case, the average is calculated using only three funds. Interestingly, the one with the greatest amount of invested capital happens to have the longest duration. For subsequent fund analyses, we focus on vintages 1997–2007.
What trends can we detect from Figure 6? For the funds in our sample, duration was higher in the late ’90s, and again in 2006–7. Funds in these vintages were investing just prior to the tech bubble and the GFC, respectively. They bought companies during hot markets and had to hold them until the markets recovered. To add another layer to the data, we computed the total commitments by vintage for these funds. See Figure 7. Although the relationship isn’t perfect, we see a similar bowl shape in duration, commitments, and fund counts. For this subset of buyout funds, high commitment amounts and booming markets led to a longer wait before capital was returned. This is an interesting feature, given the current market, in which the public market has long been on an upward trend. Will 2017 and 2018 be longer duration vintages? While markets are hot and commitments are high, dry powder is also high. This could mean GPs are exercising restraint and spreading investments across the investment period. It could also be a symptom of bridge facilities, which allow GPs to purchase companies without drawing on committed capital. In the late 1990s and 2006–7, GPs were energetically drawing down capital. This left them concentrated in deals that had longer durations; spreading out deals over the investment period could have protected them from duration risk. These bridge facilities, by time-shifting the LP capital calls, may be obscuring the level of duration risk concentration or diversification in the current fund cycle.
The through-the-cycle estimates for our subset of buyout funds (vintages 1997–2007) are:
FIGURE 6 | CASH FLOW DURATION BY VINTAGE
Source: StepStone, 2018.
FIGURE 7 | DURATION AND AGGREGATE COMMITMENT
Source: StepStone, 2018.
» Cash flow duration: Median of 5.3 years; Average (Invested-Capital Weighted) of 5.1 years;
» Performance duration: Median of 5.1 years; Average (Invested-Capital Weighted) of 5.1 years.For example, these estimates are consistent with a fund that has an average contribution time of 2.5 years, and an average distribution time of around 7.5 years. Indeed, the fund data produce medians of 2.3 years and 7.6 years for average contribution time and average distribution time, respectively. This matches the typical buyout fund structure: invest in years 1–5 and liquidate by years 10–12.
To get a better idea of the relationship between ramp speeds and fund duration, we dig into the underlying deal-level data. The fund-level data give an idea of the liquidity of the investable product (the fund); meanwhile, the deal-level data give an idea of the liquidity of the underlying asset. If a GP invests all committed capital in two years with long deal durations, it is no surprise the fund takes longer to liquidate.
For the deal-level analysis, we start with a set of 19,595 buyout deals across geographies.7 After filtering out unrealized deals and investments not denominated in USD, we end up with a sample of 5,532 buyout deals.8 With more granular data, the picture begins to focus. See Figure 8. The stress periods of the late ’80s, the tech bubble, and the GFC show the highest median cash flow duration. The period from 1997 to 2007 has a similar pattern to the fund durations of Figure 7. Managers who invested heavily during these high-duration years would on average have to hold assets longer.
In this section, we looked at the changes in duration over time. Duration over time showed signs of cyclicality for the fund subset, and an even stronger signal for the deal-level data. In the next section, we dig deeper into what this means for your portfolio, by looking at the relationship between fund performance and duration.
FIGURE 8 | BUYOUT DEAL DURATIONS BY ENTRY
Source: StepStone, 2018.
FIGURE 9 | DURATION BY IRR QUARTILE

Source: StepStone, 2018.
Fund Duration and Performance
Is duration different for funds in different performance quartiles? If two funds have the same TVM, the one that is able to return capital quicker will have the higher IRR. Therefore, we might expect that top-quartile IRR funds have lower durations on average. To investigate this, we split our buyout funds into IRR quartiles using the Burgiss buyout vintage benchmarks. See Figure 9. This effect comes through in the data—the top-quartile funds in our subset were skewed toward lower durations compared with the other quartiles. Interestingly, the worst-performing funds included many shorter-duration funds (as well as many of the longest-duration funds). This suggests that some funds that do poorly will do so quickly; for example, if overleveraging rapidly triggers defaults in the underlying companies. Other poor performers will drag on for years, perhaps with the manager hoping to recoup some of their own invested capital.
The plots in Figure 9 help explain the through-the-cycle duration of 5.1–5.3 years. While the funds came from all performance quartiles, some vintages had no top-quartile representatives. Therefore, we expect our estimates of 5.1–5.3 years to be a bit higher than a subset with more top-quartile funds. Splitting funds by quartile, we find the median cash flow durations come out to 4.5 years (1st quartile); 5.3 years (2nd quartile); 5.4 years (3rd quartile); and 5.1 years (4th quartile).
Notice that for the poorest-performing funds, the median duration is actually less than that of the second and third quartiles. As discussed, this is because of the cluster of poor-performing, low-duration funds.
What is the relationship between raw fund performance and duration? To investigate this, we compute IRR and cash flow duration by fund. As Figure 10 illustrates, funds with low cash flow duration have a wide spread in performance: some funds have an IRR of just over 50%, others are under -40%. As duration increases, performance appears to be less diffuse. However, this is a double-edged sword: the average IRRs creep lower as well. For funds with cash flow duration of eight years, the average IRR is barely positive.
To quantify this trend, we ran a regression. The resulting trend line is IRR = 29% – (3.4% x t̂ ). The model explains 10% of the variance in the data (R2 = 0.1). However, both the intercept and coefficient are significant (p-values below 0.001). The simple linear model predicts an average IRR of 13.7% for funds with a cash flow duration of 4.5 years. For a fund with a seven-year duration, the expected performance is just 5.2%.
In this section, we looked at the interplay between performance and duration. For a subset of buyout funds, we found a median cash flow duration of 5.3 years. Meanwhile top-quartile funds showed a median duration of 4.5 years over the same period. The fund-quartile split and the linear trend analysis validated the general wisdom that longer-duration deals struggle to perform. The bottom quartile had the most probability in the longest-duration region. Interestingly, the data also showed that bottom-quartile funds sometimes have short durations, in which performance unravels quickly. Top-quartile funds were likely to have shorter durations, and less likely to have the longest durations.9 Next, we look at how duration changes with the number of fund investments.
FIGURE 10 | FUND PERFORMANCE AND DURATION
Source: StepStone, 2018.
FIGURE 11 | DURATION OF MULTIPLE FUND INVESTMENTS
Source: StepStone, 2018.
Portfolio-Level Duration
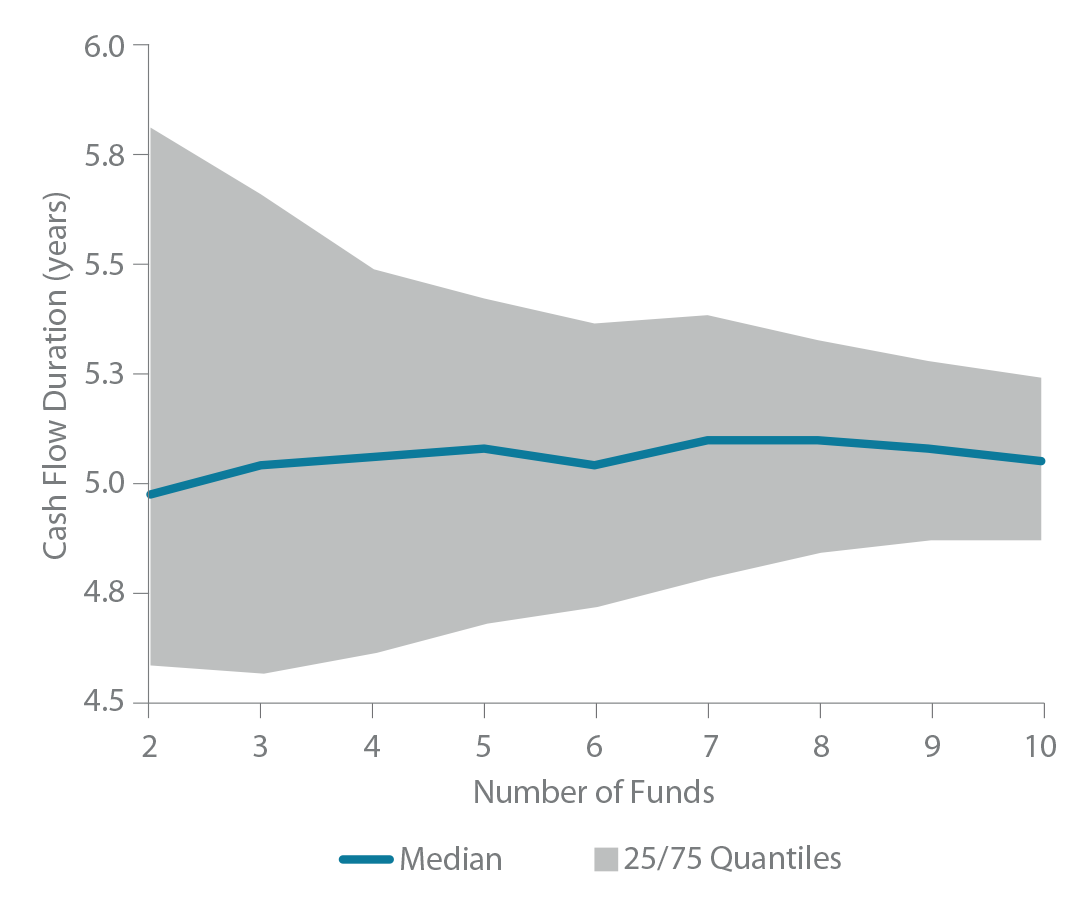
In the portfolio context, there will be more than one fund investment per vintage year. To assess how this affects duration, we looked at different combinations of buyout funds that drew capital beginning in 2004. Assuming equal investments in up to 10 funds, we computed the distribution of cash flow duration. The median duration for each of these portfolios, as well as the 25th and 75th quantiles, is presented in Figure 11.
The figure shows decreasing uncertainty in cash flow duration as the number of underlying funds increases. Risk is reduced the most by increasing from two to four funds. With a portfolio of six funds, the 75th percentile is 5.4 years, and with 10 underlying funds, the same percentile is 5.2 years. That this difference is slight suggests that investing in about six funds per vintage offers a good trade-off between duration risk and the number of relationships. In the next section, we look further into the granular aspects of private equity liquidity by considering GP differences.
Trends by GP
Using the buyout fund data, we show fund durations over time for a sample of six randomly selected managers (Figure 12). The y-axis shows the vintage year of the fund, and the size and color of the bubble indicate the cash flow duration. Manager 1, for example, suffered during the stress periods of the late ’80s as well as 1997, but has had consistent, reasonable fund durations since. In its 2006 fund, it managed to keep duration low even while many of its peers could not. Managers 2 and 3 show very consistent fund durations over time, though Manager 3 leans toward longer durations. Managers 4 and 5 have a variety of durations for their funds and show cyclical behavior. In this pool of managers, the manager with the most underlying assets (Manager 3) had the most consistent duration. For funds that invest in more portfolio companies, staffing and other operational constraints may make it difficult to be overly concentrated in one or two years. GPs with a larger population of deals should have durations closer to the mean, similar to the effect we observed in Figure 11. Moreover, a fund with more assets may attract investors who value diversification more than market timing.
FIGURE 12 | DURATION ACROSS FUNDS BY GP
Source: StepStone, 2018.
Conclusion
Capable of helping short- and long-term investors alike, private equity is not as deserving of its “illiquid” label as many believe. Although it is tempting to look at the fund hold as a summary of when all cash was returned, it is too coarse a measure. Looking into the duration of fund- and deal-level cash flows can provide a more nuanced view. The first meaningful effect is a cyclicality in fund and deal durations
over time. The stress periods of the late 1980s, late 1990s, and 2006–7 are seen clearly in the deal-level data. The fund data show a similar pattern for the tech bubble and pre-GFC. When funds are concentrated in deals from hot markets, and a correction comes, the GP often has to wait longer than anticipated to realize the deal adequately.
The second relationship we investigated was that of duration and performance. For a sample of buyout funds between 1997 and 2007, the median cash flow duration was 5.3 years. For the top-quartile funds, it was only 4.5 years. Looking at the linear trend between duration and fund IRR, we found a negative relationship between longer durations and fund IRRs. Average performance decreased 3.4% for each additional year of duration. Investing in four funds per year reduced duration uncertainty the most compared with investing in a single fund; investing in 10 funds per year versus six didn’t decrease
uncertainty much.
Finally, GPs show their own personality when it comes to duration. Some GPs maintain consistent fund durations over time and seem immune to the market cycle. Others are heavily influenced by cyclicality. We showed an example of one GP with consistent duration across funds. This manager achieves diversification by investing in many underlying companies. Avoiding concentration in one part of the market cycle may be part of the strategy.
The timing uncertainty of cash flows in private equity is very important. In public markets, the investor decides when to invest and redeem capital. In private markets, the GP determines those cash flows. Duration allows us to get a handle on this timing uncertainty. Most importantly, duration allows us to demystify the illiquidity of buyout investing. In four and a half to five years, you’ll typically get distributions on the capital you’ve invested.
1 The Macaulay duration from fixed income is an example.
2 Assuming a positive discount rate. The time value of money makes the earlier cash flows look more valuable. With a negative discount rate, the duration would be a little over two years.
3 Alternatively, how long do I need to compound total contributions (paid in) at the IRR to achieve the realized total distributions (total value)?
4 Fund data taken from StepStone SPAR net cash flow data. Duration computed on the net cash flows, net IRR, and net TVM.
5 “Raw” here means that the cash flows were not discounted.
6 For the same average distribution time.
7 SPI, as of March 2018.
8 The currency filter allows for comparison with fund durations. Additional filters on the deal IRR were included. Only deals associated with a fund investment were included.
9 Is the IRR high because the GP chooses to sell early, or does the GP sell early because the IRR is high, and they want to crystallize their carry? An interesting topic for future research, perhaps.
Read the full article here
This document is for information purposes only and has been compiled with publicly available information. StepStone makes no guarantees of the accuracy of the information provided. This information is for the use of StepStone’s clients and contacts only. This report is only provided for informational purposes. Thi