
ETFs in Insurance General Accounts – 2021

The following is an excerpt of “ETFs in Insurance General Accounts – 2021” by Raghu Ramachandran of S&P Dow Jones Indices. To read the full report, please visit the S&P DJI website.
INTRODUCTION
U.S. insurance companies added USD 4 billion to exchange-traded funds (ETFs) to their general account portfolios in 2020. By year-end 2020, U.S. insurers increased their ETF AUM by 18% from 2019. Life companies, in particular, returned to the market and purchased large amounts of ETFs. In spite of, or because of, the volatility in the bond market, insurance companies had strong flows into Fixed Income ETFs, adding USD 5 billion in 2020.
In our sixth annual study of ETF usage in U.S. insurance general accounts, for the first time we analyzed the trading of ETFs by insurance companies in addition to the holding analysis. In 2020, insurance companies traded USD 63 billion in ETFs, representing a 10% growth over 2019’s trade volume.
HOLDING ANALYSIS
Overview
As of year-end 2020, U.S. insurance companies invested USD 36.9 billion in ETFs. This represented only a tiny fraction of the USD 5.5 trillion in U.S. ETF AUM and an even smaller portion of the USD 7.2 trillion in invested assets of U.S. insurance companies. Exhibit 1 shows the use of ETFs by U.S. insurance companies over the past 17 years.
Exhibit 1: ETF AUM Growth
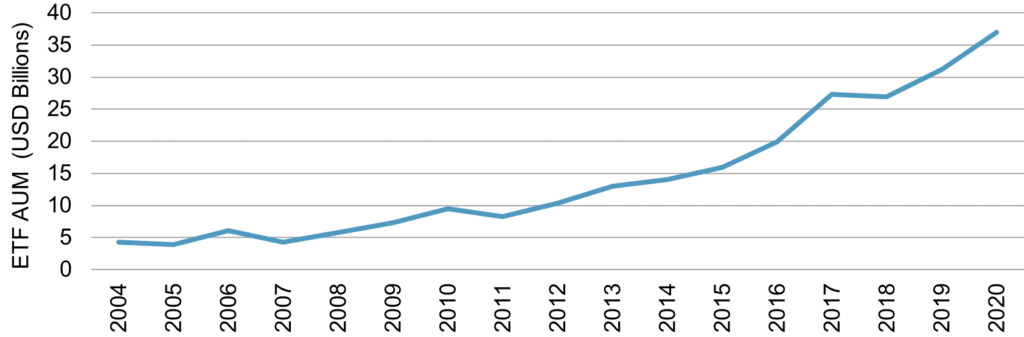
In 2020, ETF usage by insurance companies increased 18.4%; this is a slightly higher rate than the 16.0% increase in 2019. The growth rate has remained consistent since 2004, when insurance companies began investing in ETFs. This growth rate implies a doubling of ETF AUM roughly every four to five years.
For the first time, we also extracted trading data filed by insurance companies. Consistent with the numbers above, the trading analysis showed U.S. insurance companies added USD 4.1 billion to U.S. ETFs (see Exhibit 5).
Exhibit 5: ETF Net Flows

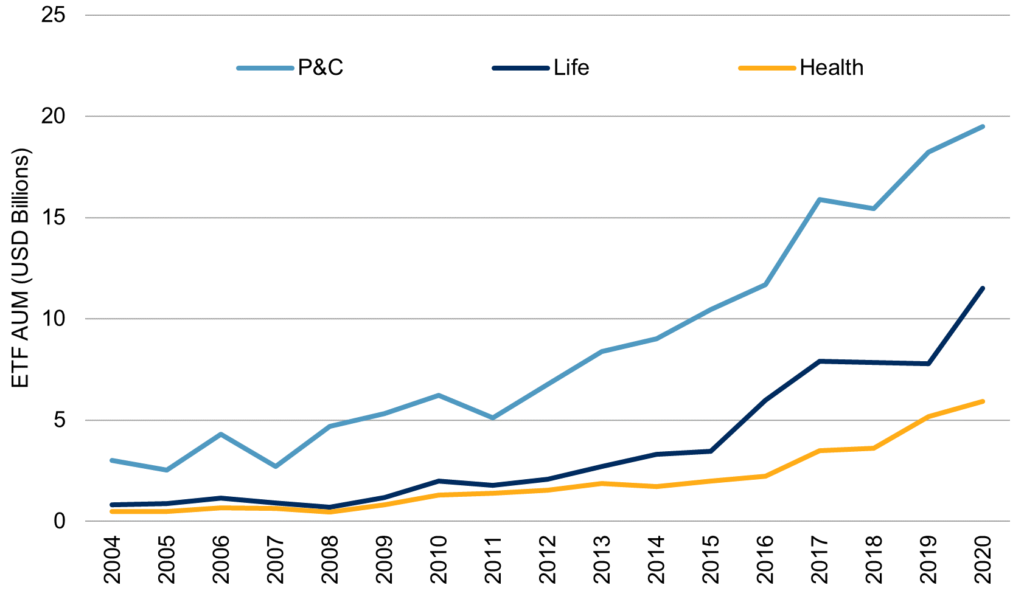
Life companies had more invested assets, but P&C companies invested more in ETFs. While all three types of insurance companies grew their ETF assets, Life companies grew their ETF holdings by almost 50% in 2020 (see Exhibit 11).
Exhibit 11: ETF AUM Growth by Company Type
In 2020, insurance companies pumped almost USD 5 billion into Fixed Income ETFs, increasing the allocation to an all-time high of USD 13 billion (see Exhibit 34).
Exhibit 34: ETF AUM by Asset Class

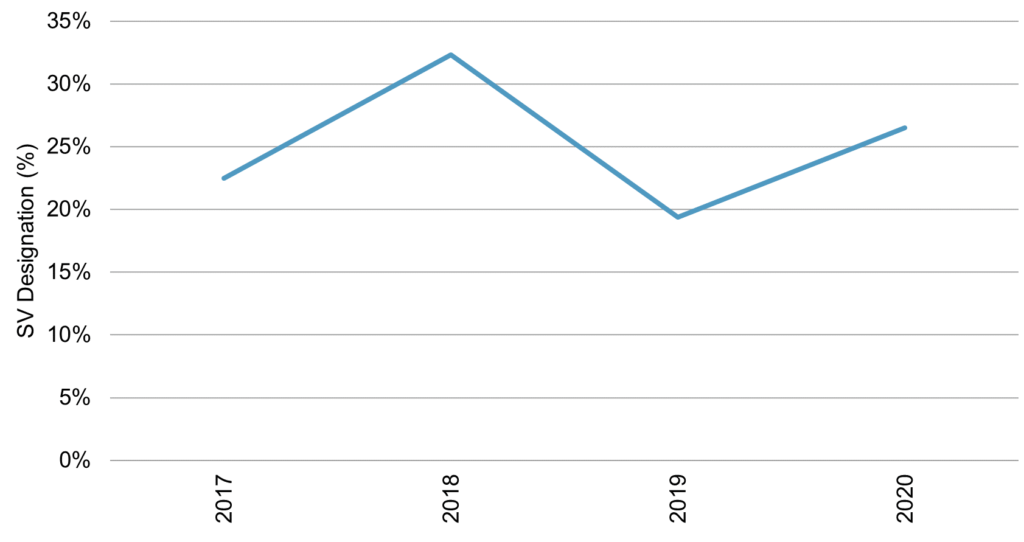
Of the USD 13 billion in Fixed Income ETFs, insurance companies designated 26.5% as SV. In the four years SV regulations have been in effect, the use of the designation has remained about 25% (see Exhibit 64).
Exhibit 64: SV Designation for Fixed Income Securities
TRADE ANALYSIS
In addition to holdings data, insurance companies also filed information for all the trades they executed over the year. For this report, we analyzed trading data back to 2015. Over the past six years, the U.S. dollar amount of ETFs traded by insurance companies increased 234% from USD 23 billion to USD 63 billion. This equated to a five-year CAGR of 21%. In 2020, the amount traded increased 10% over the amount traded in 2019 (see Exhibit 76).
Exhibit 76: ETF Trades

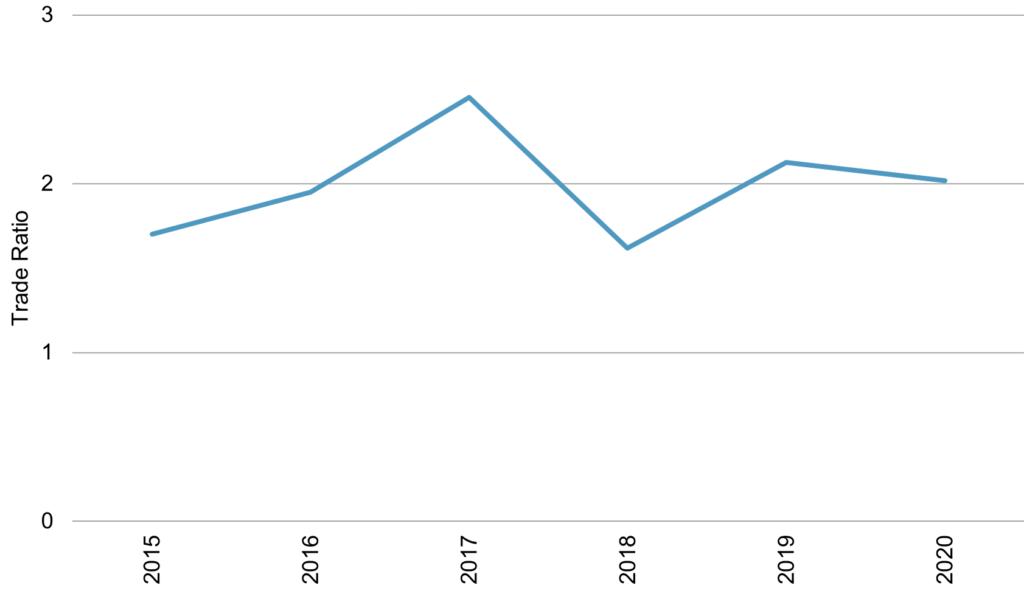
By combining the holding and trade data, we analyzed the amount of trading relative to holding. Dividing the amount traded in a given year by the number of ETFs held at the beginning of the same year gave us a trade ratio for the year. Insurance companies have consistently traded twice as many ETFs as they have held (see Exhibit 91).
Exhibit 91: ETF Trade Ratio
In terms of asset class, insurance companies traded Fixed Income ETFs much more frequently than Equity ETFs. The Equity trade ratio always remained under 2 times, while the Fixed Income trade ratio never dipped below 2 times (see Exhibit 93).
Exhibit 93: ETF Trade Ratio by Asset Class

APPENDIX 1: METHODOLOGY
The National Association of Insurance Commissioners (NAIC) requires all U.S. insurance companies to file an annual statement with state regulators. This filing includes a detailed holdings list of all securities held by insurance companies. S&P Global Market Intelligence (SPGMI) compiled this data from the NAIC and makes it available in a usable format. From this database, we extracted all insurance ETF holdings and trades, both current and historical. In addition, First Bridge, a CFRA Company, which is an ETF data and analytics company, provided us with a list of U.S. ETFs, as well as characteristics of each ETF—such as asset class, stock strategy, bond credit quality, etc. We combined First Bridge ETF classifications with SPGMI statutory filing data to gain insight into how insurance companies use ETFs.
Please refer to the appendix in the full annual paper for a more detailed description of methodology.
GENERAL DISCLAIMER
© 2021 S&P Dow Jones Indices. All rights reserved. S&P, S&P 500, S&P 500 LOW VOLATILITY INDEX, S&P 100, S&P COMPOSITE 1500, S&P 400, S&P MIDCAP 400, S&P 600, S&P SMALLCAP 600, S&P GIVI, GLOBAL TITANS, DIVIDEND ARISTOCRATS, S&P TARGET DATE INDICES, S&P PRISM, S&P STRIDE, GICS, SPIVA, SPDR and INDEXOLOGY are registered trademarks of S&P Global, Inc. (“S&P Global”) or its affiliates. DOW JONES, DJ, DJIA, THE DOW and DOW JONES INDUSTRIAL AVERAGE are registered trademarks of Dow Jones Trademark Holdings LLC (“Dow Jones”). These trademarks together with others have been licensed to S&P Dow Jones Indices LLC. Redistribution or reproduction in whole or in part are prohibited without written permission of S&P Dow Jones Indices LLC. This document does not constitute an offer of services in jurisdictions where S&P Dow Jones Indices LLC, S&P Global, Dow Jones or their respective affiliates (collectively “S&P Dow Jones Indices”) do not have the necessary licenses. Except for certain custom index calculation services, all information provided by S&P Dow Jones Indices is impersonal and not tailored to the needs of any person, entity or group of persons. S&P Dow Jones Indices receives compensation in connection with licensing its indices to third parties and providing custom calculation services. Past performance of an index is not an indication or guarantee of future results.
It is not possible to invest directly in an index. Exposure to an asset class represented by an index may be available through investable instruments based on that index. S&P Dow Jones Indices does not sponsor, endorse, sell, promote or manage any investment fund or other investment vehicle that is offered by third parties and that seeks to provide an investment return based on the performance of any index. S&P Dow Jones Indices makes no assurance that investment products based on the index will accurately track index performance or provide positive investment returns. S&P Dow Jones Indices LLC is not an investment advisor, and S&P Dow Jones Indices makes no representation regarding the advisability of investing in any such investment fund or other investment vehicle. A decision to invest in any such investment fund or other investment vehicle should not be made in reliance on any of the statements set forth in this document. Prospective investors are advised to make an investment in any such fund or other vehicle only after carefully considering the risks associated with investing in such funds, as detailed in an offering memorandum or similar document that is prepared by or on behalf of the issuer of the investment fund or other investment product or vehicle. S&P Dow Jones Indices LLC is not a tax advisor. A tax advisor should be consulted to evaluate the impact of any tax-exempt securities on portfolios and the tax consequences of making any particular investment decision. Inclusion of a security within an index is not a recommendation by S&P Dow Jones Indices to buy, sell, or hold such security, nor is it considered to be investment advice.
These materials have been prepared solely for informational purposes based upon information generally available to the public and from sources believed to be reliable. No content contained in these materials (including index data, ratings, credit-related analyses and data, research, valuations, model, software or other application or output therefrom) or any part thereof (“Content”) may be modified, reverse-engineered, reproduced or distributed in any form or by any means, or stored in a database or retrieval system, without the prior written permission of S&P Dow Jones Indices. The Content shall not be used for any unlawful or unauthorized purposes. S&P Dow Jones Indices and its third-party data providers and licensors (collectively “S&P Dow Jones Indices Parties”) do not guarantee the accuracy, completeness, timeliness or availability of the Content. S&P Dow Jones Indices Parties are not responsible for any errors or omissions, regardless of the cause, for the results obtained from the use of the Content. THE CONTENT IS PROVIDED ON AN “AS IS” BASIS. S&P DOW JONES INDICES PARTIES DISCLAIM ANY AND ALL EXPRESS OR IMPLIED WARRANTIES, INCLUDING, BUT NOT LIMITED TO, ANY WARRANTIES OF MERCHANTABILITY OR FITNESS FOR A PARTICULAR PURPOSE OR USE, FREEDOM FROM BUGS, SOFTWARE ERRORS OR DEFECTS, THAT THE CONTENT’S FUNCTIONING WILL BE UNINTERRUPTED OR THAT THE CONTENT WILL OPERATE WITH ANY SOFTWARE OR HARDWARE CONFIGURATION. In no event shall S&P Dow Jones Indices Parties be liable to any party for any direct, indirect, incidental, exemplary, compensatory, punitive, special or consequential damages, costs, expenses, legal fees, or losses (including, without limitation, lost income or lost profits and opportunity costs) in connection with any use of the Content even if advised of the possibility of such damages.
S&P Global keeps certain activities of its various divisions and business units separate from each other in order to preserve the independence and objectivity of their respective activities. As a result, certain divisions and business units of S&P Global may have information that is not available to other business units. S&P Global has established policies and procedures to maintain the confidentiality of certain non-public information received in connection with each analytical process.
In addition, S&P Dow Jones Indices provides a wide range of services to, or relating to, many organizations, including issuers of securities, investment advisers, broker-dealers, investment banks, other financial institutions and financial intermediaries, and accordingly may receive fees or other economic benefits from those organizations, including organizations whose securities or services they may recommend, rate, include in model portfolios, evaluate or otherwise address.
Sign Up Now for Full Access to Articles and Podcasts!
Unlock full access to our vast content library by registering as an institutional investor .
Create an accountAlready have an account ? Sign in