What will the next recession look like? Each past recession has had its own characteristics: borrowing from Tolstoy, every recession makes us unhappy in its own way. We, of course, don’t know exactly how the next recession will make us unhappy, but we can take some hints both from history and from the current state of the economy.
Looking back at prior recessions, each had its distinct features. The 1990 recession came during a time of relatively high unemployment (even pre-recession, unemployment was at 5%) and was marked throughout by labor market weakness. Its post-recession period was the first to be called a jobless recovery. The 2001 recession, mild in many respects, was notable for stock market declines (the bursting of the dot-com bubble). The 2008 financial crisis was marked by a long and slow recovery, as well as the losses in the housing market.Obviously, the pandemic recession was particularly unique with massive and shocking upheaval to just about every aspect of the economy.
We expect a recession in 2023. If one does come to pass, it is most likely to be characterized by its volatility—with the economy fishtailing its way to a post-pandemic normal. We expect continued economic volatility, with an uneven downturn and recovery.
Post-Inflation Recessions Are More Volatile
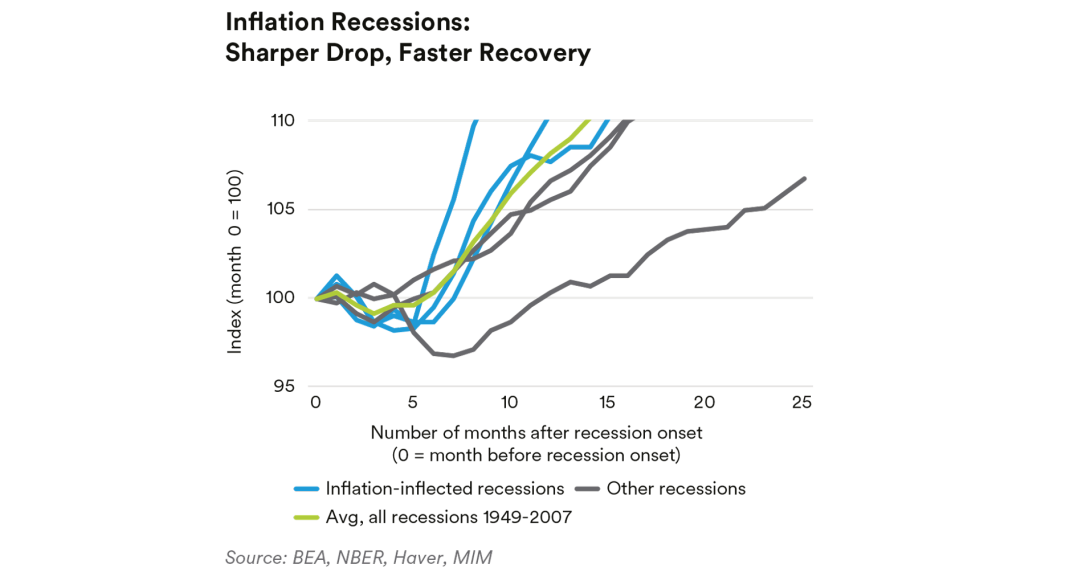
We turn first to the historical record. Post-inflation recessions in the U.S. have tended to develop more rapidly and have sharper recoveries than recessions that were not preceded by a period of high inflation.
There were three, well-defined, high-inflation recessions in the modern era: the post-World War II recession in 1949, the Korean War recession in 1953, and the 1981 stagflation recession.1 Other recessions, including the Great Financial Crisis, the 2000 dot-com bubble, and the 1990 recession did not see unusual levels of inflation prior to the recession. As depicted below, the inflation recessions tended to be sharper in the initial quarter or two of negative growth. Even more distinct is the recovery, with inflation recessions recovering nearly a year more quickly than non-inflation recessions (this includes the recession itself and the recovery).2
The FOMC Has Had a Role in Exacerbating Volatility
Post-inflation recessions being more volatile makes sense economically. Trying to manage inflation requires slowing down economic activity more quickly than it otherwise might. The Fed has less urgency to raise rates quickly in recessions when inflation is not threatening to become endemic, and so taps the monetary policy brakes more lightly.3
The current Fed has so far been in line with that historical experience, shifting rapidly from loosening (quantitative-easing purchases were only completedin April 2022) to a very rapid tightening pace. The Fed was by all accounts caught flatfooted as inflation rose. Some of this was likely due to its emphasis on “data dependence.” Although this sounds like an appropriately cautious policy, this may have been exactly the wrong policy in a time of escalating inflation. Inflation is widely seen as lagging monetary policy, and the lag could be greater than a year. With that in mind, an inflationary period may be exactly the wrong time to be data dependent. Indeed, with this lagged focus on inflation, we worry the Fed could induce an excessively deep slowdown, and that prices could be pushed into deflation.
Righting the Current Imbalances May Take Time—and Volatility
Another source of volatility is the migration of the economy to a post-pandemic “new normal.” There are many economic measures that are still out of balance, more than two years after the onset of the COVID-19 pandemic. The economy appears to still be struggling toward a new equilibrium, but there have been—and will likely be—stops, starts, and stumbles along the way.
Current Imbalances in the Business Sector
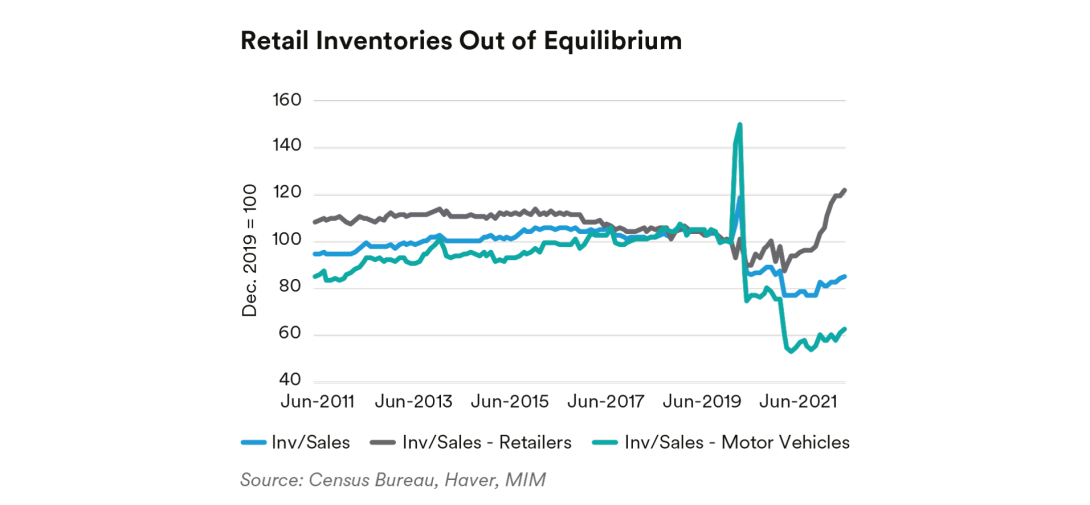
Producer Patterns. Perhaps the most discussed of the various shocks to the economy, supply chains have seen enormous volatility during the pandemic.Inventories show the stresses well. For general merchandise stores (so called “big box” stores that sell a broad variety of goods), inventories relative to sales have skyrocketed. The inventory-to-sales ratio for motor vehicles and parts remains historically low with minimal signs of recovery; the story is similar at the aggregate level, although not quite as extreme. Certainly, inventories have become a much more prominent problem for retailers, as all components of inventory management—projecting consumer demand as well as managing supply chains—remain uncertain.
Most firms are likely still not at their long-run desired levels of inventories. Achieving more appropriate inventory levels is a multifaceted problem. Oneproblem—likely more difficult than in prior times—is determining the correct, new desired inventoryto-sales ratio. Another point is forecasting demand growth given ever-changing consumer preferencesand macroeconomic uncertainty. A third is getting suppliers to actually supply in a timely manner. Each of these points has a much higher level of uncertainty than in prior times, and this forecast uncertainty is likely to extend the period of dislocation.
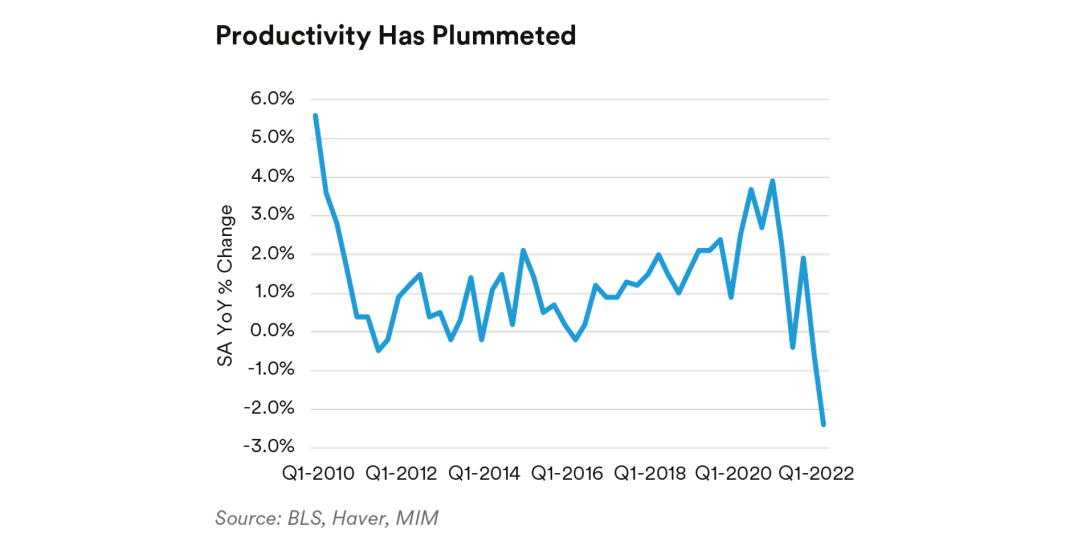
Labor Market Activity. Companies laid off a huge number of workers during the pandemic. Labor productivity rose to the highest level since 2010 as only the most critical workers were kept on.
The rebound in consumer spending after the initial pandemic response, combined with the large decline in the labor force, left many companies flatfooted and scrambling to hire throughout 2021 and into 2022.
Now, productivity plummeted to its lowest recorded levels, meaning there are doubts about how much more hiring is sensible in the current economy. Companies may have once again overreacted by hiring too many people relative to the economy’s optimal output. Labor productivity is about one percentage point below its pre-COVID-19 trend, or about one year behind where it “ought” to be. This may right itself as businesses respond to relatively expensive labor costs, or we could be in a period of weaker productivity growth as the economy recalibrates to a world with hybrid work, more resilient supply chains, and increased geopolitical and environmental uncertainty.
Corporate Profits. Corporate profits declined for a few quarters as a share of GDP, leading many to posit that we were rapidly approaching a recession. This was accompanied by doubts that firms would be able to pass on their rising costs to consumers. In that context, the corporate profit-to-GDP in Q2 2022 was something of a surprise, rising as it did to 12.2%.
We regard this measure as a leading indicator for layoffs: corporate profit margins tend to decline toward the end of a business cycle. Once margin compression becomes too painful, companies begin to lay off workers. Although Q4 2021 and Q1 2022 saw a sharp decline in margins, indicating that layoffs could be on the horizon, the uptick in margins for Q2 implies a temporary forestalling of potential layoffs. The relatively strong profits may leave corporations flush enough to continue hiring people in the current quarter (Q3), despite the fall-off in productivity. The longer-term narrative remains uncertain, adding to the overall volatility.

Current Imbalances Among Households
Savings. At the start of the pandemic, households stayed home, dramatically cutting back their consumption. Stimulus spending was also initially largely hoarded rather than spent. These two forces led to unprecedented savings rates by mid-2020.
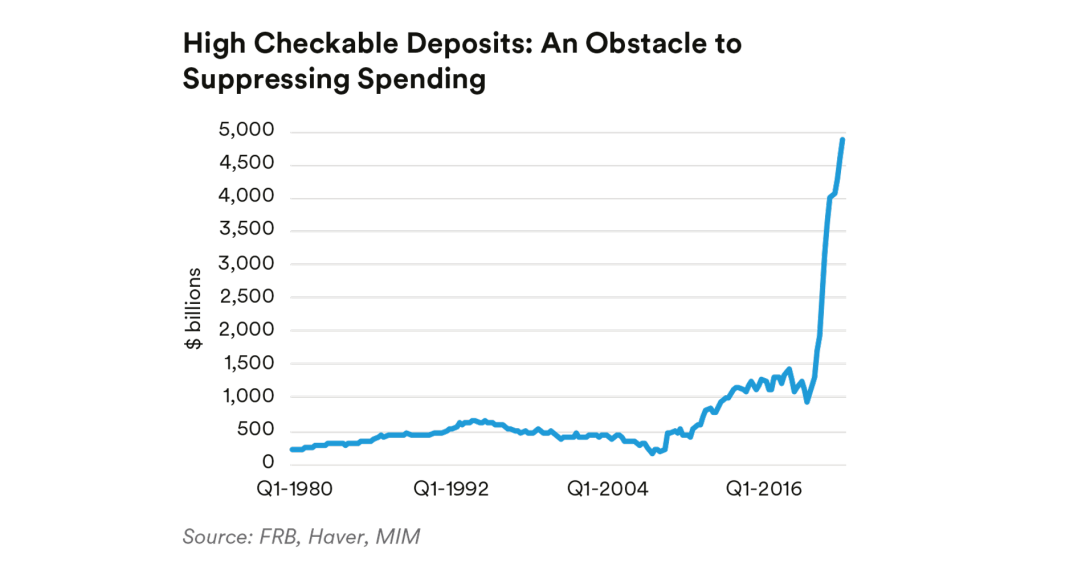
One indicator of the breadth of savings is the increase in checking account balances. Checking and cash holdings are an indicator of liquidity, which, for households above a certain threshold, will not increase significantly with more wealth. Instead, checking and cash balances are most likely to increase for people with sub-optimal levels of liquidity.
High checkable balances persist and present a formidable obstacle to the FOMC’s goals of suppressing spending.
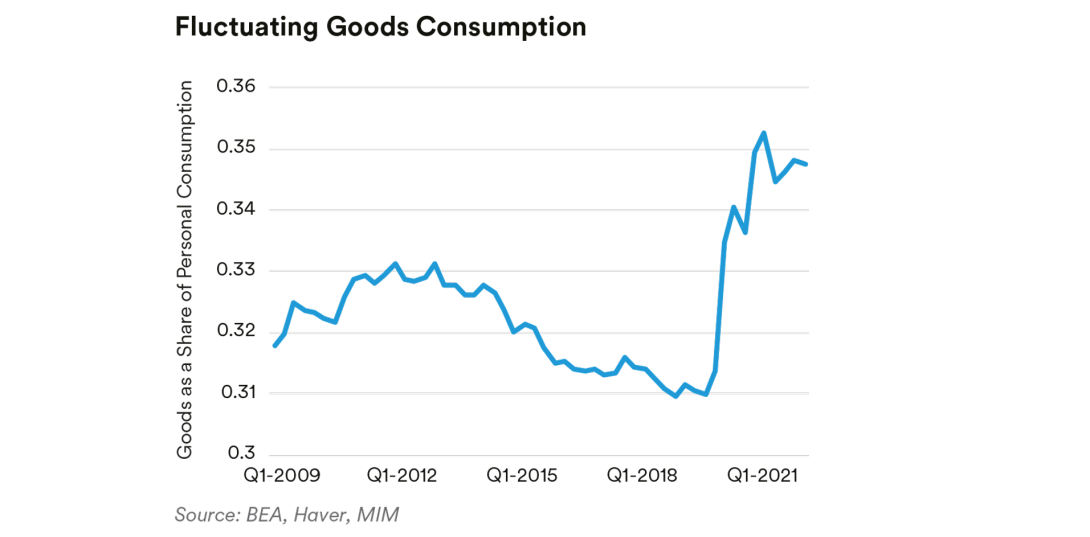
Spending Composition. Consumers shifted their spending from services to goods at the start of the pandemic, resulting in a spending shift of nearly $1.5 trillion away from services. As a share of total consumption, services remain well below prepandemic norms at 65.3% (compared with 69.0% in Q4 2019).
Forecasting consumers’ future mix of goods and services is extremely difficult at this point. Goods consumption has settled in close to its peak. After spending months at those elevated shares, it’s not clear how quickly—and to what long-term trend—goods consumption will migrate.
The shift toward services appears to be taking place, but services tend to be a relatively slow-moving series—they tend to be linked to habits or contracts, which are harder to restart (e.g., gym memberships, daily lunch at work). This could mean that the rebalancing could take a substantial amount of time.
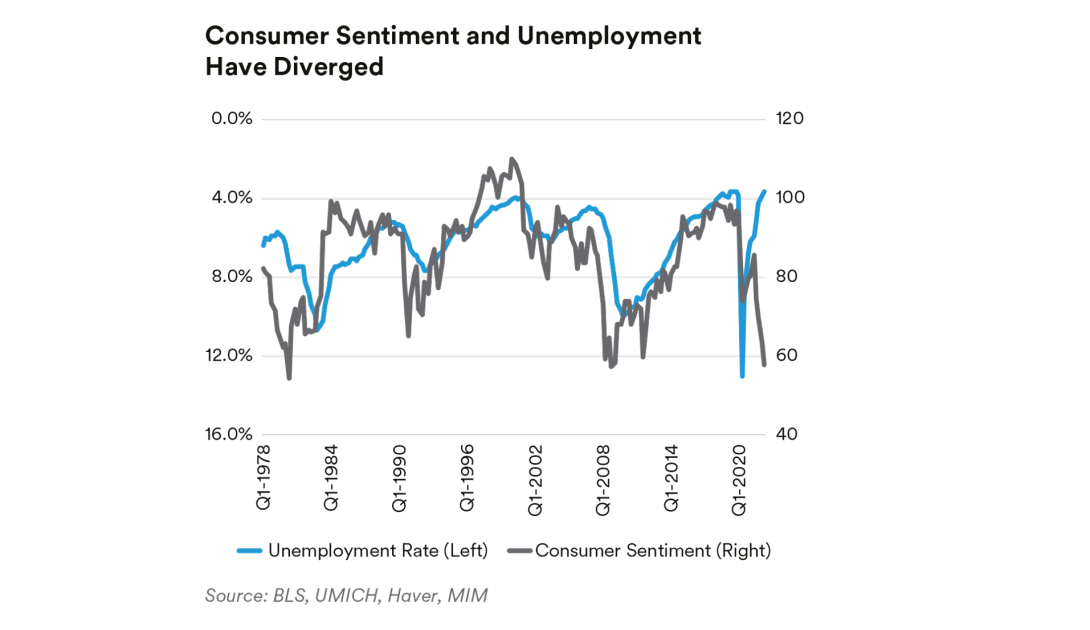
Labor Market and Consumer Asynchrony. There’s an unusual asynchrony building between the labor market and consumers.
Normally, there is some correlation between unemployment and consumer sentiment. As unemployment falls (LHS, inverted axis), consumers feel better, and sentiment improves. Consumer sentiment tends to plateau a bit before unemployment, but at no other time since record-keeping began, has consumer sentiment diverged this dramatically from unemployment. Whether this foreshadows an uptick in unemployment, or something else altogether, is so far unclear.
Going Forward
We expect a recession in 2023. Although it is impossible to know with certainty what it will look like, we have some clues from history and the current economic situation.
Given the inflation-based nature of the recession and the continued strength of the FOMC response, we feel the recession is more likely to be somewhat sharper in its decline, and more likely to rebound quickly, than the more recent recessions in 2001 and 2008. We worry that the FOMC could raise rates too high as it seeks to reassure economic participants, creating a sharp downturn.
Given the number of economic parameters that are still out of line with pre-pandemic norms, and the uncertain nature of their longer-run equilibrium levels, we expect an “echo boom”—a fainter version of the original shocks—as economic variables adjust in a way that’s reflective of, yet less pronounced than, the midpandemic swings.
In short, we see the most likely path for a recession to be an economy with continued volatility that continues to fishtail its way toward an eventual new equilibrium. This could include events not anticipated by the markets, principally a sharp deceleration in prices up to and including deflation.
Endnotes
1 There was a series of recessions in the 1970s, but as inflation was only finally brought under control in the final 1981 recession, we focus on that one.
2 At the point where the economy has attained 105% of its pre-recession GDP.
3 The steeper drop and recovery pattern was also the case in 1949 when the Fed did not have monetary policy at its fingertips as it does now. Instead, there was a more organic collapse of economic growth as hoarded savings were spent out after WWII.
Read More
Disclaimer
This material is intended solely for Institutional Investors, Qualified Investors and Professional Investors. This analysis is not intended for distribution with Retail Investors.
This document has been prepared by MetLife Investment Management (“MIM”) solely for informational purposes and does not constitute a recommendation regarding any investments or the provision of any investment advice, or constitute or form part of any advertisement of, offer for sale or subscription of, solicitation or invitation of any offer or recommendation to purchase or subscribe for any securities or investment advisory services. The views expressed herein are solely those of MIM and do not necessarily reflect, nor are they necessarily consistent with, the views held by, or the forecasts utilized by, the entities within the MetLife enterprise that provide insurance products, annuities and employee benefit programs. The information and opinions presented or contained in this document are provided as of the date it was written. It should be understood that subsequent developments may materially affect the information contained in this document, which none of MIM, its affiliates, advisors or representatives are under an obligation to update, revise or affirm. It is not MIM’s intention to provide, and you may not rely on this document as providing, a recommendation with respect to any particular investment strategy or investment. Affiliates of MIM may perform services for, solicit business from, hold long or short positions in, or otherwise be interested in the investments (including derivatives) of any company mentioned herein. This document may contain forward-looking statements, as well as predictions, projections and forecasts of the economy or economic trends of the markets, which are not necessarily indicative of the future. Any or all forward-looking statements, as well as those included in any other material discussed at the presentation, may turn out to be wrong.
All investments involve risks including the potential for loss of principle and past performance does not guarantee similar future results.
In the U.S. this document is communicated by MetLife Investment Management, LLC (MIM, LLC), a U.S. Securities Exchange Commission registered investment adviser. MIM, LLC is a subsidiary of MetLife, Inc. and part of MetLife Investment Management. Registration with the SEC does not imply a certain level of skill or that the SEC has endorsed the investment advisor.
This document is being distributed by MetLife Investment Management Limited (“MIML”), authorised and regulated by the UK Financial Conduct Authority (FCA reference number 623761), registered address 1 Angel Lane, 8th Floor, London, EC4R 3AB, United Kingdom. This document is approved by MIML as a financial promotion for distribution in the UK. This document is only intended for, and may only be distributed to, investors in the UK and EEA who qualify as a “professional client” as defined under the Markets in Financial Instruments Directive (2014/65/EU), as implemented in the relevant EEA jurisdiction, and the retained EU law version of the same in the UK.
MIMEL: For investors in the EEA, this document is being distributed by MetLife Investment Management Europe Limited (“MIMEL”), authorised and regulated by the Central Bank of Ireland (registered number: C451684), registered address 20 on Hatch, Lower Hatch Street, Dublin 2, Ireland. This document is approved by MIMEL as marketing communications for the purposes of the EU Directive 2014/65/EU on markets in financial instruments (“MiFID II”). Where MIMEL does not have an applicable cross-border licence, this document is only intended for, and may only be distributed on request to, investors in the EEA who qualify as a “professional client” as defined under MiFID II, as implemented in the relevant EEA jurisdiction.
For investors in the Middle East: This document is directed at and intended for institutional investors (as such term is defined in the various jurisdictions) only. The recipient of this document acknowledges that (1) no regulator or governmental authority in the Gulf Cooperation Council (“GCC”) or the Middle East has reviewed or approved this document or the substance contained within it, (2) this document is not for general circulation in the GCC or the Middle East and is provided on a confidential basis to the addressee only, (3) MetLife Investment Management is not licensed or regulated by any regulatory or governmental authority in the Middle East or the GCC, and (4) this document does not constitute or form part of any investment advice or solicitation of investment products in the GCC or Middle East or in any jurisdiction in which the provision of investment advice or any solicitation would be unlawful under the securities laws of such jurisdiction (and this document is therefore not construed as such).
For investors in Japan: This document is being distributed by MetLife Asset Management Corp. (Japan) (“MAM”), 1-3 Kioicho, Chiyoda-ku, Tokyo 102- 0094, Tokyo Garden Terrace KioiCho Kioi Tower 25F, a registered Financial Instruments Business Operator (“FIBO”) under the registration entry Director General of the Kanto Local Finance Bureau (FIBO) No. 2414.
For Investors in Hong Kong S.A.R.: This document is being issued by MetLife Investments Asia Limited (“MIAL”), a part of MIM, and it has not been reviewed by the Securities and Futures Commission of Hong Kong (“SFC”). MIAL is licensed by the Securities and Futures Commission for Type 1 (dealing in securities), Type 4 (advising on securities) and Type 9 (asset management) regulated activities.
For investors in Australia: This information is distributed by MIM LLC and is intended for “wholesale clients” as defined in section 761G of the Corporations Act 2001 (Cth) (the Act). MIM LLC exempt from the requirement to hold an Australian financial services license under the Act in respect of the financial services it provides to Australian clients. MIM LLC is regulated by the SEC under US law, which is different from Australian law.
1 MetLife Investment Management (“MIM”) is MetLife, Inc.’s institutional management business and the marketing name for subsidiaries of MetLife that provide investment management services to MetLife’s general account, separate accounts and/or unaffiliated/third party investors, including: Metropolitan Life Insurance Company, MetLife Investment Management, LLC, MetLife Investment Management Limited, MetLife Investments Limited, MetLife Investments Asia Limited, MetLife Latin America Asesorias e Inversiones Limitada, MetLife Asset Management Corp. (Japan), and MIM I LLC and MetLife Investment Management Europe Limited.