High Yield for Insurance Companies: For Everything There is a Season
Executive Summary
High yield corporate bonds and bank loans are core asset classes within many insurers’ strategic asset allocation frameworks.
While insurers’ exposure to high yield declined in recent years as a result of de-risking actions taken late in the credit cycle, this trend likely has reversed in H1 2020 mainly due to the large magnitude of ratings downgrades; namely fallen angels.
Given the complexity of managing insurance company investment portfolios and the inherent higher risk nature of high yield, there are many factors for insurers to consider when assessing the optimal exposure, pursuing portfolio sales and evaluating new investments in the asset class.
Insurance companies and their asset managers should have a disciplined investment process around fundamental credit analysis, risk management and relative value, and given the current uncertain environment, may want to consider a higher-quality high yield investment strategy.
High Yield: Relatively Small Exposure for Insurers, But Rising in Size and Importance
High yield bonds and bank loans, while comprising only a relatively small part of insurance company investment portfolios, are an important and topical asset class that requires an active management strategy. For insurers’, high yield (HY) can be an attractive asset class providing higher coupon income, portfolio diversification and a match for shorter duration liabilities, and in the case of bank loans, also offering security given its seniority in the capital structure and exposure to floating rate assets.
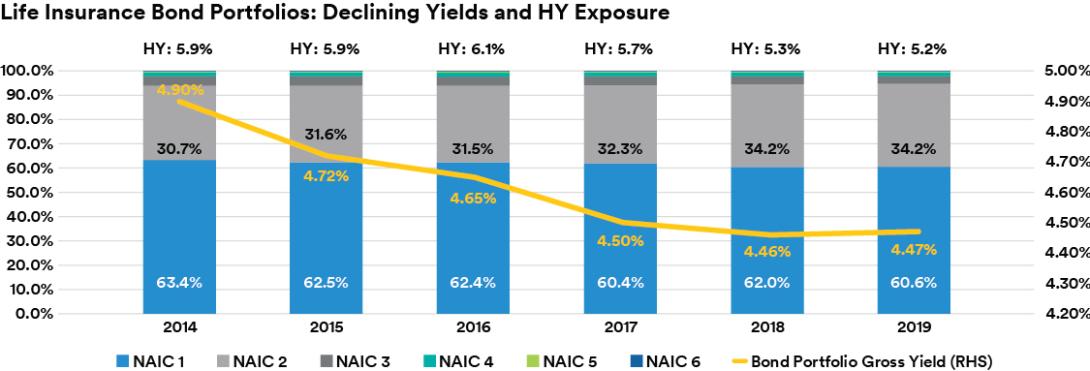
With bonds comprising the largest component of life and property & casualty insurance investment portfolios and yields declining over the last few years as a result of lower interest rates, the quality composition of insurers’ bond portfolios has shifted. For the life insurance industry, as shown in the figure below, within bond portfolios, NAIC 2 allocations (or the equivalent ratings range of BBB+ to BBB- on an S&P scale) increased by 3.5 percentage points over the five-year period from year-end 2014 to 2019, to 34.2% of total bond portfolios at December 31, 2019. This increase reflects the significant growth in the size of the BBB U.S. corporate credit market, by an estimated 61% during the same period to $3.65 trillion (for the ICE BofA BBB corporate index), as well as the search for higher yielding investment grade (IG) securities. In contrast, allocations to higher quality (NAIC 1, representing A-rated and above) and lower quality (NAIC 3-6, representing BB-rated and below) bonds declined. At December 31, 2019, high yield represented 5.2% of total bond portfolios, down from 5.9% at year-end 2014. Further, high yield exposure is down from the peak allocation of 6.1% at year-end 2016. While the need for income did not dissipate over this period, life insurers, including some large publicly traded companies, de-risked portfolios in recent years as a result of commodity-price weakness, late-cycle credit concerns and rich valuations that did not reflect rising recession risks. By rating category, life insurers’ high yield portfolios skew toward higher quality, with nearly 2/3 invested in NAIC 3 rated bonds (representing BB+ to BB- ratings).
Source: U.S. life industry statutory information via S&P Market Intelligence
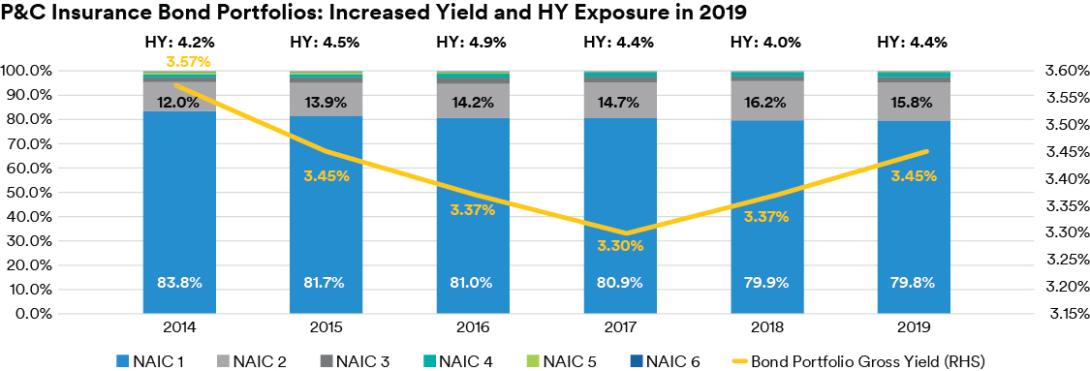
Bond quality for the P&C industry varies from the life industry, most notably with higher exposure to NAIC 1 and lower exposure to NAIC 2 holdings. Additionally, with generally shorter-tail liabilities and lower investment capital charges as compared to life insurers, the variation in high yield allocations has not been as dramatic for P&C insurers; in fact, the industry’s exposure to high yield increased in 2019 to 4.4% of total bonds at December 31, 2019 from 4.0% at December 31, 2018. The mix of P&C insurers’ exposure to high yield is relatively balanced between NAIC 3 and NAIC 4 holdings, as shown in the figure below.
Source: U.S. P&C industry statutory information via S&P Market Intelligence
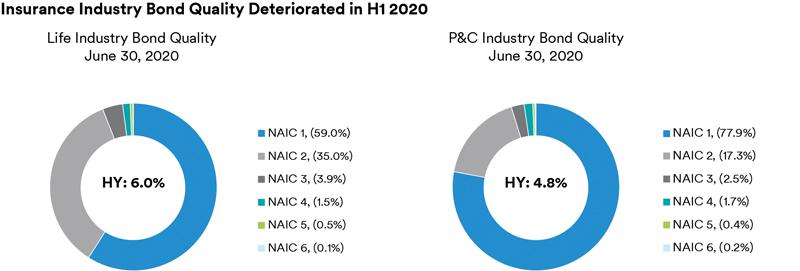
Source: U.S. Life and P&C industry statutory information via S&P Global Ratings
According to S&P Global Ratings, insurance industry high yield exposure increased from year-end 2019—to 6.0% of the total bond portfolio for the life insurance industry and to 4.8% for the P&C insurance industry at June 30, 2020, reflecting several varying dynamics at play in 2020. Increasing the insurance industry’s HY exposure has been the significant number of ratings downgrades in 2020, including corporate issuers that fall to HY from IG (“fallen angels”). Downgrades to HY have been driven by high leverage following recent M&A activity, oil price weakness and the negative fundamental impacts resulting from the COVID-19 pandemic. According to J.P. Morgan, as of November 4, 2020 there have been 53 fallen angels globally representing approximately $205 billion in debt (37 and $182 billion, respectively, in the U.S.), which are the highest levels on record. Fallen angel activity in 2020 has been concentrated in selected sectors, notably energy (more than half of year-to-date fallen angels), manufacturing and consumer industries.
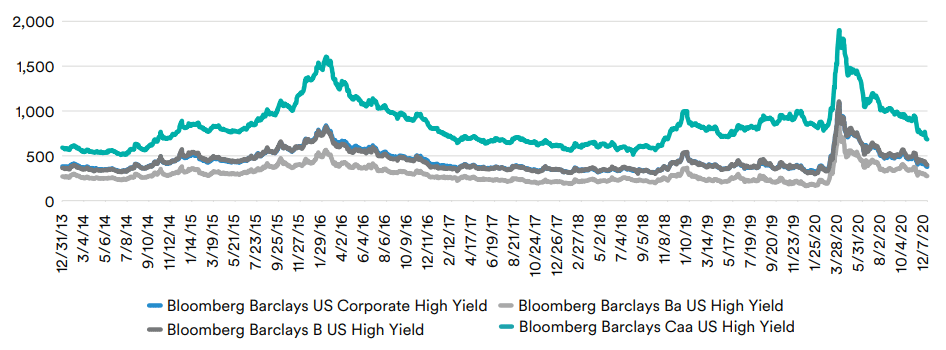
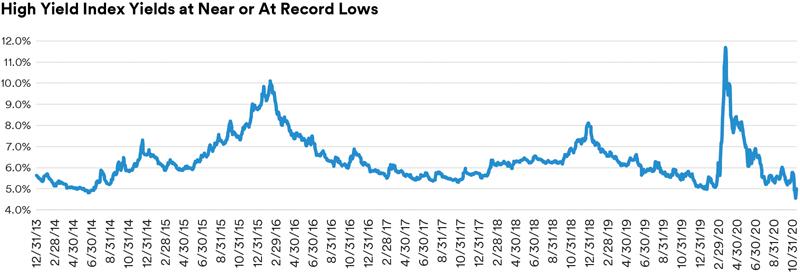
Another factor that may have also contributed to the increase in insurers’ high yield exposure is potential opportunistic purchases during the depths of COVID-19 crisis in late 1Q to early 2Q. Companies that may have stepped in during this period likely had room within HY risk limits, perhaps due to de-risking actions taken over the past couple years. During the aforementioned time period, as shown in the figure below, HY spreads gapped out, with the Bloomberg Barclays HY index reaching a peak of 1,100 basis points (bps) on March 23, 2020. Even the Bloomberg Barclays BB index, which is where insurers’ largely focus their holdings and purchases, traded as wide as 865 bps. These buying opportunities were relatively short-lived, as spreads rapidly tightened beginning in April as a result of U.S. Federal Reserve (Fed) actions to support credit markets, including the April 9 announcement that fallen angels meeting certain criteria would be included in the Fed’s bond buying program. This resulted in strong market technicals, leading to further HY spread tightening, which has only continued post-election and following the news of a potential COVID vaccine. As of November 21, 2020, the Bloomberg Barclays HY index is now trading at 435 bps, which is slightly tighter than the 446 bps average since the beginning of 2014.
High Yield Index Spreads Widened Significantly in Early 2020, But Opportunity to Buy Was Short-Lived
Source: Bloomberg Barclays
In addition to purchases in the secondary market, insurers have had the ability to buy in the primary market given the significant amount of HY corporate credit issuance year-to-date in 2020. Through October 30, 2020, according to JP Morgan data, HY issuance totaled roughly $388 billion, up 68% from the same period in 2019, with BB issuers representing 46% of this total. The main uses of proceeds for corporate issuers have been to refinance debt (65%) and for general corporate purposes (26%) as companies took advantage of open credit markets to boost liquidity positions in the current uncertain COVID-19 environment. Initial companies that tapped the market were largely ones in stressed sectors issuing senior secured debt at high coupon rates, while more recently, larger bellwether HY issuers and recent fallen angels have raised unsecured debt at lower coupon rates. In fact, according to Barclays, in H1 2020 approximately 60% of new HY issuance (BB and B) had coupon rates of 6% or greater, including more than 20% at over 8%. In contrast, to-date in H2 2020 (through October 30, 2020, approximately 63% of HY issuance (BB and B) have coupons less than 6%.
While some insurers were comfortable taking on HY risk over the past several months, others have not been active in the HY market due to continued fundamental concerns and the view that valuations do not reflect elevated credit risks. These insurers stayed on the sidelines during the crisis and may have taken advantage of tighter spreads to reduce risk in HY to position portfolios for more attractive buying opportunities in the future. For these companies, HY exposure is likely to have declined in 2020, particularly given continued tender and call activity by issuers seeking to take out higher coupon debt in the low rate environment, which may have accelerated the roll-off of insurers’ HY holdings.
Many factors at play when determining insurers’ optimal high yield exposure
High yield corporate credit, including bank loans, can play an important role in insurance company investment portfolios, as directed by insurers’ strategic asset allocation (SAA) process. Yet, there are certain financial and risk management factors for insurers to consider when determining the appropriate and optimal allocation to this asset class. These include:
Stress testing of credit portfolios. With stretched corporate balance sheets as a result of record debt issuance, as well as continued economic and market uncertainty reflecting a resurgence in COVID-19 cases and election-related risks, default rates and ratings downgrades will likely remain elevated for the remainder of 2020 and into 2021. In fact, according to Moody’s in its September 2020 Default Report (dated October 9, 2020), in its baseline scenario, the U.S. speculative grade (SG) default rate is expected to end 2020 at 10.5% and peak at 11.1% in 1Q21. This compares to Moody’s calculated 8.5% SG default rate in September 2020 and pre-pandemic levels of 4.5%. Further, Moody’s expects additional ratings downgrades over the next year; for example, 11.3% of A3 ratings globally are expected to fall to the Baa category and 7.8% of Baa3 ratings globally are projected to fall to below investment grade (i.e. fallen angels), on top of what has occurred year-to-date. In this challenging environment, insurers must have a robust surveillance program to identify potential troubled sectors and credits in various base and stress case scenarios. As part of this program, insurers can perform a bottoms-up, issuer by issuer fundamental credit analysis and compare and contrast it to the results of a top-down methodology based on internal / external forecasts (such as Moody’s). This analysis can provide a range of potential outcomes for credit losses and downward ratings migration within insurance company portfolios.
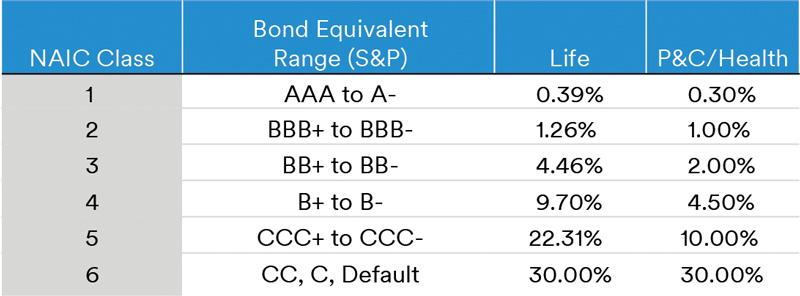
Capital implications of downgrades. Under the U.S. risk-based capital (RBC) statutory framework, capital requirements vary by type of insurance company (life, P&C and health) and rating, with lower quality securities necessitating insurers to hold greater amounts of capital. For example, as shown in the figure below, U.S. life insurers must hold over 2.2x more capital to back a NAIC 2-rated bond compared to NAIC 1 bond, as measured by the difference between the capital charges shown in the table below. For life companies, the drop to high yield is even more onerous, with a 2.5x increase in capital requirements to hold NAIC 3 bonds compared to NAIC 2. Further, if a bond downgraded to HY becomes a top 10 holding in an insurer’s portfolio, the risk charge could double. While these are the capital charges for U.S. based insurers, other global regulatory regimes are similar requiring higher required capital to support higher risk assets. Insurers should measure the capital impact of actual and projected downgrades and defaults on individual company credit portfolios, taking into account company-specific covariance impacts from investments, underwriting, etc. Increased capital requirements can then be compared to excess capital above company RBC targets, which are often based on an insurers’ ratings, objectives and priorities, to determine if the insurer has the capacity to absorb and hold higher-risk assets.
Insurance Risk-Based Capital Charges Sharply Increase as Quality Declines
Capital factors are for insurers’ unaffiliated bond holdings and are pre-tax and pre-covariance (which varies by company). Source: NAIC
Risk limits by sector and issuer. As part of risk management frameworks, insurers typically have minimum and maximum exposure limits set at the management and/or Board level, for individual insurance entities and/or on an enterprise basis. These sector and issuer limits are incorporated within investment guidelines and insurers and/or their asset managers must manage to these limits to minimize breaches that may need to be reviewed as high as the Investment Committee of the Board level. With recent ratings downgrades, including fallen angels to high yield, exposure to individual issuers may exceed maximum limits, which can be cured through either temporary waivers (and perhaps revised limits / guidelines in the future) or portfolio sales.
Mark to market valuation changes. During the depths of the COVID-19 crisis, high yield market valuations dropped rapidly and significantly, with the Bloomberg Barclays HY index price declining approximately 20% during a three-week period to about $79 on March 23, 2020. For U.S. insurers that held these HY bonds through the crisis, unrealized losses flowed through to GAAP equity via other comprehensive income (assuming available for sale securities). Similarly, on a statutory basis, unrealized losses from lower valuations negatively impacted insurers’ surplus levels. Further, mark to market impacts are greater at P&C insurers than life insurers, given that all high yield bonds (NAIC 3-6) are carried at the lower of amortized cost or fair value, as compared to only NAIC 6 rated bonds for life insurers (NAIC 1-5 are held at amortized cost). For U.S. insurers, declines in statutory surplus could reduce excess capital and financial flexibility, which potentially could have a negative impact on insurance company ratings, particularly if coupled with additional liability stresses such as catastrophe losses, elevated claims or reserve charges.
Considerations and constraints of active management of HY portfolios
Due to the above-mentioned factors, insurance companies may seek to take portfolio repositioning actions, including within high yield portfolios, based on credit, risk management and/or relative value views. In these scenarios, insurers may pursue portfolio sales, which presents additional considerations and constraints unique to insurance companies.
Impact on net investment income (NII). Insurance companies with income-focused, buy and manage/hold strategies must consider the legacy book yields on HY bonds when considering reducing exposure. Given the current low yield environment, even for HY bonds, it is likely that portfolio sale proceeds will be reinvested at lower rates, assuming similar credit quality. The insurer needs to balance the potential for reducing income with the fundamental view of the credit, including further downgrade risk or potentially even default risk. Offsetting lower yields may be potential gains on sales resulting from the material decline in interest rates over the same time period. Overall, an insurer’s financial objectives and priorities will drive its decision to either hold certain HY bonds, perhaps taking credit and mark to market risk, or sell the positions and giving up potential NII.
Source: Bloomberg Barclays
Timing of HY sales. Insurers that have specific credit concerns and/or an active investment strategy will need to consider the optimal timing of HY sales to try and maximize value and total return; in particular, fallen angels given unique technical factors. As discussed in MetLife Investment Management’s “Fallen Angels in Focus”, the majority of spread movements in deteriorating credit situations occurs while the issuer is rated investment grade, and in the case of the 2020 fallen angels (as of late August 2020), these issuers widened on average by 420 bps relative to other BBB-issuers over the 6 months prior to the downgrade. This material spread widening, combined with unprecedented support by the Federal Reserve, led to a sharper recovery in spreads post downgrade, by on average 125 bps relative to other BB-rated issuers as of mid-April 2020. These dynamics, in addition to the longer-term tightening trend of HY spreads, whether driven by investors’ continued search for yield or in recent periods, Federal Reserve support of credit markets, can provide a guide for potential timing of HY bond sales.
Management of gains / losses. Realized investment losses, whether from impairments or losses on sales, can negatively impact insurance company financial results and position. On a statutory basis, realized credit losses and impairments reduce net income for P&C insurers, while for life insurers, capital could be negatively impacted depending on the individual company’s asset valuation reserve position (AVR). For insurers’ considering whether to sell a troubled HY credit or impair the security (particularly at insurers where impairment policies do not include a brightline test), firms must weigh the risk of downgrade, default and potential decline in market value on a credit by credit basis. Insurers’ can quantify potential losses and compare them to risk budgets that were established based on an individual company’s capital position, financial priorities and risk tolerance.
How insurers should think about new HY investments
Insurance companies that are comfortable with the size of HY portfolios may want to consider future investments in the asset class, either as part of core fixed income allocations or as opportunistic purchases. In fact, insurers may have dry powder available resulting from past portfolio repositioning actions to take advantage of attractive buying opportunities in the asset class. As such, we believe it is prudent for insurers to have a framework, both related to fundamentals and relative value, to evaluate new investments. As seen during the current COVID pandemic, HY spread widening during the peak of the crisis was short lived, thus we believe insurance companies must be nimble to capitalize on these market opportunities.
Fundamental credit analysis. Given the inherent higher risk nature of HY, fundamental credit analysis is critical to help protect against downside risk. In fact, in the current uncertain environment with risks related to COVID, the shape of the economic recovery, oil price volatility and election impacts, deep fundamental credit analysis and security selection is now more important than ever. Certain industries are facing significant stress, some business models remain challenged and many issuers’ credit metrics are deteriorating as they have taken on large amounts of debt to shore up capital/liquidity positions. As such, credit analysts must identify those names that are at risk for downgrades and default and determine whether there is adequate compensation for heightened credit risk. Credit analysts can also help identify the issuers that could thrive in the current environment, including potential future upgrade candidates to investment grade (i.e. rising stars).
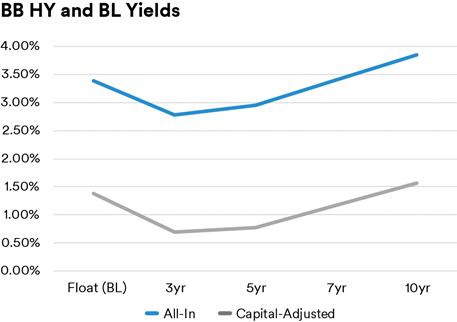
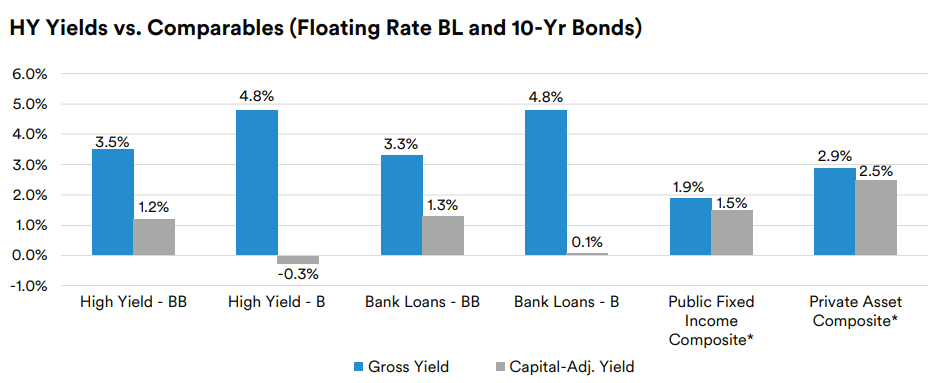
Relative value. In addition to asset sector fundamentals and the macroeconomic outlook, relative value is important input in the strategic and tactical asset allocation process for insurance companies. While absolute spreads and yields are factored in, we believe insurers should evaluate investments on a risk or capital-adjusted basis to determine the relative attractiveness of asset classes. Risk-adjusted yields allow for comparability by asset class by incorporating differences in capital treatment and loss experience, as well as additional spread premiums on private assets. In the current environment, according to MetLife Investment Management, 10-year BB-rated bonds are yielding approximately 3.8% or roughly 1.6% on capital-adjusted basis after deducting default shaves (largely based on Moody’s historical experience) and U.S. RBC risk charges for life insurers (after-tax based on a 400% target RBC ratio less a return on required capital). As shown below, HY and BL capital-adjusted yields can be compared to other public fixed income and private assets to help determine whether investors are being adequately compensated for the risk inherent in these asset classes. While on average private assets may offer more attractive capital-adjusted returns, insurance companies can identify the breakeven yield where they may be indifferent between a new investment in a HY bond / BL or a private asset. For example, at present, according to analysis by MetLife Investment Management, a 10-year BB-rated HY bond yielding approximately 4.8% would provide a capital-adjusted yield roughly equivalent to that of a private asset composite (consisting of 10-year private corporates, commercial mortgage and agricultural loans and private structured debt). While this capital-adjusted yield framework provides a quantitative lens to compare asset classes, we believe insurers should also apply a qualitative overlay to the relative value process. One factor to consider is where we are in the credit cycle and the expectations for future ratings downgrades / defaults, as well as the potential for downside protection that private assets have historically provided in times of stress (for example, in the form of financial covenants). Another factor to consider going forward is the potential changes in NAIC capital factors, which could occur in 2021 or later and may potentially impact the attractiveness of the HY asset class. Additionally, the potential for higher interest rates in the future may make bank loans more attractive due to their floating rate nature, particularly for insurers that have floating rate liabilities.
Evaluating Capital-Adjusted Yields for High Yield and Bank Loans Relative To Other Public / Private Alternatives
Floating rate yields are for HY bank loans Sources: Bloomberg, MetLife Investment Management, as of November 13, 2020
Public Fixed Income composite includes public corporates (NAIC 1 and 2), structured finance (CMBS), emerging market debt (NAIC 1 and 2) Private asset composite includes private corporates (NAIC 1 and 2), commercial mortgage and agricultural loans, private structured debt (NAIC 1 and 2) Sources: Bloomberg, MetLife Investment Management, as of November 13, 2020
Conclusion
Managing the investment portfolio of an insurance company is complex, involving unique objectives and constraints that vary by company and often underlying portfolio. Within the context of a diversified portfolio, high yield corporates and bank loans can be viewed as core asset classes within the strategic asset allocation framework. However, there are many factors to consider—both insurance and market-related—when determining the optimal allocation to HY and evaluating new investments in the asset class. Quoting Macbeth, “come what come may, time and the hour runs through the roughest day”: historically, high yield markets have exhibited contained periods of volatility providing potential attractive investment opportunities for those insurers that have been active and nimble. As such, we believe insurers and their asset managers should have a disciplined investment process around investing in HY, including a focus on deep fundamental credit analysis, risk management and relative value. Further, in our view insurers should work with a seasoned insurance asset manager to develop a customized investment strategy in HY and bank loans that focuses on the higher-quality segment of the market given these uncertain times.
Lara Devieux, CFA, Head of Insurance Advisory & Solutions
Lara Devieux is the Head of Insurance Advisory & Solutions within MetLife Investment Management’s Insurance Asset Management group. In this capacity, she is responsible for MIM’s global insurance advisory offerings and insurance thought leadership, as well as partnering closely with MIM’s Institutional Client Group to build and strengthen insurance client relationships worldwide. Prior to this role, from 2016 through 2019, Devieux served as the Chief of Staff to MetLife’s Chief Investment Officer and President of MetLife Investment Management.
From 2000 through 2016, Devieux was an equity and credit research analyst covering the property & casualty, life and health insurance sectors. She has experience as both a buy side and sell-side insurance analyst, including at MetLife Investment Management, Goldman Sachs, hedge fund Fontana Capital, Wells Fargo (formerly Wachovia Securities) and ABN Amro.
Devieux received a BS from The Wharton School at the University of Pennsylvania. She holds the Chartered Financial Analyst (CFA) designation, and is a member of the CFA Institute and New York Society of Security Analysts.
About MetLife Investment Management
MetLife Investment Management (MIM),1 MetLife, Inc.’s (MetLife’s) institutional investment management business, serves institutional investors by combining a client-centric approach with deep and long-established asset class expertise. Focused on managing Public Fixed Income, Private Capital and Real Estate assets, we aim to deliver strong, risk-adjusted returns by building tailored portfolio solutions. We listen first, strategize second, and collaborate constantly as we strive to meet clients’ long-term investment objectives. Leveraging the broader resources and 150-year history of the MetLife enterprise helps provide us with deep expertise in navigating ever changing markets. We are institutional, but far from typical.
Disclaimer This material is intended solely for Institutional Investors, Qualified Investors and Professional Investors. This analysis is not intended for distribution with Retail Investors. This document has been prepared by MetLife Investment Management (“MIM”)1 solely for informational purposes and does not constitute a recommendation regarding any investments or the provision of any investment advice, or constitute or form part of any advertisement of, offer for sale or subscription of, solicitation or invitation of any offer or recommendation to purchase or subscribe for any securities or investment advisory services. The views expressed herein are solely those of MIM and do not necessarily reflect, nor are they necessarily consistent with, the views held by, or the forecasts utilized by, the entities within the MetLife enterprise that provide insurance products, annuities and employee benefit programs. The information and opinions presented or contained in this document are provided as of the date it was written. It should be understood that subsequent developments may materially affect the information contained in this document, which none of MIM, its affiliates, advisors or representatives are under an obligation to update, revise or affirm. It is not MIM’s intention to provide, and you may not rely on this document as providing, a recommendation with respect to any particular investment strategy or investment. Affiliates of MIM may perform services for, solicit business from, hold long or short positions in, or otherwise be interested in the investments (including derivatives) of any company mentioned herein. This document may contain forward-looking statements, as well as predictions, projections and forecasts of the economy or economic trends of the markets, which are not necessarily indicative of the future. Any or all forward-looking statements, as well as those included in any other material discussed at the presentation, may turn out to be wrong. All investments involve risks including the potential for loss of principle and past performance does not guarantee similar future results. Property is a specialist sector that may be less liquid and produce more volatile performance than an investment in other investment sectors. The value of capital and income will fluctuate as property values and rental income rise and fall. The valuation of property is generally a matter of the valuers’ opinion rather than fact. The amount raised when a property is sold may be less than the valuation. Furthermore, certain investments in mortgages, real estate or non-publicly traded securities and private debt instruments have a limited number of potential purchasers and sellers. This factor may have the effect of limiting the availability of these investments for purchase and may also limit the ability to sell such investments at their fair market value in response to changes in the economy or the financial markets In the U.S. this document is communicated by MetLife Investment Management, LLC (MIM, LLC), a U.S. Securities Exchange Commission registered investment adviser. MIM, LLC is a subsidiary of MetLife, Inc. and part of MetLife Investment Management. Registration with the SEC does not imply a certain level of skill or that the SEC has endorsed the investment advisor. This document is being distributed by MetLife Investment Management Limited (“MIML”), authorised and regulated by the UK Financial Conduct Authority (FCA reference number 623761), registered address 1 Angel Lane, 8th Floor, London, EC4R 3AB, United Kingdom. This document is approved by MIML as a financial promotion for distribution in the UK. This document is only intended for, and may only be distributed to, investors in the UK and EEA who qualify as a “professional client” as defined under the Markets in Financial Instruments Directive (2014/65/EU), as implemented in the relevant EEA jurisdiction, and the retained EU law version of the same in the UK. For investors in the Middle East: This document is directed at and intended for institutional investors (as such term is defined in the various jurisdictions) only. The recipient of this document acknowledges that (1) no regulator or governmental authority in the Gulf Cooperation Council (“GCC”) or the Middle East has reviewed or approved this document or the substance contained within it, (2) this document is not for general circulation in the GCC or the Middle East and is provided on a confidential basis to the addressee only, (3) MetLife Investment Management is not licensed or regulated by any regulatory or governmental authority in the Middle East or the GCC, and (4) this document does not constitute or form part of any investment advice or solicitation of investment products in the GCC or Middle East or in any jurisdiction in which the provision of investment advice or any solicitation would be unlawful under the securities laws of such jurisdiction (and this document is therefore not construed as such). For investors in Japan: This document is being distributed by MetLife Asset Management Corp. (Japan) (“MAM”), 1-3 Kioicho, Chiyoda-ku, Tokyo 102-0094, Tokyo Garden Terrace KioiCho Kioi Tower 25F, a registered Financial Instruments Business Operator (“FIBO”) under the registration entry Director General of the Kanto Local Finance Bureau (FIBO) No. 2414. For Investors in Hong Kong S.A.R.: This document is being issued by MetLife Investments Asia Limited (“MIAL”), a part of MIM, and it has not been reviewed by the Securities and Futures Commission of Hong Kong (“SFC”). MIAL is licensed by the Securities and Futures Commission for Type 1 (dealing in securities), Type 4 (advising on securities) and Type 9 (asset management) regulated activities. For investors in Australia: This information is distributed by MIM LLC and is intended for “wholesale clients” as defined in section 761G of the Corporations Act 2001 (Cth) (the Act). MIM LLC exempt from the requirement to hold an Australian financial services license under the Act in respect of the financial services it provides to Australian clients. MIM LLC is regulated by the SEC under US law, which is different from Australian law. MIMEL: For investors in the EEA, this document is being distributed by MetLife Investment Management Europe Limited (“MIMEL”), authorised and regulated by the Central Bank of Ireland (registered number: C451684), registered address 20 on Hatch, Lower Hatch Street, Dublin 2, Ireland. This document is approved by MIMEL as marketing communications for the purposes of the EU Directive 2014/65/EU on markets in financial instruments (“MiFID II”). Where MIMEL does not have an applicable cross-border licence, this document is only intended for, and may only be distributed on request to, investors in the EEA who qualify as a “professional client” as defined under MiFID II, as implemented in the relevant EEA jurisdiction. The investment strategies described herein are directly managed by delegate investment manager affiliates of MIMEL. Unless otherwise stated, none of the authors of this article, interviewees or referenced individuals are directly contracted with MIMEL or are regulated in Ireland. Unless otherwise stated, any industry awards referenced herein relate to the awards of affiliates of MIMEL and not to awards of MIMEL. 1 As of March 31, 2023, subsidiaries of MetLife, Inc. that provide investment management services to MetLife’s general account, separate accounts and/or unaffiliated/third party investors include Metropolitan Life Insurance Company, MetLife Investment Management, LLC, MetLife Investment Management Limited, MetLife Investments Limited, MetLife Investments Asia Limited, MetLife Latin America Asesorias e Inversiones Limitada, MetLife Asset Management Corp. (Japan), MIM I LLC, MetLife Investment Management Europe Limited, Affirmative Investment Management Partners Limited and Raven Capital Management LLC