Introduction
Commercial real estate was once viewed as a niche investment sector, but after several decades of evolution, it has emerged as a core asset class for many institutional investors. In recent decades, liquidity has improved, transparency has risen, and core real estate’s investor base has broadened substantially. Joint ventures, private funds, and public and private real estate companies draw capital from sources both foreign and domestic. These vehicles and their investors play an important role in today’s real estate capital markets. Core real estate equity, with returns composed of both income and appreciation, can offer a mix of benefits that are difficult to replicate with other asset classes. While opportunistic and value-add equity investments can be a source of yield for investors, core real estate equity is a foundational investment for all investors looking to allocate to real estate. As we detail in the following paper, the sector has produced attractive total returns historically, and its risk-adjusted returns are among the highest of any major asset class. It can act as a strong portfolio diversifier, exhibiting relatively low historical correlation with other sectors, and can also help act as a hedge against inflation. The sector’s challenges lie primarily in the expertise necessary to source and execute individual transactions and manage global portfolios. For real estate investment managers with the expertise to address these challenges with scale, resources, and experience, we believe the rewards of an allocation to core real estate equity can meaningfully outweigh the risks. Read more from MetLife
Historical Performance
Since 2000, core real estate equity has produced attractive total returns. Unlevered gross returns during this period averaged 9.2%,1 despite the economy enduring recessions induced by the asset bubbles of 2001 and 2008, and the pandemic that began in 2020. (Exhibit 1). The sector’s historical performance is driven by its income component. Since 2000, approximately 66% of the sector’s total returns were derived from income. The remaining 34% came from appreciation, which was itself partially driven by expectations of future income growth. In addition to historically providing attractive absolute returns, the sector’s flow of income also contributes to attractive risk-adjusted returns.
Exhibit 1 | Core Real Estate Equity Total Returns
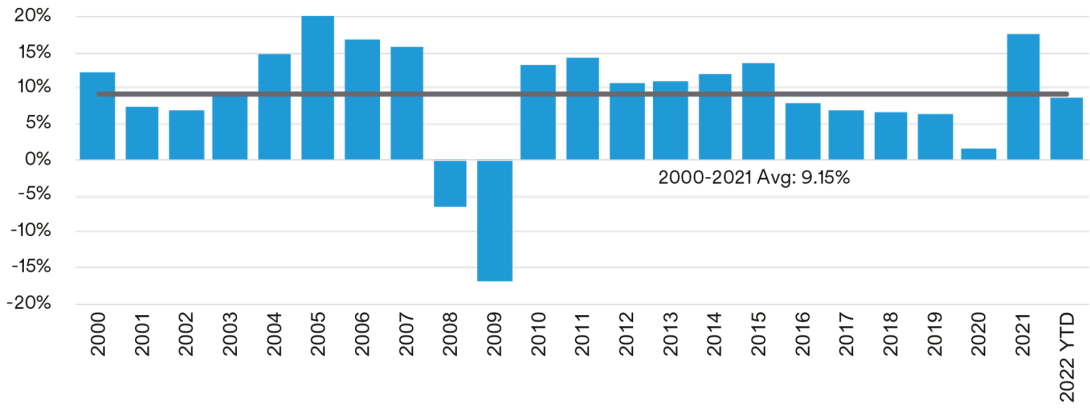
Source: MIM, NCREIF. Total returns are represented by the NCREIF NPI index. 2022 YTD represents returns through Q2. While more volatile than bonds when measured by standard deviation, core real estate equity has exhibited stronger total returns and experienced fewer years of negative returns. Investors prefer asset classes with low risk, as measured by standard deviations, and high returns, but they must usually accept a trade-off between these characteristics. Debt investors can boast lower volatility and fewer years of negative returns, but at the cost of lower total returns during positive years. Additionally, core real estate equity does not have a maturity and can be held in perpetuity if so desired, eliminating reinvestment risk that is associated with assets that mature. We believe core real estate equity’s combination of historically strong total returns and moderate volatility allow it to effectively straddle the low and moderate risk buckets in a multi asset class portfolio. We believe its greatest contribution to such a portfolio, however, may lie in its diversification benefits.
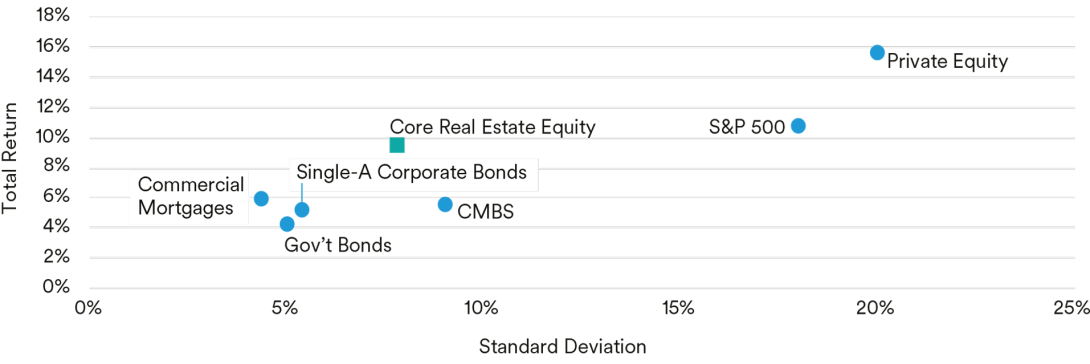
Exhibit 2 | Annual Total Returns and Standard Deviation by Major Asset Class2
Source: See endnote 2 for data sources. Calculations are made from 1998-2021Q4.
Benefits of Real Estate in a Multi Asset Class Portfolio
In addition to historically attractive, absolute and risk-adjusted returns, core real estate equity can act as a strong diversifier in a multi asset class portfolio as well as an effective hedge against inflation. Over the last two decades, the sector has exhibited relatively low correlations with direct commercial mortgages, CMBS, stocks, bonds, and private equity investments (Exhibit 3). Its average correlation with these sectors is only 0.07, and its strongest correlation with any single asset class measures only a 0.33. Academic textbooks indicate that lower-correlated assets in a diversified, long-term investment portfolio can increase portfolio efficiency and may generate higher total returns, while decreasing overall risk, because each asset class may react differently to changing market conditions.
Exhibit 3 | Correlations Between Major Asset Classes2,3
| | Core Equity Real Estate | Commercial Mortgages | CMBS | Stocks | Single-A Corporate Bonds | Gov't Bonds | Private Equity |
|---|
| Core Equity Real Estate | 1.00 | 0.07 | 0.07 | 0.17 | -0.19 | -0.04 | 0.33 |
|---|
| Commercial Mortgages | | 1.00 | 0.73 | -0.10 | 0.42 | 0.38 | -0.03 |
|---|
| Investment Grade CMBS | | | 1.00 | 0.22 | 0.59 | 0.14 | 0.13 |
|---|
| Stocks | | | | 1.00 | 0.07 | -0.60 | 0.67 |
|---|
| Single-A Corporate Bonds | | | | | 1.00 | 0.49 | -0.07 |
|---|
| Government Bonds | | | | | | 1.00 | -0.47 |
|---|
| Private Equity | | | | | | | 1.00 |
|---|
Source: See endnote 2 for data sources. Calculations are made from 1998-2021Q4. Between 1990 and 2021, prices have been volatile year to year, but overall commercial real estate prices increased at roughly the average annual rate of inflation, based on property value changes as tracked by NCREIF. Similarly, same-store net operating income growth approximately matched the rate of inflation. Real estate, therefore, can potentially provide an effective hedge against inflation risks in a portfolio. The cost of construction plays a pivotal role in commercial real estate’s relationship to inflation (Exhibit 4). One common real estate valuation methodology is replacement cost. The cost to rebuild an existing building can be viewed as an estimate of current value. As the cost of land, labor, and materials rise with inflation, so does replacement cost. If property price appreciation exceeds inflation, then the premium between current market values and the cost to build will cause construction to increase. If the premium between current market values and the cost to build is low, or negative, then new construction will slow or stop. Thus, current real estate values can adjust according to construction costs, which impact supply and demand, and leads to commercial real estate values tracking replacement cost over time.
Exhibit 4 | Construction Costs Versus Real Estate Equity Price Returns
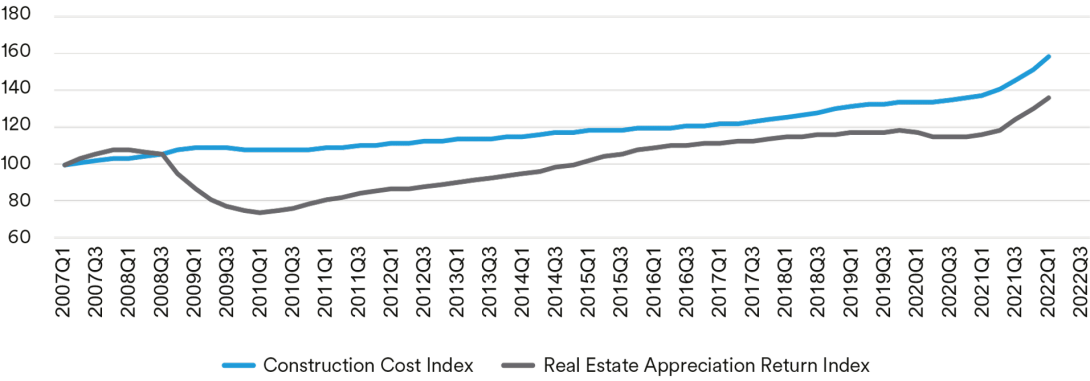
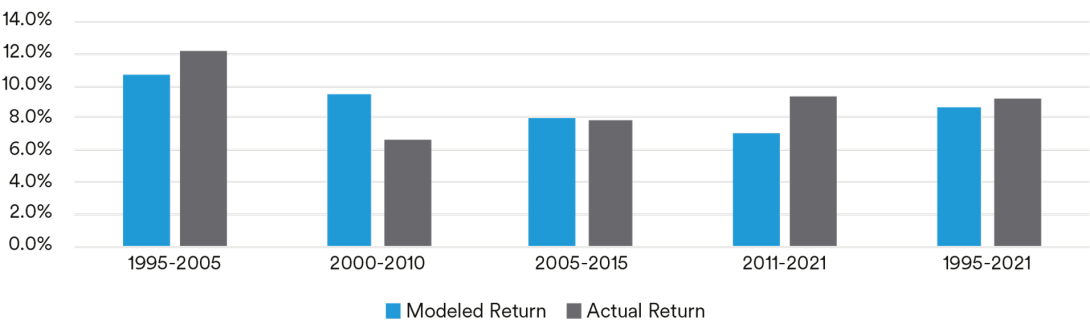
Source: CBRE, NCREIF. Real Estate Appreciation Return Index based on NCREIF NPI appreciation returns indexed over time. Additionally, commercial real estate can help as a hedge against inflation due to the frequent repricing of commercial real estate leases. Commercial real estate assets are typically occupied by multiple tenants who sign leases of varying lengths. As these leases expire, rental rates as well as reimbursements of operating expenses in triple net leases are adjusted to reflect current market rates, which include the effects of inflation. The relationship between commercial real estate values and inflation is further illustrated in Exhibit 5. In this chart, we show how commercial real estate performance can be modeled as a function of inflation over time. Specifically, returns modeled3 as cap rates plus the rate of inflation, were generally in line with actual returns, over the past 25 years. Additionally, Exhibit 6 ranks the ten highest years of inflation over the past 45 years. It is evident that commercial real estate outperforms during inflationary periods, averaging a 13% annual total return during times of high inflation. For investors that think inflation will be elevated going forward, adding core real estate exposure may be warranted.
Exhibit 5 | Actual Returns vs. Modeled Returns (Inflation + Cap Rates)
Source: MIM
Exhibit 6 | Real Estate Returns during Inflationary Environment
| Year | Income Return | Capital Return | NCREIF NPI Total Return | CPI |
|---|
| 1979 | 9.0% | 10.8% | 20.5% | 13.3% |
|---|
| 1980 | 8.4% | 9.1% | 18.1% | 12.4% |
|---|
| 1978 | 8.8% | 6.8% | 16.1% | 9.0% |
|---|
| 1981 | 8.1% | 8.1% | 16.6% | 8.9% |
|---|
| 2021 | 4.2% | 13.0% | 17.7% | 7.0% |
|---|
| 1990 | 6.6% | -4.1% | 2.3% | 6.2% |
|---|
| 1989 | 6.6% | 1.1% | 7.8% | 4.6% |
|---|
| 1987 | 7.3% | 0.7% | 8.0% | 4.4% |
|---|
| 1988 | 7.0% | 2.5% | 9.6% | 4.4% |
|---|
| 2007 | 5.6% | 9.9% | 15.8% | 4.1% |
|---|
| Top 10 years of inflation | 7.2% | 5.8% | 13.3% | 7.4% |
|---|
| Average from 1978-2021 | 7.0% | 2.3% | 9.4% | 3.5% |
|---|
Source: MIM, NCREIF. In summary, we believe commercial real estate can be an attractive option for investors seeking to diversify an investment portfolio or to hedge from rising inflation.
Diversification of a Real Estate Portfolio
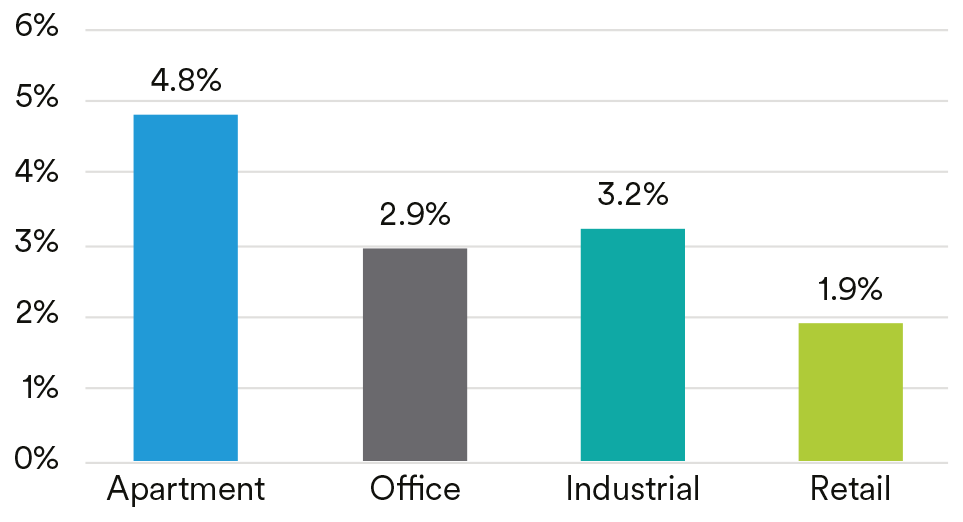
In addition to CRE providing diversification of a multi asset class investment portfolio, it is also possible to construct highly diverse portfolios within the real estate sector itself. The four major property types that make up most commercial real estate portfolios are each driven by different economic and demographic factors. The office sector is heavily driven by job growth in officeusing employment sectors. The apartment sector is driven by a combination of employment and demographic trends. The retail sector is fueled by consumer spending and by retail tenants and formats adapting to changes in consumer behavior. The industrial sector today is being driven by consumer spending, population distribution, and consumer demand for faster e-commerce fulfillment. Depending on the outlook for these and other drivers, the income growth each property type is able to achieve in a given period can vary significantly (See Exhibit 7). During the past 20 years, the apartment and industrial sectors have been the standouts. Apartment investors have benefited from NIMBYism† that has slowed new housing developments. Industrial investors have benefited from structural changes due to the rise of e-commerce. These structural changes have also reduced income from traditional brick-and-mortar retail properties, which saw steep declines during the pandemic of 2020.
Exhibit 7 | NOI Growth by Property Type (2000 - 2021)
Source: MIM, NCREIF
Exhibit 8 | Market Classifications
| Lifestyle | These markets offer residents fair weather and a diverse array of job opportunities. Example markets include; Miami and Los Angeles. |
| Energy | Markets with economies that are significantly influenced by the energy sector. Example markets include; Houston and Denver. |
| Government | Markets driven by federal spending and a high level of government employment. Example markets include; Washington DC and San Antonio. |
| Stability | Markets that exhibit relatively slow population growth balanced against historically stable labor markets. Example markets include; Chicago and Philadelphia. |
| Technology | Located across the United States, these markets are heavily driven by job growth in the technology sector. Example markets include; San Francisco, San Jose, Boston, Seattle, Baltimore, Austin and Portland. |
| Demographics | Economically diverse markets with high affordability and strong population growth, particularly among those aged 30 - 54. Example markets include; Atlanta, Charlotte, Nashville, Phoenix, and Dallas. |
As exhibits 8 and 9 illustrate, commercial real estate can allow investors to diversify across property types as well as across the various drivers of the U.S. economy. Exhibit 8 describes the various market types analyzed and identifies the representative markets included in the correlation estimates.
Exhibit 9 | Income Growth Correlation by Market Driver
| Year | Income Return | Capital Return | NCREIF NPI Total Return | CPI |
|---|
| 1979 | 9.0% | 10.8% | 20.5% | 13.3% |
|---|
| 1980 | 8.4% | 9.1% | 18.1% | 12.4% |
|---|
| 1978 | 8.8% | 6.8% | 16.1% | 9.0% |
|---|
| 1981 | 8.1% | 8.1% | 16.6% | 8.9% |
|---|
| 2021 | 4.2% | 13.0% | 17.7% | 7.0% |
|---|
| 1990 | 6.6% | -4.1% | 2.3% | 6.2% |
|---|
| 1989 | 6.6% | 1.1% | 7.8% | 4.6% |
|---|
| 1987 | 7.3% | 0.7% | 8.0% | 4.4% |
|---|
| 1988 | 7.0% | 2.5% | 9.6% | 4.4% |
|---|
| 2007 | 5.6% | 9.9% | 15.8% | 4.1% |
|---|
| Top 10 years of inflation | 7.2% | 5.8% | 13.3% | 7.4% |
|---|
| Average from 1978-2021 | 7.0% | 2.3% | 9.4% | 3.5% |
|---|
Sources: MIM, NCREIF Apartment NOI Growth, 2001-2021 Lastly, the commercial real estate sector’s potential diversification benefits are often supplemented by tenants in a wide array of industries. As a result, asset-level incomes are often resilient, and high levels of vacancy in properties with diversified and stable tenancy are rare, even in times of slow economic growth. In summary, core real estate can be a highly attractive option for investors seeking to diversify their portfolios by asset class, as well as those seeking diversification within an asset class. In addition to diversification, commercial real estate can also offer investors options for more tax-efficient investment returns.
Tax Advantages
For institutional investors that own real estate assets directly or via a separately managed account, the tax advantages can be significant. Direct holders of real estate assets can reduce taxable income by depreciating the cost of existing improvements and ongoing capital expenditures. For office, retail, and industrial assets, this depreciation can be taken on a 39-year basis; for multifamily assets, it can be taken on a 27.5-year basis; and for certain building systems, it can be assessed at an even faster rate.4 At the standard corporate tax rate of 21%, a core multifamily asset purchased at a cap rate of 4.0% could be expected to produce a pre-tax yield from net operating income (NOI yield) of 4.2% in the year following acquisition (assuming a 3% annual growth in pretax NOI). However, the depreciation deduction reduces the tax liability and increases the yield of the investment. We estimate the NOI yield, adjusted for the tax benefit of depreciation, would be 4.7%, rather than the 4.2% level achieved without the tax benefit.5 For this example, one year of benefit is estimated by multiplying a year of depreciation times the corporate tax rate of 21%, then adding the result to NOI to imply an “adjusted” NOI yield. (see Exhibit 10). The adjusted NOI yield, as well as the investment’s total rate of return (including asset value appreciation), has the potential to rise substantially over time. As depreciation deductions are taken, the asset’s book value will decline. Also, as the investment’s leases are renewed, or its rents contractually increased, net operating income can rise. The result is that by year five, the adjusted NOI yield on book value could be expected grow to 5.8% It should be noted that these returns are calculated on a nominal basis and, as a result, do not reflect the additional benefits depreciation offers via deferred taxation. Deferred taxes on net operating income can be reinvested to seek additional income, and long-term inflation can help reduce the impact of those taxes when depreciation is recaptured in the future. As such, the impact on portfolio-level returns may be even greater than our asset-level income returns suggest. The potential tax benefits of core real estate also extend to the point of sale. In addition to income returns, investors may also benefit from appreciation driven by net operating income growth and changes in capital market conditions. For insurance companies that are holding real estate assets at book value, unrecognized gains can grow to be substantial over time. The recognition of these gains through disposition can potentially be used to offset losses elsewhere in the portfolio, helping to bring greater stability to portfolio-level returns during volatile periods. If the aforementioned asset grew at a 3% rate for the next five years, the asset would offer not only an income return on book value of 5.8% in year five, it would likely also carry an unrealized gain equal to 15.9% of its original purchase price (see Exhibit 10). A potential side benefit of this unrealized gain is the ability to cushion potential declines in market value during the holding period. If real estate assets are held directly, and thus at book value, the decline in market value required to result in an impairment would need to be in excess of 15.9%, after year five. As a result, directly held real estate equity generally exhibits lower statutory capital volatility than equity investments in other asset classes. Additionally, a 1031 “like-kind” exchange is a commonly used section in the U.S. tax code that encourages active reinvestment by giving investors the ability to indefinitely defer taxation on a sale as long as the proceeds are exchanged for a like-kind property and subject to other provisions. This tax break grants real estate investors the unique ability to reposition assets without immediately incurring tax liabilities.
Exhibit 9 | Income Growth Correlation by Market Driver
| Year | 0 | 1 | 2 | 3 | 4 | 5 |
|---|
| Asset Market Value | $100.0 | $103.0 | $106.1 | $109.3 | $112.6 | $115.9 |
|---|
| Prior Year-End Book Value | $100.0 | $100.0 | $97.5 | $94.9 | $92.4 | $89.8 |
|---|
| Statutory Depreciation | | -$2.5 | -$2.5 | -$2.5 | -$2.5 | -$2.5 |
|---|
| Year-End Book Value | $100.0 | $97.5 | | | | |
|---|