In the late 1960s, it became clear, especially to American endowments, that investing in low-risk portfolios that were tilted toward fixed-income securities was a suboptimal strategy. Though this approach made it easy to set a fixed spending rate, real returns were so low that some endowments saw their capital bases shrink. Since then, many endowments have perfected more sophisticated strategies that often rely upon private markets to outpace inflation and preserve capital.
The issues that confronted US endowments were not as problematic for insurers at the time; yield compression over the past 40 years allowed insurance companies to invest conservatively and still remain competitive. As many other investors have discovered, today’s market dynamics are forcing insurance companies to consider incorporating private markets to boost returns. While it may not be sensible for insurers to invest in alternative asset classes as heavily as endowments or sovereign wealth development funds, many portfolio managers are looking outside of traditional asset classes to find sufficient returns.
In addition to preferring the straightforward, low-cost nature of fixed-income investing, insurance companies historically avoided private markets, which they perceived to be inefficient. With few, if any, visible transactions, the difficulty of accessing data that were robust and trustworthy made it hard to judge and model—let alone implement—alternative investments and to capture the risk premia they offer. Today, however, there is a broader array of data available to model these asset classes.
These data are allowing more portfolio and risk managers to model investment duration, implement asset-liability management (ALM) techniques, and develop risk management tools.
Beyond the challenges of modeling duration and risk characteristics, regulatory hurdles have affected how insurers view private markets. The incongruous patchwork of international rules, and the difficulties that some regulators have had promulgating new guidelines in a timely manner, have led some insurers to avoid alternative asset classes altogether.
Our experience working with insurers leads us to conclude that with the right framework they can benefit from an increased allocation toward alternative investments. Although this paper serves only as a primer, we attempt to quantify these benefits. As a baseline, we reference a traditional insurance portfolio for a client we recently worked with (the “Client Portfolio”). The expected returns of that portfolio when shifting 10% of its existing assets into specific alternative investment strategies (the “Enhanced Portfolio”) are higher than those for the Client Portfolio by 60 basis points (20%), with expected volatility lower by 20 basis points (nearly 5%).
Historical Allocations
Insurance companies have allocated significantly less toward alternative investments than have other institutional investors. Although investment preferences vary from country to country and across the insurance business lines, in general, private markets represent less than 10% of most companies’ portfolios. A considerable part of this allocation is often in direct real estate.
USA
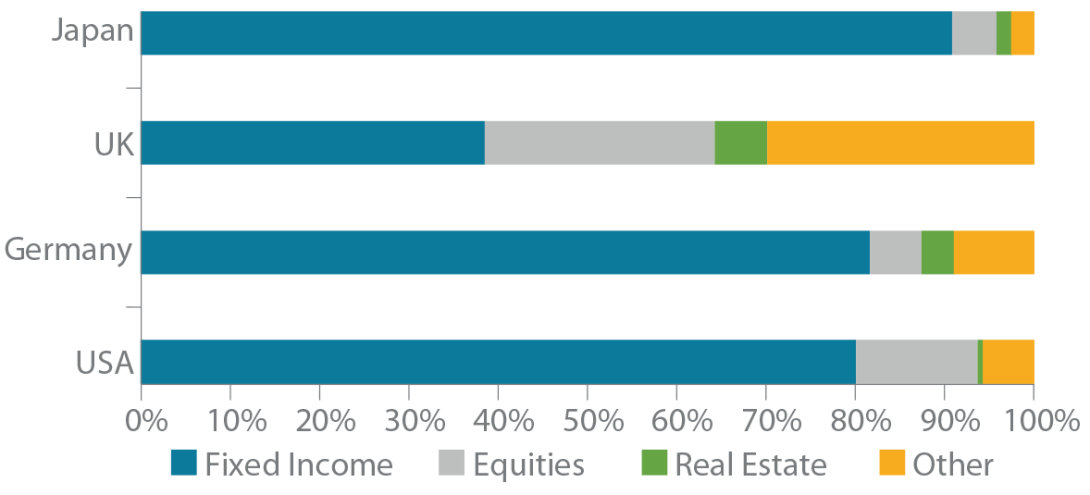
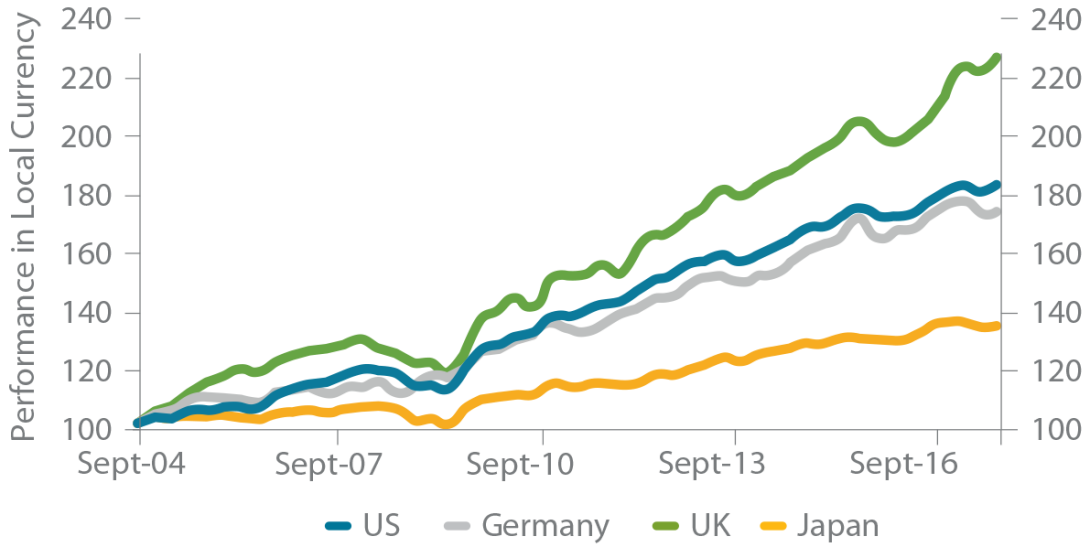
With more than US$6 trillion of assets under management, American insurance companies make up one of the largest investor segments in the world.1 In aggregate, the 4,500 or so companies in this group invest about 80% of their assets in fixed-income-related instruments, 14% in equities and slightly more than 6% in alternative and private market investments (including real estate) (Figure 1). This portfolio would have generated a gross annual return of 4–6% over the last 12 years, in US dollar terms (Figure 2).2
Across the various types of insurance companies, the asset allocation varies significantly. Life insurance companies, for example, which have a market share of 65%, allocate about 4% to equities, whereas property and casualty (P&C) insurers, which have a market share of 30%, allocate significantly more to equities (some of them 30% and more).3
FIGURE 1 | PORTFOLIO COMPOSITION BY COUNTRY
Source: StepStone, NAIC, British Insurance Association, GDV.
Note: Fixed Income includes Corporate, Gov-related, Mortgages, Structured Credit & other fixed income. Other includes Alternative Investments and, in the UK, Unit Trusts.
EUROPE
With slightly more assets under management than its American counterpart (US$6.2 trillion), Europe’s insurance industry also employs a more varied approach to asset allocation. While life insurance companies generally invest more conservatively than P&C insurers, similarly to the US and the rest of the world, large differences exist in Europe. German insurers, for example, are often more defensive, investing about 6% in equities. By comparison, British companies tend to be more opportunistic, allocating about 26% to equities. With current allocations, the average European insurer (life and non-life) would have earned an annual return of 4.5–6.5% in euro terms over the last 12 years (Figure 2).4
FIGURE 2 | TOTAL INSURANCE INDUSTRY PERFORMANCE BY COUNTRY
Source: StepStone.
ASIA
Insurance companies in Asia have nearly US$5 trillion in assets under management.5 Most of these assets are invested in domestic bonds. Equity positions, as in Europe, vary markedly from country to country, ranging from 25% in Singapore to about 5% in Taiwan and Japan.6 Over the last couple of years insurers in some markets have begun investing beyond their borders. For example, Taiwanese companies have gradually increased their exposure to foreign asset classes from 35% in 2008 to 55% in 2015. A similar move was observable in Japan, where gross annual returns have also increased.
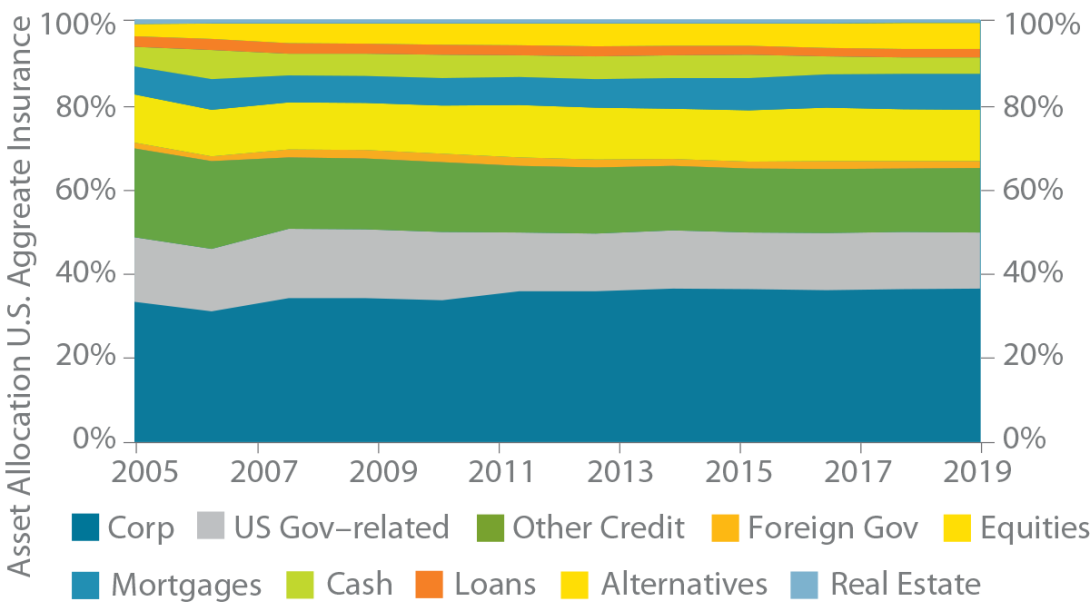
While the market environment has changed significantly over the past decade, insurance companies’ asset mix has remained somewhat static (Figure 3). Although the data that underlie this figure are based on American companies, the same general conclusion holds for insurers in other parts of the world.
Historically, the lack of exposure to alternative risk premia was easy to justify. The yield compression in fixed-income securities over the past 37 years created capital gains for insurance companies that obviated the need for non-traditional yield enhancements. In the US, Treasury yields have fallen by nearly 1,200 basis points since 1981. Over the same period US corporate bonds have generated gross annual returns of approximately 8.6%. Other developed markets look similar: since 1989 the 10-year Bund yield has fallen more than 700 basis points to -0.3%, and 30-year Japanese bonds are yielding below 1%.
FIGURE 3 | AMERICAN INSURERS' ASSET ALLOCATION
Source: StepStone & NAIC.
YIELD COMPRESSION
Going forward, the traditional asset mix is unlikely to generate the 4–6.5% annual returns that international insurers have grown accustomed to. For example, between 2004 and 2017, the Client Portfolio would have generated a 5.2% annual return, in US dollar terms; narrowing yields are responsible for two-thirds of this return (Figure 4). In today’s environment we would expect this same portfolio to earn about 3.0% per year in US dollar terms.7
The yield compression in fixed-income markets allowed insurance companies to remain competitive by building asset portfolios with relatively low volatility. But now that returns from fixed-income investments are at an all-time low, and with underwriting markets growing more competitive, insurers see their ability to generate higher returns on the asset side of the balance sheet as a competitive advantage.
Read section: "Case Study: European Life Insurer" here
FIGURE 4 | DECOMPOSITION OF RETURNS OF CLIENT PORTFOLIO (2004-2021)

Source: StepStone & NAIC.
Why Private Markets?
As the benefits of alternative investments have become increasingly accepted, family offices, endowments, pension funds, and other institutional investors have gradually increased their allocations to private markets. Many insurance companies have already taken note: a 2020 survey by Goldman Sachs Asset Management reported that insurers planned to increase their allocations toward private markets by as much as 28%.10 We believe there are several factors driving this trend.
ENHANCED RETURN POTENTIAL
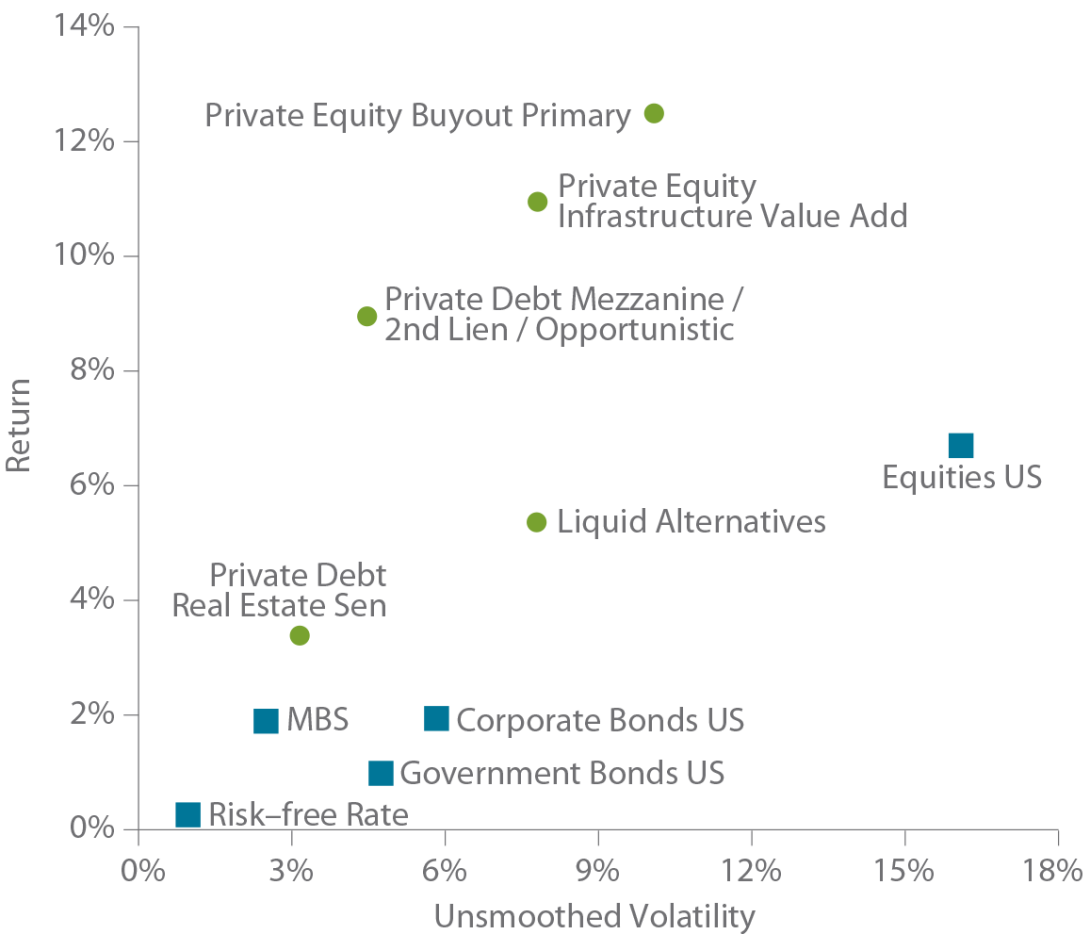
Private markets are typically more illiquid than public markets. In exchange for this, investors expect to be compensated through higher returns. As seen in Figure 8, the benefits of the illiquidity and asset class specific premia are more than theoretical: between 2005 and 2017, private markets generated higher returns than their public counterparts.
FIGURE 8 | PUBLIC VS PRIVATE MARKET PERFORMANCE (2005-2021)
Source: StepStone.
Note: Benchmarks defined in glossary.
MATCHING LONG-TERM LIABILITIES
Insurance companies seek to account for all possible outcomes when managing assets and cash flows. Consequently, their assets must be sufficiently large to meet expected and unanticipated claims, and they must be able to deal with any adverse effects resulting from asset liability mismatches. This implies that insurers are required to maintain higher capital reserves when making riskier investments. As a result, the capital required to protect policyholders must be part of the investment calculus.
ALM is a key component of the investment decision-making process. A dynamic liability-driven investment process is often implemented to further support the fundamental idea of the ALM concept. The investment management starts by determining the minimum-risk investment position. This allows the insurer’s liabilities to be represented by common financial instruments, primarily government bonds with matching durations. Consequently, the minimum-risk portfolio ensures the market values of assets and liabilities move in parallel if interest rates change.
Based on this framework, insurance companies are natural buyers of assets with longer investment horizons. This is especially true for life insurance companies. Private market investments are therefore well positioned to meet the asset liability requirements while capturing the inherent illiquidity and asset class specific premia. In addition, private markets may reduce opportunity costs when reinvesting available cash into public market instruments.
Because accessing data on private markets remains a challenge, many investors continue to rely on qualitative inputs. Those who can obtain private data sets may be able to develop more sustainable strategic asset allocation (SAA) and ALM models.
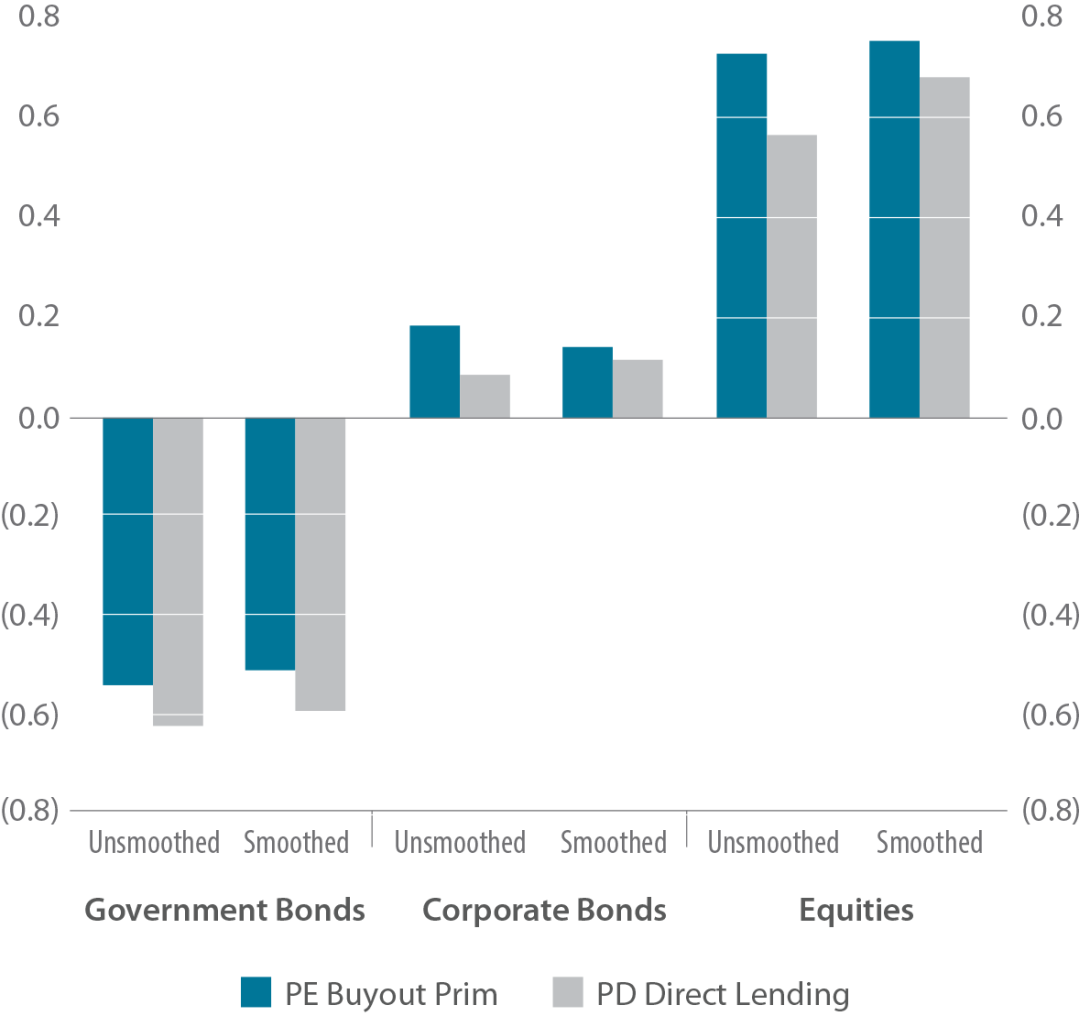
GREATER PORTFOLIO DIVERSIFICATION
Not only are return expectations higher for private markets than their public counterparts, but the fact that some asset classes are uncorrelated with traditional investments can diversify systemic risk, generating a higher expected return for any given level of volatility. These diversification benefits are partly the result of a phenomenon known as smoothing.11 As seen in Figure 9, smoothing has very little impact on the correlation between public and private market volatility. For example, leveraged buyouts and direct lending strategies are negatively correlated to government bonds, have a low correlation to corporate bonds, and a limited, albeit higher, positive correlation to equities.
FIGURE 9 | DIVERSIFICATION IS NOT DUE TO STALE PRICING
Source: StepStone, Burgiss, 2017.
SOLVENCY REQUIREMENTS
Although all solvency rules require insurance companies to maintain an adequate margin of safety and meet basic reporting requirements, the rules vary from one jurisdiction to another. For example, the US relies on the static, risk-based capital (RBC) approach set forth by the National Association of Insurance Commissioners (NAIC). The EU’s Solvency II guidelines, on the other hand, use a dynamic, principle-based approach. Asian countries, such as Japan and South Korea, closely follow the US’s RBC regime, but are poised to adopt elements of Solvency II. Switzerland’s Solvency Test has its own subtleties.
While each set of rules treats alternative investments differently, most regimes do not require insurance companies that invest in private markets to hold any more capital than investments in traditional asset classes would require—especially if these companies can provide position-level look-throughs.
Solvency II
Solvency II stipulates that solvency capital requirements (SCR) can be calculated based on a standard formula or a proprietary model.12 Although using Solvency II’s standard formula provides a robust accounting of risk, companies that use a proprietary model are often able to reduce their SCR. Because proprietary models are intrinsically more considerate of each company’s idiosyncrasies, it is often appropriate to use less conservative risk buffers than the standard model otherwise applies.
Position look-throughs allow insurers to apply an SCR factor that reflects the risk of the underlying investment more fairly even under the standard formula. For example, suppose an insurance company was invested in private equity real estate. By default, Solvency II would classify such a holding as private equity and apply an SCR factor of 49% (+/- a 10% adjustment factor). A look-through, however, would allow the insurer to more accurately classify the holding and use the 25% SCR factor that applies to real estate. Full position look-throughs using separately managed accounts (SMAs) are useful for insurers seeking to minimize their SCR. The SCR factor for corporate direct lending, for example, can be as low as 10%, and in the mid-teens for qualified infrastructure debt.
NAIC Risk-based Capital
The NAIC uses a series of schedules to define the RBC requirements associated with each asset class. As seen in Table 2, when comparing the RBC charges for traditional investments to those for alternatives, it is clear that the NAIC neither encourages nor discourages private markets in general.13 In our opinion, this neutrality appears to be particularly supportive of private markets when you consider that the NAIC does not levy an additional liquidity charge beyond what is usually included in a company’s liquidity rating.
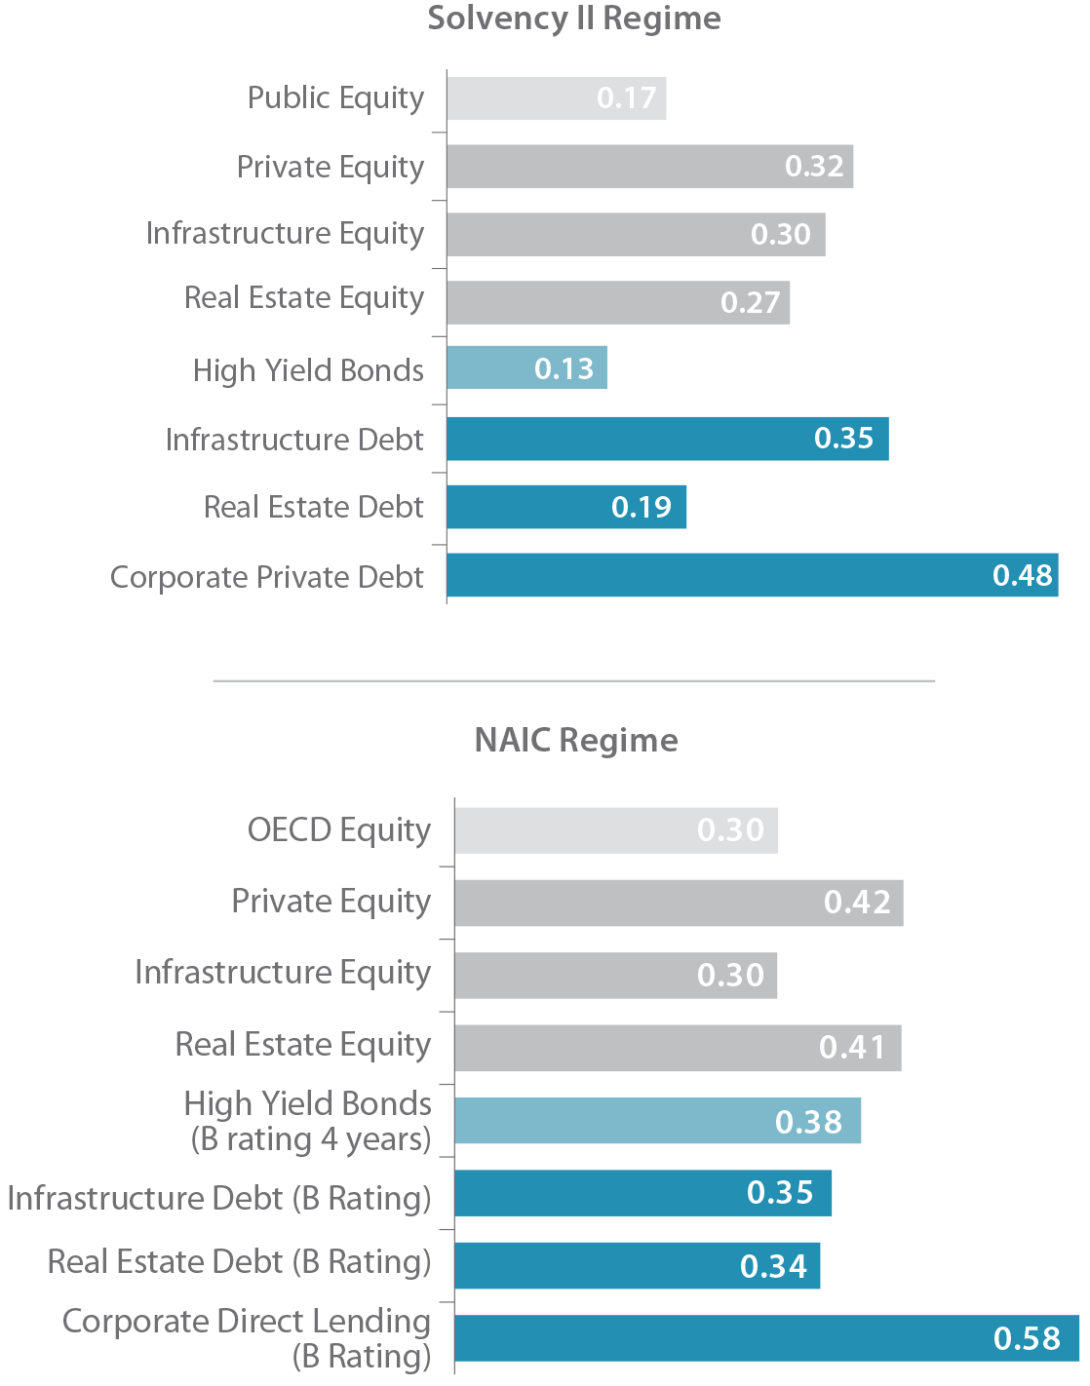
Regulatory Capital Efficiency
Even when done in isolation, comparing an investment’s solvency capital to its expected return can be a valuable exercise and helps to further illustrate why insurance companies are increasing their allocations to private markets. As a result, one can judge how much solvency capital is required for an investment with a certain risk-adjusted return expectation. For example, a ratio of 0.5 would indicate an expected risk-adjusted return of half of the solvency capital to be reserved. The higher the ratio, the more effective the investment. This information is especially valuable when determining an insurer’s SAA. Figure 10 illustrates the average capital efficiency for several types of investments under the Solvency II (top) and NAIC (bottom) regimes. In most cases, private markets generate higher returns for each unit of solvency capital.
FIGURE 10 | EFFICIENCY RATIOS
Source: StepStone calculation based on current yields and assumed modified duration. NAIC based on pretax example of a US life insurance company based on forward-looking returns. Actual results may vary.
TABLE 2 | SUMMARY OF THE NAIC RBC SCHEDULE FOR PRIVATE MARKETS

Source: StepStone summary of private market RBCs taken from Schedules D and BA and core assets.
*The credit rating must be received by either a NAIC-registered securities valuation office or by a SEC-regulated ratings agency.
**Pretax.
1 NAIC Capital Markets Special Report 2019.
2 StepStone analysis based on aggregated asset allocation of the US insurance sector and historical returns of the invested asset classes.
3 Supra note 1; market share based on AUM.
4 StepStone analysis based on aggregated asset allocation of the European insurance sector and historical returns of the invested asset classes.
5 Bouvet, Leanne and Kirjanas, Pavel “Global Climate 500 Index 2016: Insurance Sector Analysis,” Asset Owners Disclosure Project, July 2016.
6 Kong, Nancy and Lee, Yongho, “Allocating Overseas: What Asia Insurers Can Learn From Insurers in Developed Markets,” PineBridge Investments, May 2017.
7 StepStone analysis.
8 To implement the 10% private markets allocation 3% of Investment-grade Bonds, 3% of Equities, 3% of Government Bonds and 1% of High-yield Bonds are being replaced. The details of the process we used to arrive at this recommendation are the subject of a forthcoming paper.
9 In this example, we replaced 7.0% of positions in Government Bonds, 6.5% of positions in Investment-grade Bonds, 3.5% in Other Credit and 3.0% of positions in High-yield Bonds with a 14.0% allocation to Corporate Direct Lending, 3.0% to Infrastructure Private Debt, and 3.0% to Real Estate Private Debt.
10 Goldman Sachs Asset Management Insurance Survey, April 2021.
11 Smoothing occurs due to stale pricing. It often results in overstated risk-adjusted returns, which can lead portfolio managers to overweight more volatile sectors.
12 Solvency II consists of three pillars: Pillar I defines the SCR; Pillars II and III address risk assessment, management, and reporting. We focus solely on Pillar I.
13 Like traditional credit investments, indirect private debt investments (i.e., via funds) are usually suboptimal from an RBC perspective; private debt investments without a credit rating are subject to the maximum RBC charge.
Read the full article here
This document is for information purposes only and has been compiled with publicly available information. StepStone makes no guarantees of the accuracy of the information provided. This information is for the use of StepStone’s clients and contacts only. This report is only provided for informational purposes. This report may include information that is based, in part or in full, on assumptions, models and/or other analysis (not all of which may be described herein). StepStone makes no representation or warranty as to the reasonableness of such assumptions, models or analysis or the conclusions drawn. Any opinions expressed herein are current opinions as of the date hereof and are subject to change at any time. StepStone is not intending to provide investment, tax or other advice to you or any other party, and no information in this document is to be relied upon for the purpose of making or communicating investments or other decisions. Neither the information nor any opinion expressed in this report constitutes a solicitation, an offer or a recommendation to buy, sell or dispose of any investment, to engage in any other transaction or to provide any investment advice or service.
Past performance is not a guarantee of future results. Actual results may vary.
Each of StepStone Group LP, StepStone Group Real Assets LP and StepStone Group Real Estate LP is an investment adviser registered with the Securities and Exchange Commission (“SEC”). StepStone Group Europe LLP is authorized and regulated by the Financial Conduct Authority, firm reference number 551580. Swiss Capital Invest Holding (Dublin) Ltd (“SCHIDL”) is an SEC Registered Investment Advisor and Swiss Capital Alternative Investments AG (“SCAI”) (together with SCHIDL, “SwissCap”) is registered as a Relying Advisor with the SEC. Such registrations do not imply a certain level of skill or training and no inference to the contrary should be made.
Manager references herein are for illustrative purposes only and do not constitute investment recommendations.