Executive Summary
- We expect a modest recession in 2023, with full-year GDP growth of 0.9%.
- MIM’s custom-built index of market discount rates was compared against bond yields; it suggests real estate is offering fair to modestly attractive relative value today.
- Markets with high exposure to both tech and residential construction labor could underperform in 2023.
- We expect office vacancy to rise an additional 120 bps by year-end 2024, before beginning to decline.
- Outside of office we expect healthy rent growth in industrial, retail, hotel, and select apartment markets; we do not expect apartment rent growth to keep up with expense growth in some sunbelt markets.
Read more from MetLife Investment Management
Economic Outlook
Rapid shifts in the global economic and capital markets are exerting strong influences on U.S. commercial real estate. Some of the more significant changes include:
- Capital markets volatility. We believe interest rates have peaked, and expect the Fed Funds rate & SOFR rate to modestly decline during the second half of 2023.
- Inflation growth is beginning to cool. Shelter costs are moving more convincingly toward the Federal Reserve’s target for long-term price growth, but, due to data collection lags, have yet to show up in the Consumer Price Index. While cooling inflation is positive for the broader economy, the impact on real estate is mixed.
- Geopolitical uncertainty. The war in Ukraine and tensions between China and Taiwan are negatively impacting capital markets conditions in the form of higher volatility and wider risk spreads. Longer-term, a slowdown or reversal in globalization could contribute to higher longterm inflation, which may improve the relative value of real estatei . It could also be positive for several U.S. cities that stand to gain from onshoring and nearshoring.
- Labor market weakness. While employment growth has been solid in recent months, we are cautious on the outlook for labor market conditions, given elevated economic uncertainty, low consumer confidence and increasing layoffs as tracked through municipal WARN Actii notices. We expect the U.S. unemployment rate to rise during the remainder of the year, with differences in labor market performance (and thus real estate demand) by geography. Weakening labor markets could further pressure the office sector, where leasing activity is highly correlated with office-using employment growth.
- Domestic fiscal policy risk. Two policy risk factors we are focused on include [1] The ongoing debt ceiling debate. While we do not expect the U.S. to default on Treasury debt, Congress’s inability to raise the debt ceiling could add to capital markets volatility this year, as the issue comes to a head in within the next month. [2] If the Supreme Court overrules student loan forgiveness legislation, we would expect a modestly negative impact on economic growth and multifamily demand.
Taken together, we expect a mild recession in 2023 but still slightly positive GDP growth of +0.9% for the full year. This compares to the more severe 2008 recession when calendar-year GDP declined by 1.6%. Given these positive and negative risks, how should real estate investors position portfolios and seek new opportunities in 2023?
Real Estate Capital Markets Outlook
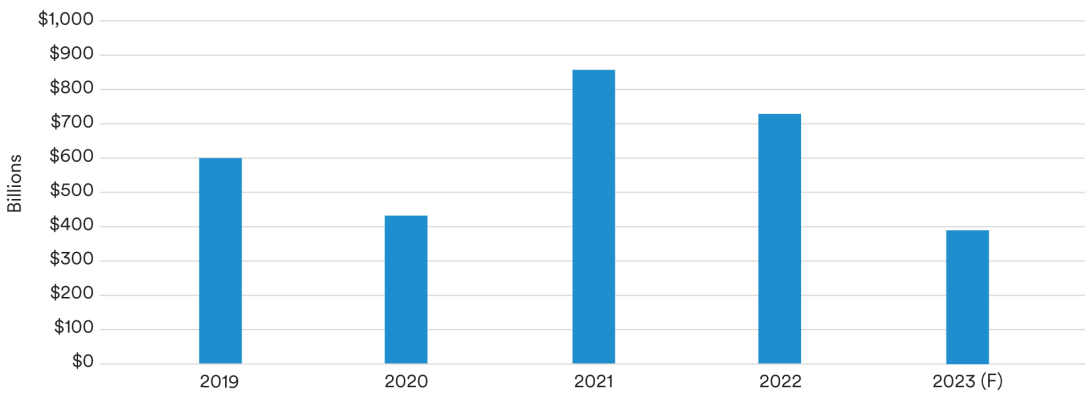
Real estate capital markets conditions have been volatile over the past several quarters. As expected, the rise in interest rates has impacted real estate transaction activity, and property values have begun to decline. In the first quarter of 2023, 56% fewer trades occurred than was the case a year earlier, as wide bid-ask spreads result in muted transaction volume. Looking forward, we expect around $390 billion in transaction activity this year, compared to $601 billion in 2019 and $738 billion in 2022 (see exhibit 1).
Exhibit 1 | Transaction Volume
Source: MIM, RCA. May 2023 As we indicated in our September 2022 real estate outlook report,iii discount rates for core,iv unlevered commercial real estate, a key input in determining property values, have been approximately equal to Baa corporate bonds plus 200 basis points (bps) over time. We, therefore, generally consider this level to be an approximate barometer for neutral relative value and view periods of time when discount rates rise above Baa +200 bps worth considering increasing risk in new real estate investments (risk on approach), and periods below that threshold, worth considering decreasing risk (risk off approach). As of this writing, this analysis suggests that real estate is now being offered at a fair to modestly attractive relative value (see exhibit 2).
Exhibit 2 | Private Commercial Real Estate IRR vs. Baa+200bps
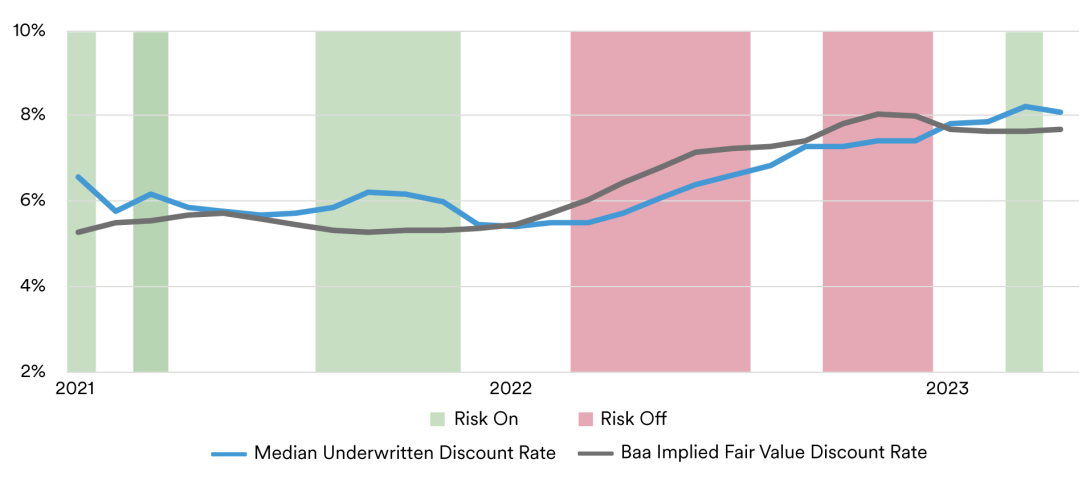
Sources: MIM, Moody's. May 2023 The underwritten discount rate in Exhibit 2 is based on an examination of over 250 core assets that MIM considered investing in between January 2021 and April 2023. Comparing these discount rates with the Baa +200 bps yield shows the commercial real estate sector exceeded its historical average premium for all of 2021 and early 2022, lagged this benchmark during most of 2022, and that real estate pricing is now modestly above this bond benchmark. Although bond yields remain volatile, the broader implication of this analysis is that real estate transaction prices may be nearing a cyclical trough. According to the National Council of Real Estate Investment Fiduciaries (NCREIF) real estate prices declined 4.2% and 2.6% during the fourth quarter of 2022 and first quarter of 2023, respectivelyv , and we expect the NCREIF Property Index to show approximately an additional 10% decline in real estate prices as more appraisal and transaction data become available this year (with office underperforming other sectors). While we expect this pricing adjustment to contribute to growing transaction volume, there are a few caveats worth mentioning. First, the office sector has an uncertain outlook for income growth and thus has a wider bid-ask spread between buyers and sellers. Lenders have also been pulling back from office, and we expect continued foreclosures and forced sales in the market this year. Second, private real estate is still being impacted by the “denominator effect,” where declines in stock and bond portfolio values during 2022 have left many institutional investors overallocated to the real estate sector. That said, this effect was more prevalent six months ago than is the case today. For example, public equity markets declined as much as 25% from the early 2022 peak and are now down only 14% from the same peak.vi Lastly, weakness in the banking sector has sidelined certain lender segments—especially regional banks that make up a large share of the commercial real estate debt market. Regional banks are a particularly important capital source for construction projects, which could mean fewer construction starts this year as well as a declining supply pipeline for the next one to three years. Combined, even though our discount rate and corporate bond yield analysis above suggest real estate is priced attractively relative to Baa corporates +200 bps, these liquidity factors specific to commercial real estate could cause the sector to over correct. In our view, this could mean real estate could continue to become more attractively priced in the coming months, as compared to other asset classes. Investors with dry powder available for real estate could find attractive opportunities in mid-to-late 2023 as a result.
Geographic Strategies
Two macro themes that will drive real estate performance across geographies in the near term include [1] labor market conditions in the tech and housing construction sectors and [2] supply chain diversification leading to onshoring or nearshoring. Starting with labor market conditions, many of the largest technology employers have made announcements to lay off workers or slow planned hiring in 2023. This trend will likely be exacerbated by the failure of Silicon Valley Bank, which is a primary source of venture debt for many growing technology companies. Similarly, we expect labor market weakness in the housing construction sector due to the impact of higher interest rates on the market for new home sales. In our view, this could lead to slower economic growth in cities with high exposure to these labor market sectors in the short term (see exhibit 3). Conversely, several markets with positive demographic tailwinds, like Atlanta and Charlotte, that do not have a large segment of their current labor market in tech or construction jobs may be relatively better positioned. These labor market conditions are not the only factor that could drive short-term divergences in economic growth and real estate demand across metros. COVID-19 disruptions and geopolitical turmoil are contributing to a reverse in globalization and a re-shuffling in global supply chains. Within the last several quarters, the Biden administration signed the CHIPS and Science Act, and the Inflation Reduction Act into law. We expect both to generate demand in metros with high-tech manufacturing and logistics labor, as demand potentially rises to produce goods like batteries, semiconductors and electric vehicle parts. The cities that are best positioned to capture this tailwind are being overlooked by real estate investors, in our view. These include Louisville, Memphis, Indianapolis, Columbus, Kansas City and a handful of others that have large, low-cost, skilled labor pools, a businessfriendly local government and tax regime, and access to national or international logistics networks. Non-West Coast port cities like Houston, Savannah and Baltimore may also benefit, in our view. With economic conditions and geographic divergences as a backdrop, investors should also understand property-type specific dynamics that could impact returns.
Exhibit 3 | Tech and Construction Share of Labor Market
| Metro | At Risk Share of Total Employment |
|---|
| San Francisco | 28% |
|---|
| Seattle | 20% |
|---|
| Austin | 18% |
|---|
| San Diego | 15% |
|---|
| Washington DC | 15% |
|---|
| Denver | 15% |
|---|
| Portland | 14% |
|---|
| Orange County | 14% |
|---|
| Dallas | 13% |
|---|
| Baltimore | 12% |
|---|
| Phoenix | 12% |
|---|
| Tampa | 12% |
|---|
| Boston | 12% |
|---|
| Sacramento | 11% |
|---|
| Minneapolis | 11% |
|---|
| Fort Lauderdale | 11% |
|---|
| Atlanta | 11% |
|---|
| Houston | 11% |
|---|
| Orlando | 10% |
|---|
| West Palm | 10% |
|---|
| Charlotte | 10% |
|---|
| NYC | 9% |
|---|
| Chicago | 9% |
|---|
| Nashville | 9% |
|---|
| Los Angeles | 8% |
|---|
| Miami | 7% |
|---|
| Philadelphia | 6% |
|---|
Sources: MIM, Moody's. May 2023
Residential—Rental Demand Is Normalizing
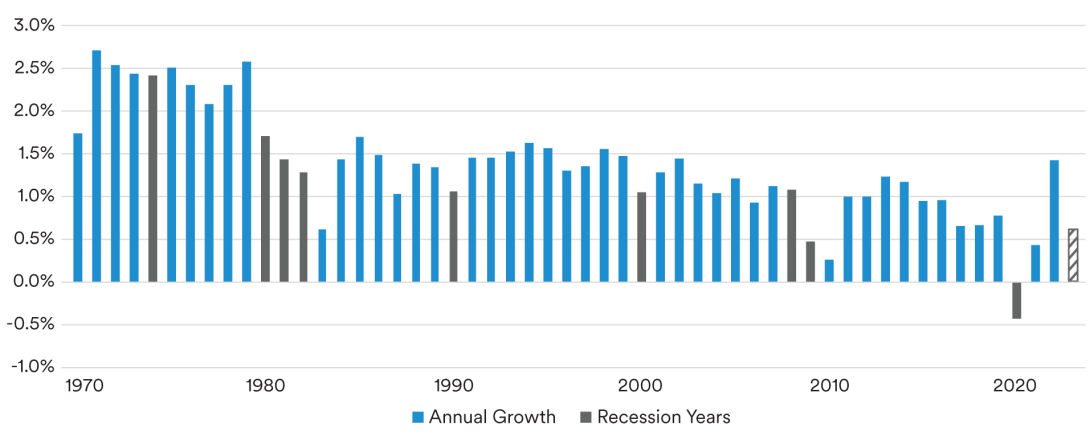
Household formation is a primary driver of rental demand. While household formation is driven by demographics and straightforward to predict over 10-plus year periods, it can be volatile from one year to the next depending on economic conditions. The pandemic also contributed to this volatility and made household growth contract and expand much more than is typical (exhibit 4).
Exhibit 4 | Annual Growth in Total Households
Sources: MIM, Moody's. May 2023
Due to a softening economic outlook and a worsening relationship between rent levels and income levels, we expect household formation to be modest in 2023. If household formation slows or stalls, we think some U.S. markets with elevated supply pipelines could be at risk of rising vacancies and weaker-than-expected rent growth in 2023 and 2024. In recent years, demographic trends have generally pointed to multifamily investment opportunities in growth markets like Austin, Phoenix and Nashville. As we pointed out in our 2022 outlook report from over a year ago, while we believe these markets will be demographics winners over the next 10 years, we were beginning to see pockets of pricing risk and short-term supplydemand mismatches in these markets. Reasons included elevated supply pipelines, tightening rent-to-income ratios and low cap rates that reflected expectations of record-setting rent growth to continue.
Exhibit 5 | Top / Bottom Markets for Apartment Inventory Growth
| Metro | Current Vacancy | 2023-2024 Inventory Growth |
|---|
| Los Angeles - CA | 3.8% | 1.6% |
|---|
| San Diego - CA | 3.3% | 1.9% |
|---|
| Sacramento - CA | 5.6% | 2.2% |
|---|
| Orange County - CA | 3.5% | 2.3% |
|---|
| Baltimore - MD | 6.4% | 2.5% |
|---|
| East Bay - CA | 6.2% | 2.6% |
|---|
| Inland Empire - CA | 4.8% | 2.7% |
|---|
| New York - NY | 2.0% | 2.7% |
|---|
| San Jose - CA | 4.6% | 3.4% |
|---|
| Chicago - IL | 4.9% | 3.4% |
|---|
| USA | 5.5% | 4.8% |
|---|
| Fort Lauderdale - FL | 4.5% | 7.5% |
|---|
| Northern New Jersey - NJ | 2.9% | 8.4% |
|---|
| Tampa - FL | 5.6% | 8.5% |
|---|
| Denver - CO | 5.7% | 8.8% |
|---|
| Palm Beach - FL | 5.5% | 9.3% |
|---|
| Orlando - FL | 5.9% | 11.3% |
|---|
| Miami - FL | 3.6% | 12.0% |
|---|
| Austin - TX | 7.1% | 12.0% |
|---|
| Charlotte - NC | 6.8% | 12.8% |
|---|
| Nashville - TN | 6.5% | 13.5% |
|---|
Sources: MIM, CoStar. May 2023
This dynamic has been occurring during the second half of 2022 and early 2023, and today, the fastest apartment rent growth is found in places like New York and Los Angeles, while rent and occupancy levels have been flat or modestly declining in places like Phoenix and Nashville. We continue to believe that investors should consider targeting a geographically diversified portfolio, and we view it as unfortunate that many investors are only investing in a handful of the fastest growing sunbelt markets, while eliminating, rather than underweighting, markets with slower population growth but also slower construction pipelines. Phoenix also serves as an instructive example, dropping to the bottom-performing multifamily market in 4Q2022, according to NCREIF’s measure of unlevered returns, after several years as number one or number two on the list. In addition to diversifying exposure by geography, we continue to believe that investors should allocate across residential formats. We believe some of the best rent growth in this cycle will be observed in single family rentals, manufactured housing, moderate income housing and formats that cater to the baby boomer demographic, such as age-restricted housing. The common themes among these formats are affordability and larger floorplans, both of which are supported by economic and demographic trends.
Office—Challenges and Opportunities Abound
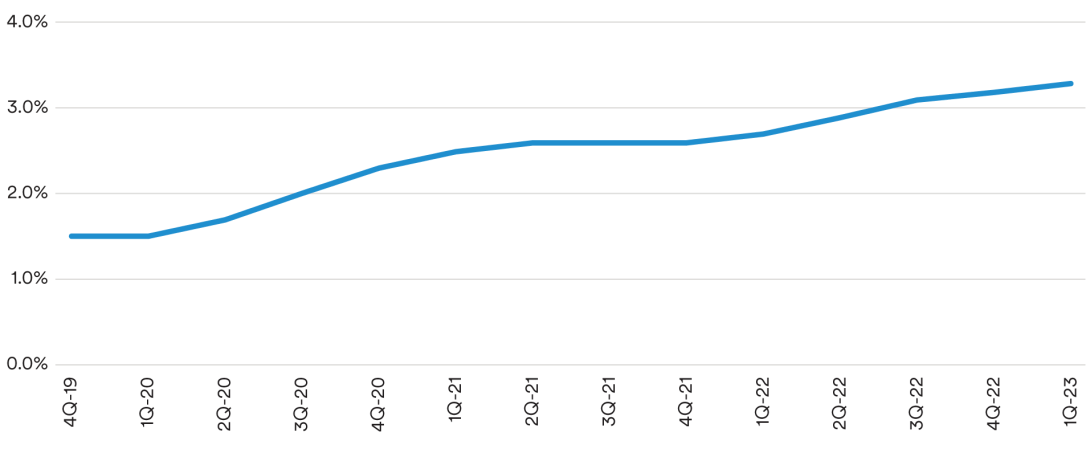
We believe the office sector was the worst positioned as we headed into the high inflation/high interest rate environment that the economy has been in for over a year now. At the start of 2022, most property sectors enjoyed vacancy rates at or below long-term historical averages, allowing a strong footing leading into softening economic conditions. The opposite was true for the office sector. Office subleasing, a leading indicator of general vacancy, recently resumed rising after leveling off in 2021 and early 2022 (exhibit 6). We attribute this to a worsening outlook for the economy and labor markets, especially among the office-heavy tech sector. Additionally, office development activity has been much higher than we were forecasting a year ago, despite poor occupancy rates and materially higher construction costs. Office sector weakness has been more acutely felt in Class B and C buildings, while new A+ quality assets have maintained strong occupancy. This has contributed to a stronger-than-expected construction pipeline. Looking forward, we think office performance lies in tenant utilization rates. Given recent industry surveys and conversations with users of office space, we believe future tenant utilization can be broken into four categories: office first, office centric, hot desking and remote first. Across those four categories, and as outlined in exhibit 7, we believe the average office user now requires 92% of the space per employee as was required prior to COVID-19. In other words, remote working has caused an 8% structural decline in office demand.
Exhibit 6 | National Office Sublease Vacancy Rate
Sources: MIM, CoStar. May 2023
Combining these demand implications with the outlook for office using employment growth and the higher-than-expected outlook for new supply, we believe office vacancy will rise by an additional 120 bps by year-end 2024, to around 19.0%. The capital markets picture is an additional hurdle the office sector will contend with this year. Higher interest rates are pressuring debt service coverage ratios (especially given tepid or negative office income growth), further constraining the limited deal activity. These factors have created a liquidity crunch in the office sector, compounding challenges in the space market, and we believe the NCREIF Property Index could show a peak-to-trough decline in office values of 20% to 25% from the mid-2022 recent peak in values. Although this represents one of the more significant challenges that owners of office space have faced in the past several decades, it is also generating opportunities for new investments. Investors with appetite for office rescue capital and the capability to work out troubled assets are likely to be rewarded, as they have been in previous cycles. Well located, Class-B assets in markets with favorable demographics, assets that are able to undergo a conversion to residential or hospitality, or Class-A assets that were overlevered in the prior cycle are prime targets, in our view. While we have not seen consistent pricing on these assets yet, given limited liquidity, we expect opportunities to arise later this year.
Exhibit 7 | Office Leasing Forecast
| | Target Office Foorprint as % of 2019 | % of Workforce |
|---|
| Assigned Seats | 100% | 40% |
|---|
| Office-centric | 95% | 35% |
|---|
| Hot Desking | 85% | 20% |
|---|
| Remote first | 25% | 5% |
|---|
| | | |
|---|
| Average Target Office Footprint as % of 2019 | 92% |
|---|
Source: MIM. May 2023
Retail—Subtype Divergences
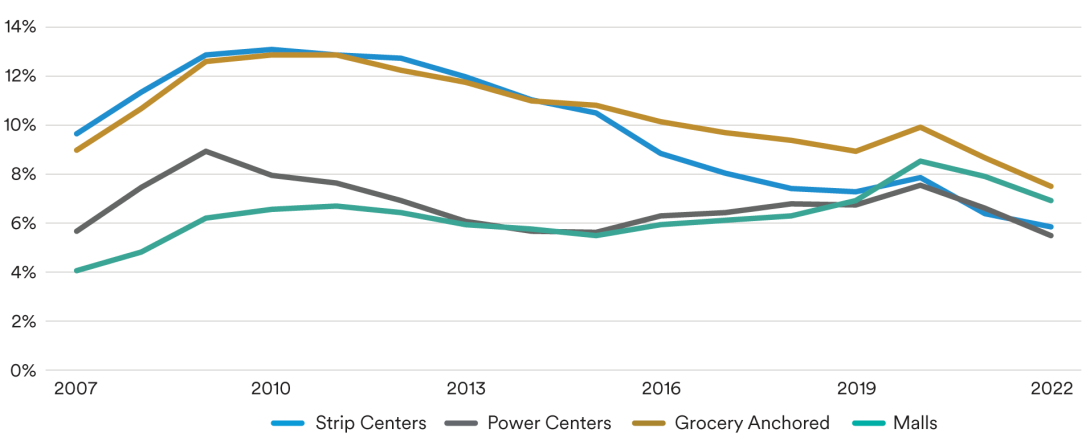
As we have noted in recent quarters, the retail sector has been one of the most notable upside surprises coming out of COVID-19. Due in part to low construction activity, the average retail vacancy rate is at a historical low. Even the challenged mall subsector is beginning to see vacancies decline, though this is largely due to negative supply growth with lower-quality assets being shuttered.
Exhibit 8 | Retail Subtype Vacancies
Sources: MIM, CoStar. May 2023
As a result of healthy fundamentals, retail asset prices have been stable over the last year, with the rise in interest rates being offset by the rise in property income growth. Given these positive capital markets and fundamentals traits, and little to no new construction in most markets, we believe retail is offering an attractive investment profile today, and one that many investors are not considering after nearly 20 years of underperformance as a result of e-commerce growth.
One area of caution within retail is, counterintuitively, the grocery segment. Grocery-anchored retail has been one of the lowest-risk categories within the broader real estate sector for decades and is priced accordingly. We do not believe investors are appropriately attributing the risk of consolidation, downsizing of footprints or e-grocery in underwriting assumptions.
As such, we recommend debt and equity investors focus on non-grocery retail segments including power centers leased to credit-worthy tenants that have e-commerce resiliency, neighborhood centers, and single-tenant, net lease retail, such as quick-service restaurants, dollar/convenience and home improvement stores. Our over-arching retail strategy remains a focus on e-commerce resiliency and experience-based spending.
Industrial—Stable Outlook
Little has changed in our positive view of industrial fundamentals. While we are not expecting the parabolic growth of 2021 and 2022 to be repeated, with major logistics providers doubling in size during that period, we expect low vacancies and the continued push for faster delivery speeds to continue to generate healthy rent growth, especially for infill submarkets with high supply barriers. Despite the economic headwinds, we are currently forecasting 6.1% national average rent growth in 2023 and 3.7% rent growth in 2024.
As mentioned above, we believe onshoring and nearshoring could provide an economic tailwind to several market areas, and the industrial sector will be a primary beneficiary of that trend. Markets like Louisville, Memphis, Indianapolis, Columbus and Kansas City may not be on the radar of many institutional investors today, but we believe they deserve an overweight, as do industrial facilities in ports like Savannah and Baltimore.
Economic Headwinds
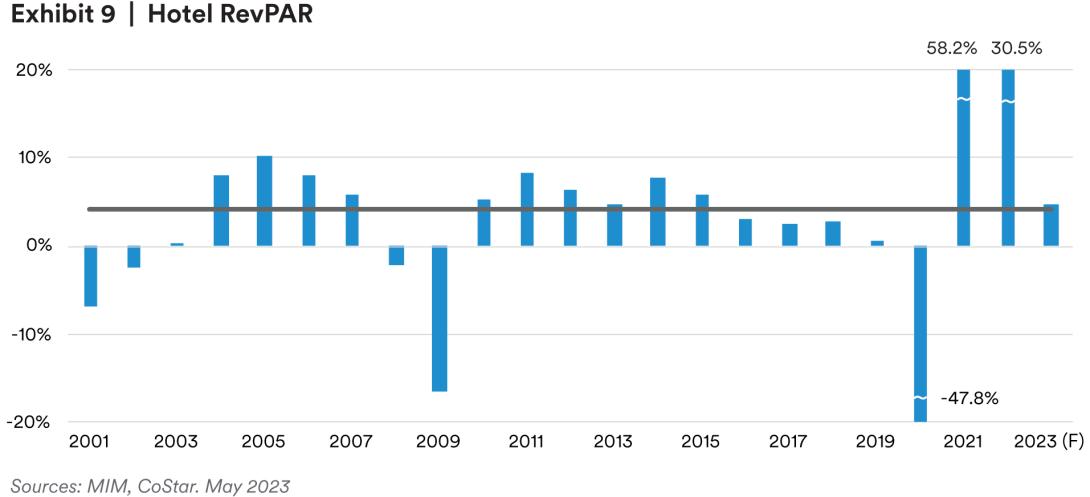
As we outlined in our 2021 report, A Stigmatized Sector: Our Outlook for U.S. Hotel Investments, hotel performance has, historically, almost entirely been explained by two factors: office-using employment growth and construction completions. In the COVID-19, and post-COVID-19 world, however, hotel performance has been determined by the path of the pandemic and recovery, as well as inflation trends. With rents re-setting to market daily, the hotel sector is uniquely positioned to capture still-rising inflation, and we expect that trend to be reflected in Revenue Per Available Room (RevPAR) figures in 2023, even as the labor market weakens.
Exhibit 9 | Hotel RevPAR
Sources: MIM, CoStar. May 2023
In addition to higher inflation, the hotel sector is benefiting from a recovery in business travel. According to the U.S. Travel Association, 81% of respondents to a quarterly business travel survey expected to make at least one trip in the first half of 2023, compared to 83% pre-COVID-19. Responses were evenly distributed across internal meetings, meetings with external stakeholders and conferences.
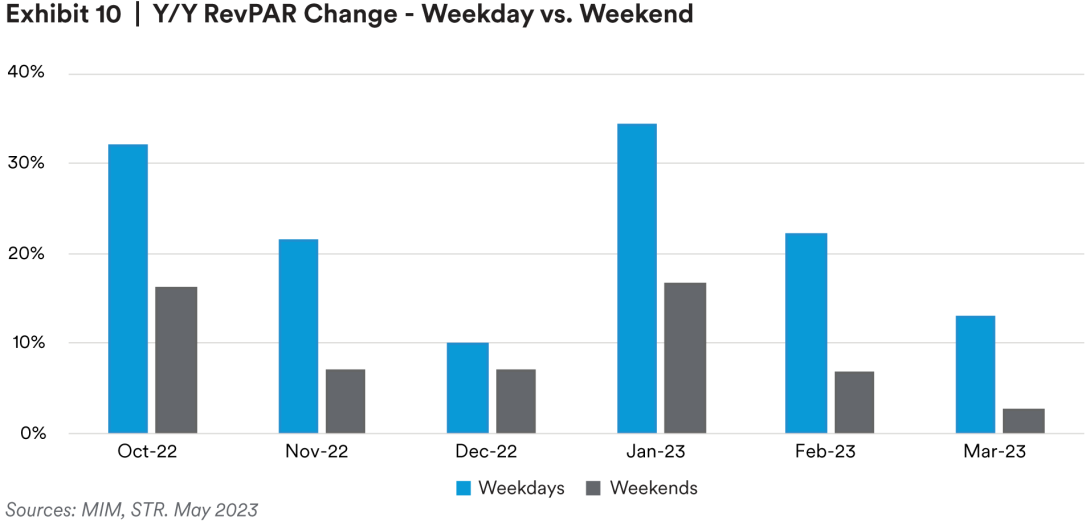
This trend is already being reflected in booking data, with weekday performance (indicative of business travel) outpacing weekend performance (indicative of leisure travel) over the past year (exhibit 10). We believe this is positive for many international/business-oriented destination markets like San Francisco and Baltimore that have been shunned by hotel investors over the past several years.
Exhibit 10 | Y/Y RevPAR Change - Weekday vs. Weekend
Sources: MIM, STR. May 2023
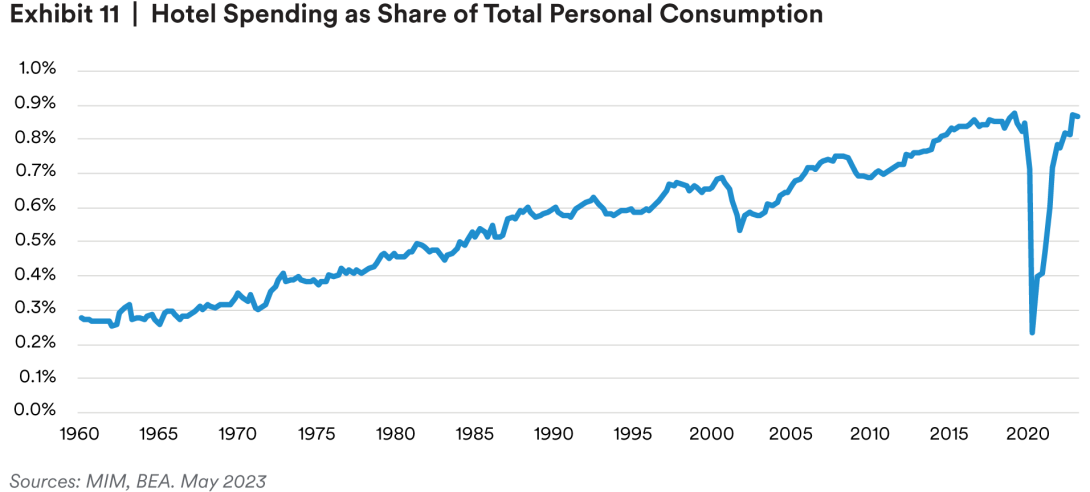
Lastly, hybrid working remains a tailwind for the hotel sector; 81% of consumers who have business travel planned in the next six months said they have leisure travel planned in the same timeframe. We continue to believe the digital-nomad trend is additive to the average consumer’s number of hotel room nights per year and is a material boost to hotel demand, as is the long-term trend of increased spending on experiences over goods. Increased spending on experiences has led hotels to capture a growing share of personal spending over the past several decades, and we expect this trend to continue (exhibit 11).
Exhibit 11 | Hotel Spending as Share of Total Personal Consumption
Sources: MIM, BEA. May 2023
Challenges to the hotel sector remain on the expense side, particularly with respect to labor costs. Despite our expectations for softening labor market conditions this year, we expect the unemployment rate in the leisure and hospitality sector to remain low, and we continue to expect wages to outpace inflation. Hotel segments with lower expense ratios like limited-service hotels are better positioned to navigate this difficult expense environment.
Conclusion
A combination of macro themes and specific property-type and capital-markets circumstances will present both challenges and opportunities for commercial real estate investors in the months ahead. Liquidity is low, and some segments of the industry like the office sector are facing significant challenges in the space market. Despite the challenges, the coming quarters will likely also prove to be a period of opportunity as is typical for capital providers in a market with low liquidity.
Among the major property types included in our overweight strategies are industrial assets located in select, former “rust belt” areas, the non-mall and non-grocery retail sector, residential in markets with balanced supply pipelines, and tactical opportunities in the office sector.
Endnotes
i https://investments.metlife.com/insights/real-estate/how-inflation-and-rising-interest-rates-impact-commercial-real-estate/
ii Worker Adjustment and Retraining Notification Act of 1988
iii https://investments.metlife.com/insights/real-estate/fall-2022-real-estate-outlook/
iv “Core” is synonymous with stabilized assets that do not require major leasing or capital improvements.
v NCREIF, 4Q2022. vi Bloomberg, April 2023
Disclaimer
This material is intended solely for Institutional Investors, Qualified Investors and Professional Investors. This analysis is not intended for distribution with Retail Investors.
This document has been prepared by MetLife Investment Management (“MIM”)1 solely for informational purposes and does not constitute a recommendation regarding any investments or the provision of any investment advice, or constitute or form part of any advertisement of, offer for sale or subscription of, solicitation or invitation of any offer or recommendation to purchase or subscribe for any securities or investment advisory services. The views expressed herein are solely those of MIM and do not necessarily reflect, nor are they necessarily consistent with, the views held by, or the forecasts utilized by, the entities within the MetLife enterprise that provide insurance products, annuities and employee benefit programs. The information and opinions presented or contained in this document are provided as of the date it was written. It should be understood that subsequent developments may materially affect the information contained in this document, which none of MIM, its affiliates, advisors or representatives are under an obligation to update, revise or affirm. It is not MIM’s intention to provide, and you may not rely on this document as providing, a recommendation with respect to any particular investment strategy or investment. Affiliates of MIM may perform services for, solicit business from, hold long or short positions in, or otherwise be interested in the investments (including derivatives) of any company mentioned herein. This document may contain forward-looking statements, as well as predictions, projections and forecasts of the economy or economic trends of the markets, which are not necessarily indicative of the future. Any or all forward-looking statements, as well as those included in any other material discussed at the presentation, may turn out to be wrong.
All investments involve risks including the potential for loss of principle and past performance does not guarantee similar future results. Property is a specialist sector that may be less liquid and produce more volatile performance than an investment in other investment sectors. The value of capital and income will fluctuate as property values and rental income rise and fall. The valuation of property is generally a matter of the valuers’ opinion rather than fact. The amount raised when a property is sold may be less than the valuation. Furthermore, certain investments in mortgages, real estate or non-publicly traded securities and private debt instruments have a limited number of potential purchasers and sellers. This factor may have the effect of limiting the availability of these investments for purchase and may also limit the ability to sell such investments at their fair market value in response to changes in the economy or the financial markets
In the U.S. this document is communicated by MetLife Investment Management, LLC (MIM, LLC), a U.S. Securities Exchange Commission registered investment adviser. MIM, LLC is a subsidiary of MetLife, Inc. and part of MetLife Investment Management. Registration with the SEC does not imply a certain level of skill or that the SEC has endorsed the investment advisor.
This document is being distributed by MetLife Investment Management Limited (“MIML”), authorised and regulated by the UK Financial Conduct Authority (FCA reference number 623761), registered address 1 Angel Lane, 8th Floor, London, EC4R 3AB, United Kingdom. This document is approved by MIML as a financial promotion for distribution in the UK. This document is only intended for, and may only be distributed to, investors in the UK and EEA who qualify as a “professional client” as defined under the Markets in Financial Instruments Directive (2014/65/EU), as implemented in the relevant EEA jurisdiction, and the retained EU law version of the same in the UK.
For investors in the Middle East: This document is directed at and intended for institutional investors (as such term is defined in the various jurisdictions) only. The recipient of this document acknowledges that (1) no regulator or governmental authority in the Gulf Cooperation Council (“GCC”) or the Middle East has reviewed or approved this document or the substance contained within it, (2) this document is not for general circulation in the GCC or the Middle East and is provided on a confidential basis to the addressee only, (3) MetLife Investment Management is not licensed or regulated by any regulatory or governmental authority in the Middle East or the GCC, and (4) this document does not constitute or form part of any investment advice or solicitation of investment products in the GCC or Middle East or in any jurisdiction in which the provision of investment advice or any solicitation would be unlawful under the securities laws of such jurisdiction (and this document is therefore not construed as such).
For investors in Japan: This document is being distributed by MetLife Asset Management Corp. (Japan) (“MAM”), 1-3 Kioicho, Chiyoda-ku, Tokyo 102-0094, Tokyo Garden Terrace KioiCho Kioi Tower 25F, a registered Financial Instruments Business Operator (“FIBO”) under the registration entry Director General of the Kanto Local Finance Bureau (FIBO) No. 2414.
For Investors in Hong Kong S.A.R.: This document is being issued by MetLife Investments Asia Limited (“MIAL”), a part of MIM, and it has not been reviewed by the Securities and Futures Commission of Hong Kong (“SFC”). MIAL is licensed by the Securities and Futures Commission for Type 1 (dealing in securities), Type 4 (advising on securities) and Type 9 (asset management) regulated activities.
For investors in Australia: This information is distributed by MIM LLC and is intended for “wholesale clients” as defined in section 761G of the Corporations Act 2001 (Cth) (the Act). MIM LLC exempt from the requirement to hold an Australian financial services license under the Act in respect of the financial services it provides to Australian clients. MIM LLC is regulated by the SEC under US law, which is different from Australian law.
MIMEL: For investors in the EEA, this document is being distributed by MetLife Investment Management Europe Limited (“MIMEL”), authorised and regulated by the Central Bank of Ireland (registered number: C451684), registered address 20 on Hatch, Lower Hatch Street, Dublin 2, Ireland. This document is approved by MIMEL as marketing communications for the purposes of the EU Directive 2014/65/EU on markets in financial instruments (“MiFID II”). Where MIMEL does not have an applicable cross-border licence, this document is only intended for, and may only be distributed on request to, investors in the EEA who qualify as a “professional client” as defined under MiFID II, as implemented in the relevant EEA jurisdiction. The investment strategies described herein are directly managed by delegate investment manager affiliates of MIMEL. Unless otherwise stated, none of the authors of this article, interviewees or referenced individuals are directly contracted with MIMEL or are regulated in Ireland. Unless otherwise stated, any industry awards referenced herein relate to the awards of affiliates of MIMEL and not to awards of MIMEL.
1 As of March 31, 2023, subsidiaries of MetLife, Inc. that provide investment management services to MetLife’s general account, separate accounts and/or unaffiliated/third party investors include Metropolitan Life Insurance Company, MetLife Investment Management, LLC, MetLife Investment Management Limited, MetLife Investments Limited, MetLife Investments Asia Limited, MetLife Latin America Asesorias e Inversiones Limitada, MetLife Asset Management Corp. (Japan), MIM I LLC, MetLife Investment Management Europe Limited, Affirmative Investment Management Partners Limited and Raven Capital Management LLC