Key Insights
- After a difficult year, securitized credit markets exited 2022 with positive momentum that carried over into early 2023.
- Supply technicals should become less of a headwind and more of a tailwind for securitized credit markets in 2023.
- Securitized valuations are relatively attractive, and we believe that strong bond pickers could be rewarded as fundamentals receive greater scrutiny.
Securitized credit markets closed out 2022 with positive momentum that carried over into early 2023. Still, the past year was the most stressful period for securitized markets—outside of the global pandemic-induced meltdown in early 2020—since the recovery from the 2008 global financial crisis (GFC).
Signals from the Federal Reserve that its rate‑hiking cycle is nearing an end, a welcome moderation in high inflation and interest rate volatility, a year‑end slowdown in issuance, and increased demand for securitized products from yield‑focused investors all contributed to a mild recovery amid improved liquidity conditions. However, securitized credit sectors began to recuperate later than their corporate counterparts and generally ended the quarter with credit spreads1 at wider levels despite rallying into year‑end. Moreover, certain sectors where there are still elevated concerns about maturity extension risk and true fundamental credit risk largely sat out the rebound. With recession concerns an omnipresent overhang, investors generally favored higher‑quality areas with lower spread volatility characteristics.
Markets Cheered a Slightly Less Hawkish Fed
Continuing to wage war against high inflation, the Fed delivered two more rate hikes in the fourth quarter (Q4), lifting the federal funds rate to a target range of 4.25% to 4.5%, its highest since 2007. The Fed stepped down to a 50‑basis‑point increase in December after a series of historically large 75‑basis‑point hikes. Core inflation remained at multi‑decade highs but encouragingly surprised to the downside in October and November, boosting depressed investor confidence. Fed Chair Jerome Powell acknowledged that inflation is headed in the right direction but also indicated that a few more rate increases will be needed along with more evidence that downward price momentum will be sustained.
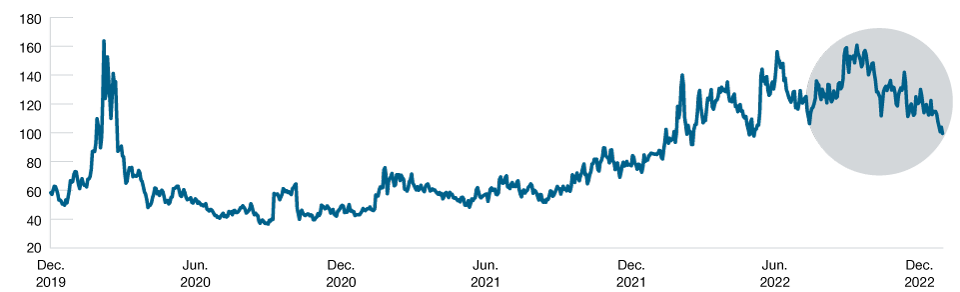
The market’s perception of the Fed’s tone becoming less hawkish at the margin helped drive the ICE BofA MOVE Index, a measure of interest rate volatility, down more than 25% from its heights in early October through January 2023 (Figure 1). Escalating interest rate volatility bludgeoned securitized markets along with other duration‑sensitive2 assets throughout 2022, and its moderation near year‑end aided market liquidity and motivated skittish investors to selectively buy cheap bonds. However, participants exhibited a clear preference for more senior deal tranches with greater structural protections.
Moderation in Interest Rate Volatility Enabled Securitized Recovery
(Fig. 1) Volatility levels had neared March 2020 COVID peak before easing in late 2022
Past performance is not a reliable indicator of future performance.
December 31, 2019, through January 31, 2023.
Sources: Bloomberg Finance, L.P., and Intercontinental Exchange, Inc. (ICE). See Additional Disclosures.
The ICE BofA MOVE Index measures the normalized implied volatility on one-month Treasury options based on the weighted average of 2-, 5-, 10-, and 30-year maturities.
Returns Biased Toward Higher Quality
Securitized credit sectors generally produced positive total returns in Q4, benefiting from Treasury rates stabilizing after climbing at a breakneck pace for much of the year. Although spreads tightened toward the end of the quarter, excess returns relative to similar‑duration Treasuries were generally negative and significantly lagged corporate credit. Looking at the four major U.S. sectors:
- Asset‑backed securities (ABS) generated total returns of 0.81% in Q4 but trailed comparable Treasuries by 0.20% as spread tightening in December was insufficient to make up for earlier widening.3 ABS with non‑AAA credit ratings4 notably lagged the highest‑rated ABS on an excess return basis, a trend that persisted over the full year.
- Non‑agency commercial mortgage‑backed securities (CMBS) returned 0.79% in Q4 at the broad index level, but returns varied widely across the quality spectrum.5 AAA rated CMBS outpaced comparable Treasuries by 0.12%. In stark contrast, BBBs underperformed Treasury counterparts by a gaping margin of 3.75% as investors remained trepidatious about commercial real estate risk. For the year, CMBS recorded negative total and excess returns across the board, though BBB rated issues were by far the worst performers from both perspectives as investors were unwilling to climb down the CMBS quality ladder.
- Collateralized loan obligations (CLOs) posted quarterly returns of 3.03%.6 This pushed returns for the CLO index into positive territory for the 12‑month period (+0.21%), earning the distinction of being one of the few financial assets to manage gains in a lamentable year. Unlike ABS and CMBS, lower‑rated CLOs led the way in Q4, a reversal of the trend over the full year. AAA rated CLOs gained an impressive 1.05% in 2022, while tranches below the senior level lost value. Even so, lower‑quality CLOs notably held up better than most other fixed income sectors in a treacherous interest rate and credit risk environment.
- Non‑agency residential mortgage‑backed securities (RMBS), a diverse market that lacks a comprehensive benchmark, produced mixed results. Credit risk transfer securities (CRTs),7 among the more liquid securitized credit segments, had a strong quarter, particularly in November and December as risk appetite strengthened on hopes that the Fed will pivot in time to avoid a deep recession. Prime jumbo RMBS, like government‑backed agency MBS, benefited from lessened interest rate volatility and enjoyed a bounce at the end of an ugly year. The nonqualified mortgage (non‑QM) subsector, which was battered in 2022 by the rate spike and technical challenges, recovered a bit near year‑end as cheap valuations enticed investors. But this was not enough to make up for material spread widening in October.
Issuance Fell in 2022, Expected to Decline Further in 2023
Gross issuance across the four major U.S. securitized credit sectors totaled USD754 billion for 2022, down 27% from 2021’s phenomenal totals.8 Although lower year‑over‑year, issuance volumes still exceeded the yearly averages seen before the global pandemic. The heavy supply, combined with record outflows from taxable bond funds9 and dealers’ reluctance to take on more balance‑sheet risk in a high‑volatility environment, created both technical and liquidity challenges for securitized markets.
RMBS saw the largest percentage decline in issuance for the year (‑41%), though the CRT and non‑QM subsectors bucked the trend and were hit with increased supply—a factor that weighed on their performance. CMBS had a smaller 31% decline, with each of the market’s subsectors experiencing lighter volumes following a record‑setting 2021. CLO new issuance fell 29% from 2021, but at USD 130 billion, it was still the second‑highest yearly volume ever. ABS led securitized credit markets with USD 243 billion in issuance, down 9% from 2021. Within the ABS sector, lower auto and student loan issuance was offset by a significant increase in credit card securitizations.
Looking ahead, supply technicals should become more of a tailwind for securitized markets in 2023. Gross issuance is expected to decline across the major sectors as higher rates and tighter financial conditions discourage issuance. RMBS issuance should fall further, driven by lower mortgage originations and refinancing activity. Additionally, higher funding costs will make securitizations uneconomic for many issuers. Likewise, higher commercial mortgage rates will probably discourage CMBS issuance, particularly in the first half of the year as the Fed keeps tightening. While floating rate single‑asset/single‑borrower (SASB) and commercial real estate CLO issuance are poised to drop, fixed rate conduit CMBS issuance could increase due to a growing wall of maturities over the next two to three years. Issuers will look to refinance ahead of maturity dates if they can.
ABS issuance is expected to decline more modestly. Auto, credit card, and equipment ABS issuance should be relatively steady barring a severe economic downturn. Smaller, esoteric segments of the ABS market could see a more meaningful slowdown given wider spreads and competitive valuations in more liquid assets. CLO issuance should also hold up fairly well as issuers possess warehoused loans that they need to offload. However, volumes will be dependent on conditions in the bank loan and broader risk markets. Demand dynamics will also be a factor in how much supply is brought to market, particularly the level of interest from foreign investors in countries like Japan as global rates and currency hedging costs fluctuate.
Fundamentals Deteriorating, With CMBS the Most Exposed
Fundamentals are worsening at a gradual pace, with the U.S. economy more likely than not to enter recession in 2023. In such an environment, we believe that strong bond pickers could be rewarded as fundamentals come under greater scrutiny. We remain confident in our credit analysts’ ability to select bonds that can endure an economic downturn and identify securities whose prices are dislocated from fundamentals. While the storyline in 2022 was dominated by interest rate and liquidity risk, we expect true fundamental credit risk to become the dominant narrative this year.
CMBS look most vulnerable from a fundamental perspective. Concerning factors include low debt‑service‑coverage ratios (a greater concern in the SASB space), an upcoming wave of maturities that will need to be refinanced at much higher interest rates, ensuing dilemmas when borrowing costs exceed the cash flows generated from properties, and situations where servicers agree to modify loans for struggling borrowers at the expense of bond investors. While we expect CMBS spreads to move wider, this will likely be a slow‑moving process. We anticipate increased tiering of valuations between different credits based on idiosyncratic factors such as the mix and quality of collateral, deal terms and structures, and the reputation of issuers, potentially creating opportunities to generate higher‑than‑market returns through bond selection.
For now, delinquencies on commercial mortgage loans remain relatively low but have ticked up. The conduit market had the highest delinquency rate in December, at 3.3%, more than double the rate of the generally higher‑quality SASB market.10 By property type, hotels and retail have the highest delinquency rates. But the office market has become a greater concern due to demand shifts that may be long‑lasting and the threat of recession, which would further destroy demand for office space. Our CMBS analysts see the potential for a 10% to 15% decline in commercial property prices and have steered us away from lower‑quality office deals. They have found select opportunities, however, in deals where they believe downside risks are appropriately priced.
In contrast with CMBS, ABS are more fundamentally supported, thanks to resilient U.S. consumers. With inflation more than offsetting wage gains, the savings rate has fallen far below the record‑high levels reached early in the pandemic. Yet the unemployment rate is historically low, and households—even those at the lower end of the income spectrum—still hold more savings than they did prior to the start of the pandemic, which should provide households with the wherewithal to meet near‑term debt obligations. As a case in point, delinquencies on prime auto loans have ticked up but still sit near the lower end of their range over the last 15 years.
In the bank loan market, a focus for CLO investors, the ratio of distressed loans and the default rate ended 2022 well below long‑term averages despite more burdensome financing costs and fading economic growth. Our high yield credit team, which our securitized team partners with to examine loan collateral, anticipates the loan default rate to normalize over the near to medium term to levels more consistent with the longer‑term average of around 3%.11 Credit rating downgrades for loans have also started to tick up relative to upgrades. This metric bears watching given that the majority of the loan market is B rated by the agencies, and CLOs have limits on how much CCC rated debt they can own. As such, downgrades could force CLO managers to sell loans for less than par value.
Not Anticipating a GFC Reprise in the Housing Market
Turning to the U.S. housing market, delinquencies have ticked up but are still at unconcerning levels, aided by a tight labor market. However, home prices nationally have been trending downward since peaking in June 2022, causing some observers to draw parallels to the period before the GFC.
While there are similarities between today’s market and that calamitous period—including low affordability, high levels of new housing supply, and stretched home prices—there are important differences in the eyes of our analysts. Namely, mortgage underwriting standards are much better than in the pre‑GFC period, both in terms of the credit quality of borrowers and in less risky mortgage products being offered by lenders. Additionally, servicers appear more willing to modify loan terms for borrowers experiencing delinquencies rather than pushing large numbers of borrowers into foreclosure. And there is still a shortage of housing units in the U.S. even after accounting for recently elevated new home supply.
This dynamic suggests that we are unlikely to see a wave of foreclosures battering the housing market and financial system like we experienced during the GFC. We believe we are also unlikely to encounter the same level of home price depreciation. Instead, the current downturn may more closely resemble the early 1980s when the Fed, under now‑revered Chairman Paul Volcker, embarked on an aggressive rate‑hiking campaign to tame inflation, similar to the situation the central bank is facing today.
Our team’s base-case forecast is for home prices to fall roughly 10% nationally, though there will likely be regional variations depending on how fundamentally overvalued local markets were. The team has also stress‑tested key segments of the RMBS markets, including those held by our platform, under this base-case scenario, as well as in a downside scenario like the GFC and in an upside scenario where prices hold steady. The team found that CRTs could be most adversely affected by a housing downturn, though the impact appears manageable for bonds sitting higher in the capital structure. There may also be a modest impact to single‑family rentals but little impact to most other RMBS subsectors, including prime, non‑QM, and re‑performing loans and reverse mortgages.
Valuations Remain Relatively Attractive
On the back of the rally in late 2022 and early 2023, valuations are less cheap than they were coming into Q4. But sector valuations, based on absolute spread levels, are still on the cheaper end of their ranges over the past five years. Valuations relative to investment‑grade and high yield corporate bonds also broadly remain attractive given recent corporate outperformance. However, we are mindful of downside risk, and in segments like CMBS, where credit deterioration is more pronounced, cheaper valuations are warranted. The violent spike in spreads in March 2020 is still etched in our minds and can serve as a guide for potential downside in a worst‑case risk‑off scenario. Current levels are well below that peak, particularly for ABS and RMBS.
While there certainly is downside risk if the economy tips into recession and fundamental deterioration accelerates, yields are well above their averages over the past 20 years, which includes the GFC. And coupon income should be able to provide an ample cushion against price declines caused by Treasury yields and/or credit risk premiums rising. For example, at the end of January, the Bloomberg ABS Index offered an average 4.8% yield to maturity with 2.9 years of duration. This yield‑to‑duration ratio suggests that yields would need to rise by almost 1.7 percentage points over a 12-month period before capital losses fully erased income gains.
Based purely on relative value, CMBS and CLOs offered the widest nominal spreads at the time of this writing. But, as noted, we are less keen on CMBS from a top‑down perspective due to fundamental deterioration being most pronounced in that sector. Valuations for ABS and RMBS are more neutral overall, though those sectors’ fundamentals are generally in better shape than CMBS.
- CLOs are currently the most attractive sector, in our view, based on the combination of relative value, fundamental credit support, liquidity, and technicals. But in a late‑cycle environment, our preference is for the two highest‑quality tiers (AAA and AA). CLOs offer attractive coupon carry, and their floating coupons should continue to rise in the near term with higher policy rates lifting short‑term money market rates. However, that dynamic could reverse toward the end of the year if a recession forces the Fed to cut rates.
- We see attractive relative value in parts of the RMBS sector, which could potentially benefit the most from a Treasury rate rally scenario in 2023 following the rate rout last year. If mortgage rates continue to pull back from their highs, prepayment rates should increase from very low levels, pulling forward principal repayments. Technicals appear very positive for the sector, with forecasts calling for possibly half of the issuance that came to market last year (which was down significantly from 2021). Areas that we like presently include subordinate single‑family rental and non‑QM bonds, senior reverse mortgage bonds, and select CRTs. The biggest risk for RMBS is the reemergence of rate volatility, which could cause a further deterioration in fragile liquidity.
- In ABS, the highest‑quality bonds led in the late‑2022/early‑2023 rebound, causing their valuations to become less cheap (but still attractive from a historical perspective). As such, subordinate ABS looked more compelling in terms of relative value. Subordinate auto lease and loans, equipment, and mobile phone‑backed bonds are among the areas piquing our interest.
Aligned with our cautious view on the CMBS sector, in the conduit space, we are favoring bonds at the senior or junior AAA level of the capital structure. We see select opportunities in lower‑rated short‑term conduit deals backed by very strong credit pools and with limited maturity extension risk. We also like select lodging SASB bonds, idiosyncratic office bonds that have been unfairly punished by the negative headlines about commercial real estate, and select deals where our analysts believe there is a chance of an early refinancing or paydown due to bond‑specific factors.
Past performance is not a reliable indicator of future performance.
1 Credit spreads measure the additional yield that investors demand for holding a bond with credit risk over a similar-maturity, high-quality government security.
2 Duration measures the sensitivity of a bond’s price to changes in interest rates. Bonds with longer duration have higher sensitivity to changes in interest rates.
3 As measured by the Bloomberg ABS Index.
4 Credit ratings for securities are typically provided by Moody’s, Standard & Poor’s, and/or Fitch and are referenced here in Standard & Poor’s nomenclature. A rating of AAA represents the highest-rated securities, and a rating of D represents the lowest-rated securities. T. Rowe Price maintains its own proprietary credit rating methodology for all securities held in portfolios.
5 As measured by the Bloomberg Non-Agency Investment Grade CMBS: Eligible for U.S. Aggregate Index.
6 As measured by the JP Morgan Collateralized Loan Obligation Index (CLOIE).
7 Credit risk transfer securities are a type of MBS issued by Fannie Mae and Freddie Mac but with the credit risk borne by private investors. They can incur losses if enough homeowners in a pool of mortgages default on their loans.
8 Source for ABS, CLO, CMBS, and RMBS issuance totals: JP Morgan. All totals in U.S. dollars as of December 31, 2022.
9 Morningstar reported USD 216 billion in outflows from all U.S. taxable bond mutual funds and exchange-traded funds in 2022, the most since its records began in 1993.
10 Source: JP Morgan.
11 According to data from JP Morgan, the average annual default rate for loans over the 24-year period ended in 2022 was 2.9%.
Download PDF
Authors
Christopher Brown, CFA
Head of Securitized Products, Fixed Income Portfolio Manager
Ramon de Castro
Sector Portfolio Manager, Securitized Credit
Additional Disclosures
“Bloomberg®” and the Bloomberg ABS and Bloomberg Non‑Agency Investment Grade CMBS: Eligible for U.S. Aggregate indices are service marks of Bloomberg Finance L.P. and its affiliates, including Bloomberg Index Services Limited (“BISL”), the administrator of the index (collectively, “Bloomberg”) and have been licensed for use for certain purposes by T. Rowe Price. Bloomberg is not affiliated with T. Rowe Price, and Bloomberg does not approve, endorse, review, or recommend this product. Bloomberg does not guarantee the timeliness, accurateness, or completeness of any data or information relating to this product.
Information has been obtained from sources believed to be reliable, but J.P. Morgan does not warrant its completeness or accuracy. The index is used with permission. The index may not be copied, used, or distributed without J.P. Morgan’s prior written approval. Copyright © 2023, J.P. Morgan Chase & Co. All rights reserved.
ICE Data Indices, LLC (“ICE DATA”), is used with permission. ICE DATA, ITS AFFILIATES AND THEIR RESPECTIVE THIRD-PARTY SUPPLIERS DISCLAIM ANY AND ALL WARRANTIES AND REPRESENTATIONS, EXPRESS AND/OR IMPLIED, INCLUDING ANY WARRANTIES OF MERCHANTABILITY OR FITNESS FOR A PARTICULAR PURPOSE OR USE, INCLUDING THE INDICES, INDEX