“A Río Revuelto, Ganancia de Pescadores”
- Mexican Proverb
Private equity investors in Latin America (“Latam”) today stand to learn a valuable lesson from an old Mexican proverb that is well known to fishermen – there is good fishing in troubled waters.
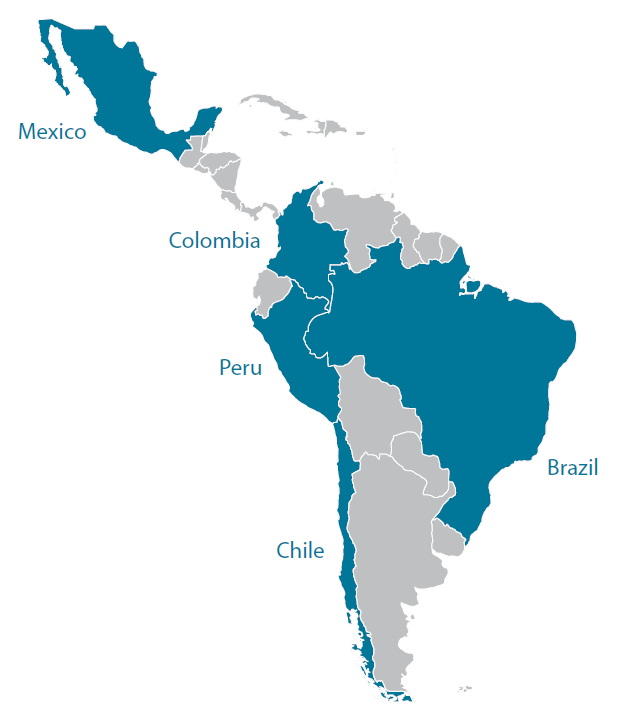
As with many of the emerging markets, Latam economies are experiencing significant headwinds. The five Latam countries in which private equity is largely concentrated, Brazil, Mexico, Colombia, Peru and Chile (collectively the “Principle Latin American Economies” or “PLAE”), have experienced cuts in their 2015 and 2016 GDP forecasts of 0.5%-2%. These countries, highlighted in Figure 1, are home to private equity investors because they offer some combination of investor-friendly policies, economic and political stability, and scale. With a population of 428 million, the PLAE currently represent approximately 6% of the global population. Its combined GDP of US$4.5 trillion is equivalent to approximately 6% of global GDP, up from 4% in 2004.1 Further, over the last decade, the PLAE have become increasingly integrated with the global economy – this process continues at an accelerated pace, particularly through the Pacific Alliance, which excludes Brazil and includes Costa Rica, and has earned the nickname of “Pacific Pumas.”
While macroeconomic issues create near-term turbulence in these economies, StepStone believes that longer-term growth in consumer demand, driven by demographic realities and supported by sound economic reforms, will yield pockets of strong, sustainable growth, creating unique opportunities for private equity investors. The region is home to a number of experienced, well-funded private equity managers, and StepStone believes that these managers will be able to recognize these opportunities and craft innovative solutions to capitalize on them.
Macroeconomic Backdrop
After experiencing a decade of strong growth, Latin America is now traversing difficult economic times. Across the PLAE, 2015 GDP growth estimates are lower than they were at the beginning of the year. In general, policy is shifting from excessive stimulus towards more austere monetary policy and supply-side investment focus. The region, similar to most emerging markets, is generally suffering from devalued currencies, lower fiscal collection, and reduced hard currency revenues from commodity exports. Non-commodity exports, on the other hand, are benefiting from the weaker currencies and becoming more competitive.
While Latam countries share many cultural, demographic and developmental characteristics, it is important to keep in mind that different parts of the region are experiencing very different economic realities. Although slower global growth and depressed commodity prices are impacting each of the PLAE countries, the current economic health and outlook for each of Mexico, Brazil and the Andean region (Peru, Chile and Colombia) is quite different.
FIGURE 1 | PRINCIPLE LATIN AMERICAN ECONOMIES
Brazil, Mexico, Colombia, Peru and Chile form the core of private equity in Latin America.
Mexico, which should grow over 2% in 2015 despite lingering sluggishness in domestic demand, is benefiting from a “zip code boost” – a reference to Mexico’s proximity and correlation to the US economy – created by the US recovery and from recently implemented investor-friendly structural reforms.
Brazil’s economy, by contrast, is expected to shrink by approximately 3% in 2015. The country is suffering from rising unemployment and inflation as the government struggles to balance the budget, compensating for overly loose fiscal and monetary policies during the first mandate of President Dilma Rousseff.
The Andean countries are least impacted, having implemented more prudent policies over the last four years; these countries are poised to grow at 2% to 3% despite the significant drop in copper and oil prices.
WELL POSITIONED TO FACE HEADWINDS
Sound fiscal and monetary policies implemented in the late 1990s and early 2000s, combined with increased Chinese demand, resulted in budget surpluses, declining inflation, increased foreign direct and portfolio investment, debt reduction and a rapid accumulation of foreign reserves across Latin America. The recent declines in commodity prices and Chinese slowdown, however, have begun to affect capital flows. Nonetheless, the PLAE are better equipped than at any time in the last three decades to withstand these economic headwinds. Brazil, which was too generous with its countercyclical economic policies in 2010-14, will see another 12 to 18 months of GDP contraction as corrective measures are put in place. But even Brazil is faring much better today, despite these missteps, than it did in the recurring financial
crises of the 1980s through early 2000s.
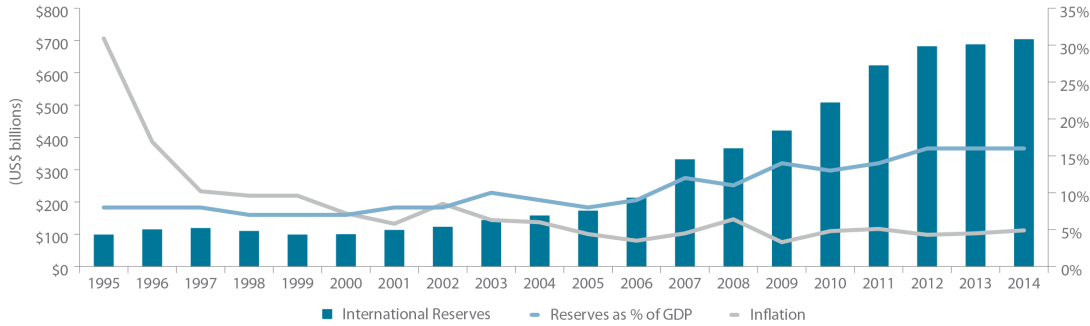
Exchange rates are an obvious cause of concern – as in all emerging markets – but current levels combined with balanced investment pacing should provide an attractive entry point. In addition to cheaper assets, weak currencies also suggest more globally-competitive economies. PLAE foreign reserves are at or near record levels, as shown in Figure 2, giving governments more leeway to pursue growth-oriented policies.
FIGURE 2 | TRENDS IN PLAE FOREIGN EXCHANGE RESERVES AND INFLATION
Source: IMF & World Bank data.
POLITICAL STABILITY
Latin America has no ethnic, religious or cultural divides. The region emerged from the dictatorship model in the 1980s and, for the most part, consists of maturing democracies. The PLAE have demonstrated clear commitment to prudent, orthodox economic policies. They also have well-established judiciary systems and functioning rules of law. In most cases, power has alternated between center-right and center-left governments with minimal interference on long-term economic policy, the private sector and free flows of capital.
By contrast, the political “outliers,” which include countries such as Venezuela, Ecuador, Nicaragua, Argentina and Bolivia, have received very little foreign investment over the last decade. Although populist and left leaning, the governments in these countries have little propensity to export their political models – particularly given the troubled state of their economies.
Positive Elements for Private Equity
There are a number of circumstances in Latam that are contributing to a favorable environment for private equity investing in the region.
ATTRACTIVE DEMOGRAPHICS
Although maturing gradually, Latin America’s demographics, as shown in Figure 3, ensure a steady supply of new entrants to the work force over the foreseeable future, and compare favorably with North American demographics. The relative youth of the population guarantees labor force expansion, which will drive wealth creation, a dynamic similar to the US after the Second World War, where an expanded labor force resulted in a sustained period of strong economic growth. Herein lie the key drivers that have been and will continue to create private equity opportunities in the overall region and particularly in the PLAE.
FIGURE 3 | 2014 POPULATION AGE BREAKDOWN
Source: U.S. Census Bureau.
GROWING MIDDLE CLASS
The policy reaction to multiple debt crises, aided by the commodity super cycle fueled by Chinese demand, brought on improved macroeconomic management and performance throughout the PLAE. These policy reforms created much-needed stability and economic growth, which in turn drove increases in standards of living.
The turn of the century witnessed rapidly diminishing unemployment and a general improvement of purchasing power for PLAE citizens. As economies improved, almost 70 million people transitioned from poverty and the low-income range to the middle class.2 Between 2000 and 2010, the middle class increased from approximately 50% to 70% of the population. This trend is expected to continue through 2020. Figure 4 shows the declining poor and low income classes relative to the affluent and middle classes across the PLAE.
FIGURE 4 | EXPANDING MIDDLE CLASS IN PLAE

Source: BBVA.
*Projected.
Peru, and to a lesser extent Colombia, the economies with the lowest real GDP per capita in the PLAE, have posted the highest growth rates in the last few years and are expected to continue to grow their lower middle classes over the course of this decade and generate a degree of local consumption unseen to date. Brazil and Mexico, the two most populous countries in the PLAE, are expected to experience a boost in their middle and affluent classes, reaching approximately 80% and 85% of their respective populations by 2020. Chile, slightly ahead of the pack, already made notable progress in the early 2000s.
Regardless of economic cycles, the new middle class has established itself as an important driver of the PLAE with its particular and increasingly sophisticated consumption patterns. The Industrial and Service sectors are prioritizing the new middle class to capture growth in excess of the overall economy. The new middle class comprises increasingly educated voters that will look to defend their newly acquired status. It is unlikely this genie will go back in the bottle.
As we have seen in other emerging economies, increased consumption has caused a shift in spending patterns and is expected to continue to drive greater demand for services across the PLAE. These tectonic shifts in consumption patterns create opportunities to tap into growth within defensive sub-sectors or strategies, even when the macroeconomy is sluggish.
INCREASING DISPOSABLE INCOME
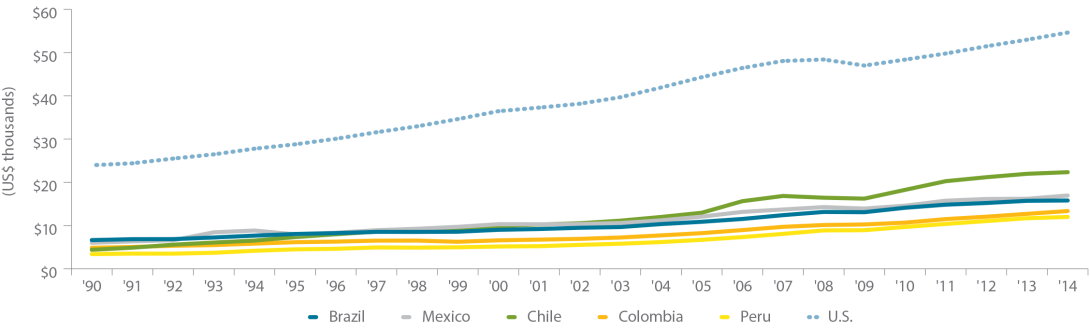
The evolution of per capita GDP in the region has been impressive even though it is still a fraction of US per capita GDP, as shown in Figure 5. Higher disposable incomes have created demand for not only increasingly sophisticated consumer products, but also services, such as health and education, for which government-provided alternatives are weak. Additional demand and continued growth in per capita GDP will require major investments that will create direct and indirect private equity opportunities.
FIGURE 5 | GDP PER CAPITA BASED ON PURCHASING POWER PARITY
Source: World Bank data.
INFRASTRUCTURE DEFICIT
The World Economic Forum’s Global Competitive Report ranked Brazil’s quality of overall infrastructure 114 out of 148. Colombia and Peru also ranked in the bottom half at 117 and 101, respectively, while Mexico was placed 66 and Chile came in at 45. Overall, investments in infrastructure in the region have not kept pace with demand, resulting in a significant deficit.
This repressed demand is likely to provide substantial gains for private equity and infrastructure investors. High levels of expected regional infrastructure investment are also likely to drive tangential opportunities among infrastructure service providers. As projects are executed, other businesses will benefit from more efficient infrastructure, enabling Latin American businesses to become more competitive globally, which will drive further growth.
Completed infrastructure projects are of high political value to local governments. The recognition of the need to attract capital for these investments is driving reform, making the environment for foreign direct investment (“FDI”) more attractive.
The obvious questions to ask when the public sector is involved are whether effective investments will be made, and over what timeframe. Specific initiatives across the PLAE and the point of the economic cycle in which the region finds itself suggest that great efforts are being made and will likely continue to be made on both the regulatory and bureaucratic fronts to secure and streamline infrastructure investments, with increasing emphasis on FDI.
The Brazilian government alone has identified over US$300 billion of private sector infrastructure investments to be executed over the next five years, including 12,000 kilometers of railways, 7,000 kilometers of roads, 15 ports, 32,900 gigawatts of power-generation capacity and 23 kilometers of transmission lines.
The Mexican Ministry of Finance announced a 2014-2018 infrastructure plan worth US$596 billion, of which 40% is to be funded by the private sector. In Colombia and Peru, US$46 billion of private sector infrastructure projects have been identified for prompt execution.3
The potential for corruption in greenfield concessions, of course, is always a concern for investors. In light of the highly public Petrobras scandal – and its very real consequences among business leaders and politicians – the trend is clearly towards greater transparency.
The dislocation caused by the Petrobras corruption scandal has affected major players in the sector, who are selling a significant number of assets, including performing assets, causing downward pricing pressure on the sector and region as a whole. Petrobras alone is expected to sell over US$60 billion in assets over the next fund cycle. StepStone believes that private equity investors have a unique opportunity to lock in attractive risk-adjusted returns in infrastructure investments in the region, particularly in Brazil.
ASSET VALUES
Equity valuations have historically been relatively attractive in Brazil. The 10-year average forward price-to-earnings ratio on the BOVESPA stock exchange is 9.9x compared to 11.0x for the MSCI Emerging Markets Index, 13.0x for the MSCI All Country World Index, and 13.8x for the S&P 500 Index.4
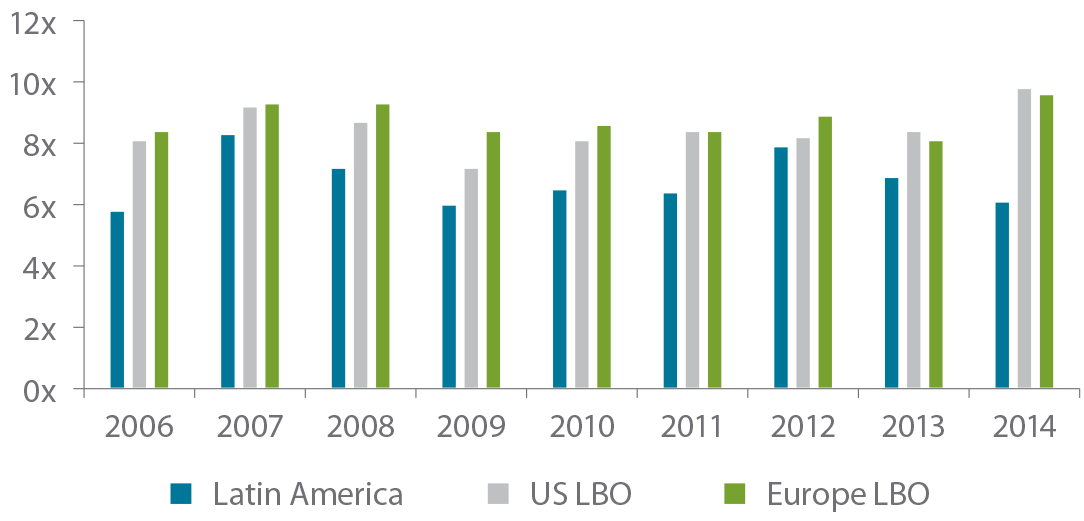
StepStone compared data on private equity entry multiples from 139 Latam transactions in its proprietary SPI database from 2006-2014 to LBO entry multiples in the US and Europe tracked by S&P Capital IQ. On average, Latam managers have transacted at significant and consistent discounts to both markets, as shown in Figure 6. Currently multiples of 4x to 6x EBITDA are not uncommon in Middle Market transactions, and leverage is significantly lower than developed markets, seldom going over 3x EBITDA.
FIGURE 6 | AVERAGE PRIVATE EQUITY ENTRY EV/EBITDA MULTIPLE
Source: StepStone SPI database, S&P Capital IQ, Leveraged Buyout Review 1Q 2015.
The Brazilian recession has ushered in higher inflation and interest rates, a closing of the IPO window and rising unemployment; it is having a sobering effect on pricing expectations of private equity sellers, creating a buyer’s market. Considering that Brazil has been historically responsible for 60% to 75% of private equity investment in Latam, it tends to dictate asset value benchmarks for the rest of the region.
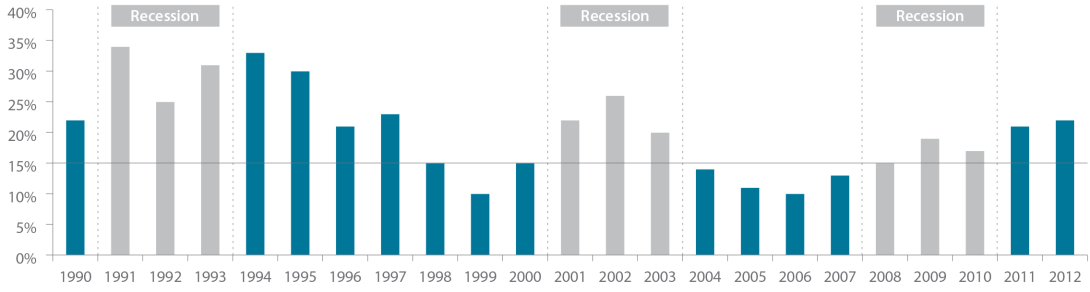
We have seen what happens when recessionary macroeconomic factors make capital scarce: top quartile private equity funds do extremely well. Figure 7 shows that in the US, recessions tend to generate multiple vintages of top quartile returns greater than 15%. Lower entry valuations, tighter credit markets, and greater opportunity for GPs to add value are key reasons why investors in top quartile private equity funds are more highly rewarded in a recessionary environment. While past results are no guarantee of future performance, StepStone thinks that there is little reason to believe that the situation in Latam should be any different. Prices tend to be down when uncertainty is high; but patient capital, that can be active in managing assets better, is usually rewarded for fishing in these troubled waters.
FIGURE 7 | UNITED STATES TOP QUARTILE BUYOUT IRR
Source: Thomson Venture Economics data.
CURRENCY
While hedging private equity currency risk is generally not worthwhile in emerging markets, the recent appreciation of the US dollar against Latam currencies – particularly the Brazilian real and the Colombian peso, which StepStone believes were most overvalued – suggests an attractive entry point in the currency cycle. Many managers use the strategy of staging their investments against the achievement of milestones, which also helps dilute foreign exchange risk by “dollar cost averaging” on entry. The majority of Latam’s assets under management (“AUM”) is in US dollar-based funds, which ensures that managers are sensitive to currency risk.
REGULATION
Private equity is a highly desirable foreign investment because, unlike “hot money,” it is capital that stays for the long term and also tends to bring expertise with it. Regulators have, therefore, proven eager to create an enabling environment for investors and the industry. Multiple private equity friendly initiatives by regulators and development finance institutions (“DFIs”) have benefited the industry and strengthened the manager base over the last 20 years, as illustrated in Figure 8.
FIGURE 8 | REGULATORY CHANGES IN THE PLAE

Source: StepStone analysis.
LOW PRIVATE EQUITY PENETRATION
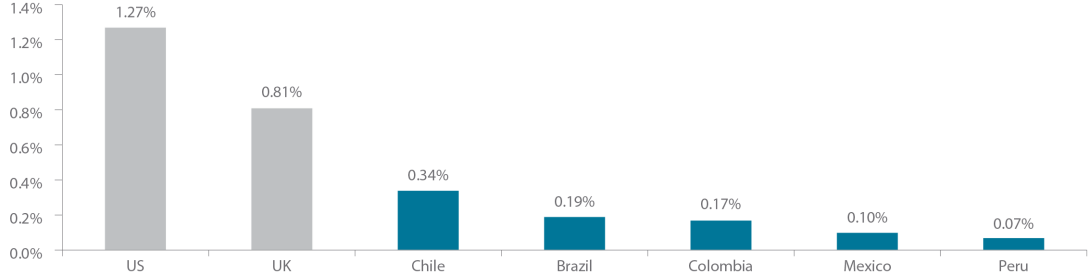
The low penetration rate of private equity in the PLAE relative to more developed countries, as shown in Figure 9, illustrates the potential for growth of private equity in the region. Moreover, private equity investments in Latam still represent a fraction of total M&A value in the region – 6% in 2014.5 This points to the strong potential for expansion relative to both GDP and market share.
Low penetration combined with the fragmented nature of the economies effectively translates into low levels of intermediation. Being primarily a growth equity industry, private equity deals tend to be about partnerships with entrepreneurs rather than auctions. In this context, the purchase price is often not the only consideration; therefore, the intermediary’s role is diminished. This means that successful GPs must dedicate significant resources to sourcing deals and building relationships with families and entrepreneurs, a dynamic that favors truly local managers, who have teams on the ground and spend 100% of their time focusing on their local markets.
FIGURE 9 | PRIVATE EQUITY PENETRATION AS A PERCENTAGE OF GDP
Source: Empea, LAVCA Industry Report 2015, World Factbook.
As of 2014.
1 The World Bank Data, 2014 World Development Indicators.
2 BBVA.
3 McKinsey Global Institute, Macquarie and Ashmore.
4 MSCI, JP Morgan Market Insights Research – Brazil First Quarter 2015.
5 LAVCA, Mergermarket Group.
Read the full article here
This document is for information purposes only and has been compiled with publicly available information. StepStone makes no guarantees of the accuracy of the information provided. This information is for the use of StepStone’s clients and contacts only. This report is only provided for informational purposes. This report may include information that is based, in part or in full, on assumptions, models and/or other analysis (not all of which may be described herein). StepStone makes no representation or warranty as to the reasonableness of such assumptions, models or analysis or the conclusions drawn. Any opinions expressed herein are current opinions as of the date hereof and are subject to change at any time. StepStone is not intending to provide investment, tax or other advice to you or any other party, and no information in this document is to be relied upon for the purpose of making or communicating investments or other decisions. Neither the information nor any opinion expressed in this report constitutes a solicitation, an offer or a recommendation to buy, sell or dispose of any investment, to engage in any other transaction or to provide any investment advice or service.
Past performance is not a guarantee of future results. Actual results may vary.
Each of StepStone Group LP, StepStone Group Real Assets LP and StepStone Group Real Estate LP is an investment adviser registered with the Securities and Exchange Commission (“SEC”). StepStone Group Europe LLP is authorized and regulated by the Financial Conduct Authority, firm reference number 551580. Swiss Capital Invest Holding (Dublin) Ltd (“SCHIDL”) is an SEC Registered Investment Advisor and Swiss Capital Alternative Investments AG (“SCAI”) (together with SCHIDL, “SwissCap”) is registered as a Relying Advisor with the SEC. Such registrations do not imply a certain level of skill or training and no inference to the contrary should be made.
Manager references herein are for illustrative purposes only and do not constitute investment recommendations.