DWS
Bernard F. Ryan, CFA
Insurance Coverage
bernie.ryan@dws.com
617-295-2105
dws.com/InsuranceAM
875 Third Avenue
New York, NY 10022


Insurers globally have grappled with low interest rates for the past decade. Low yields have been a challenge for money managers globally, but arguably more so for European insurance companies. In the hunt for yield, many insurers in Europe have chosen to take on more credit and/or liquidity risks in their fixed income portfolios by investing into lower rated bonds or by moving into private debt. Others have started to look for opportunities in the US dollar investment grade space, potentially offering a yield pick-up after currency hedging as well as diversification benefits without necessarily sacrificing credit quality or liquidity.
Over the last years, a maturing subset of the US dollar fixed income market has gained particular interest among insurance companies, namely USD-denominated bonds issued by Asian issuers. Besides offering attractive fundamental features, Asian investment grade bonds may also provide superior capital-adjusted returns under Solvency II. The recent interest in the asset class by European insurers has also been driven by its resilient performance during the Covid-19 crisis as well as by the significant decrease in FX hedging costs for Euro-based investors.
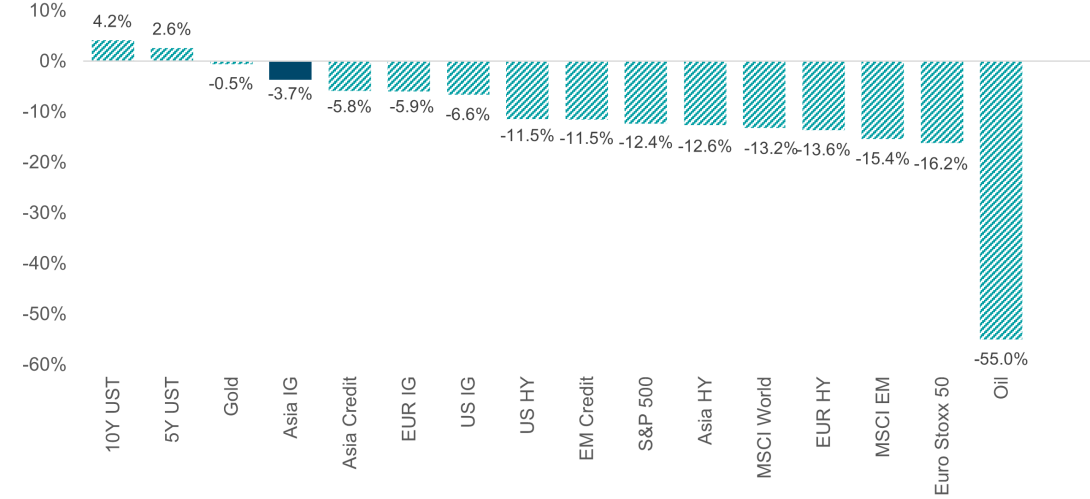
The growing stability of Asian Investment Grade (IG) Credit has been appreciated by Asia-based investors for some time with rising participation from in-region investors over the recent years (see Chart 1.). Outside of Asia however, the asset class has often been overlooked by global investors drawn to regions like Latin America, where historically yields have on average been higher[1]. Indeed, the persistent under-allocation to Asia relative to its market weight in emerging market indices has been a striking feature of many global emerging market portfolios (see Chart 2.). The relatively smooth functioning of the investment grade portion of Asian credit markets through the Covid-19 induced sell-off in March 2020 has however, reinforced a trend to allocating to Asian IG credit on a stand-alone basis. Indeed, while not completely immune to the unfolding crisis, Asian IG credit fell just -3.7%[2] in March 2020 (see Chart 3.), significantly better than almost all other major fixed income components, with the exception of treasuries.
Chart 1: JACI Investment Grade: New Issue Allocation by Region
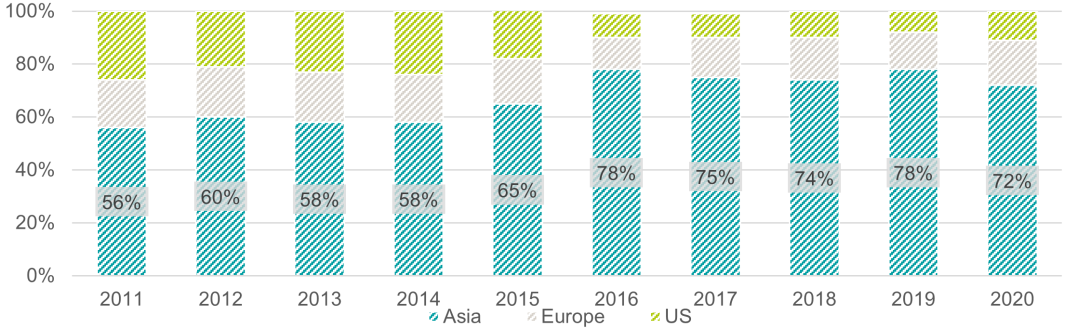
Chart 2: Regional allocation of EM Corporates Within EM Funds vs CEMBI Index
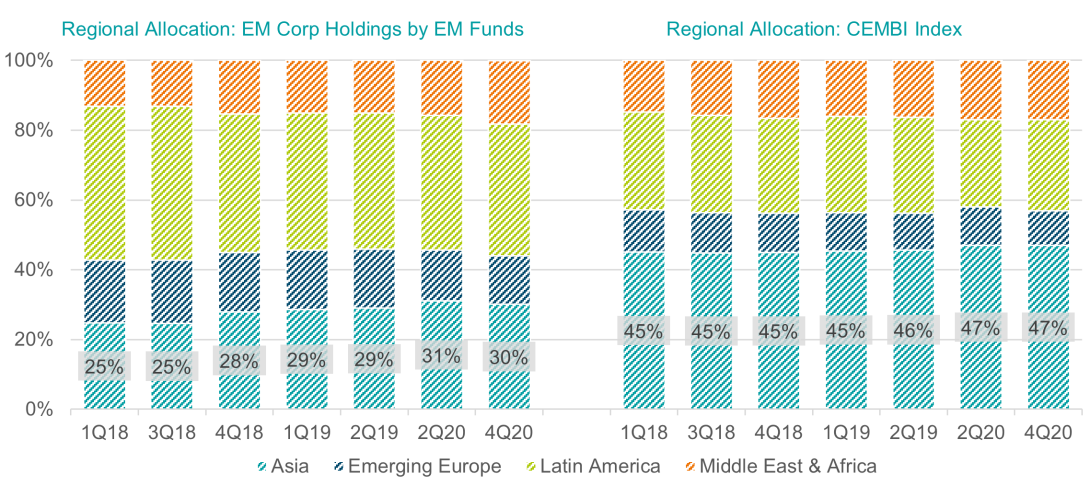
Chart 3: Total Return of Major Asset Classes During the Sell-Off in March 2020
Today, the size of the dollar-denominated Asian credit market is more than US$1.2 trillion[3], having grown at an annualised rate of approximately 20%[4] since the Global Financial Crisis. This growth is even more impressive when looking at corporate bonds in isolation, with Asia accounting for 83%[5] of the total growth in external EM corporate debt stock since 2014.
The rapid growth of the Asian credit market can largely be attributed to the expansion of investment grade issuance, which accounts for more than three-quarters of the JPM Asia Credit Index (“JACI”). The Asian IG credit market is now over US$900 billion in size which represents approximately a 9-fold increase since the GFC. The growth of Asia’s investment grade market is partly a reflection of Asia’s continued economic development and the corresponding improvements in sovereign credit ratings of several key markets like Indonesia, the Philippines and India which have attained investment grade status at the sovereign level.
We believe further growth in market size can be expected, in part because demographic dynamics demand it.Asia accounts for 45% of global GDP[6]. With the region’s household incomes among the fastest growing of emerging markets and a savings ratio well above the global average, Asian households are becoming an increasingly powerful investor constituent. As with other established markets, investors in the first instance have tended to look to their home regions for investment options. At the same time, population aging has occurred more rapidly in Asia. Both dynamics should be supportive for bond markets in Asia as in-region savers rotate into income bearing securities.
The “Asian” Bid
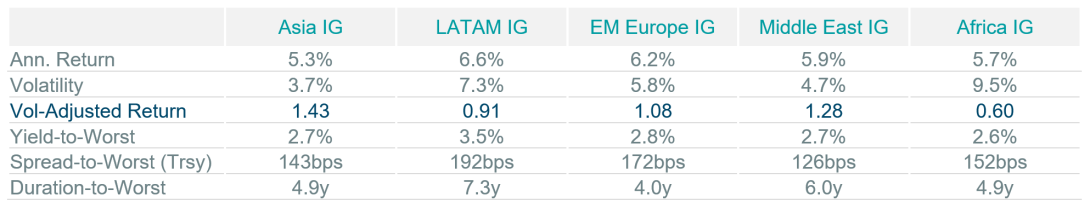
Asia-based investors are by far the largest buyers of new Asian investment grade credit, taking up 72%[7] of total new issue supply in 2020. On balance, we believe the predominantly local investor base has been a source of stability historically, helping to backstop the asset class when hot money flows have turned negative. This is likely one reason behind the region’s historically lower realised volatility and better risk-adjusted returns when compared to other EM regions, which don’t necessarily enjoy the same degree of in-region investor support (see Chart 4.).
Low Interest Rates
With policy rates in developed market economies seemingly anchored, at least over the near term (witness for example the US Federal Reserve’s recent suggestion that interest rates are unlikely to be increased till 2024 at the earliest), even small valuation differentials are likely to be of interest with the global stock of negative yielding debt reaching beyond US$12 trillion[8], with a further US$15 trillion of assets offering between 0-50bps[9]. In this context, the current spread premium of 72bps[10] offered by Asia IG over equivalent US IG debt, is not insignificant and is towards the upper end of the historical range (the range between the two was c.7 - 88bps[11] over the last 3 years).
Chart 4: Historical Risk-Return Profiles of Asia IG vs Other EM IG Regions

Beyond the growth in market size, the structure of the Asian investment grade credit market has changed materially over the years. Per table 1., there are more than four times as many issuers in the market today compared to 2006, whilst the weighting of the top 20 issuers has shrunk from 63.8% to 40.0%, resulting in a far more diversified market, dominated by corporate issuers. The inclusion of new markets such as Indonesia, Philippines, Taiwan and Macau, which combined represents 18.5%[12] of the JACI IG index has further diversified the opportunity set.
Table 1: JACI Investment Grade Index – Comparing 2006 & 2020
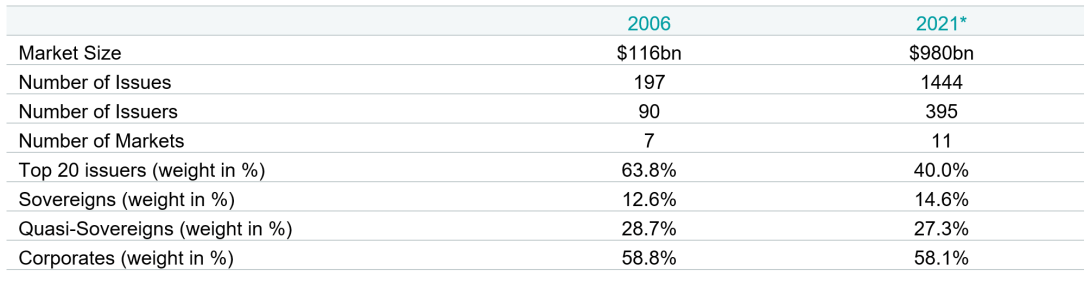
For investors in Europe and elsewhere, the composition of Asian credit markets offers the prospect of increased sectoral and issuer diversification, offering access to relatively larger Real Estate and Energy sectors, and an expanding TMT sector, which has quickly grown to represent 7.1%[13] of the Asian IG market.
While China remains the indispensable component of Asian credit markets and boasts a range of world-leading technology and industrial groups, there also remains approximately $498bn in investment grade bonds outstanding from Asia ex China (from 674 issues by 170 issuers[14]) from which to select.
Spread Pick-Up
Asian IG currently offers a spread pick up of 72bps and 74bps respectively over its US IG and EUR IG equivalents (see Chart 5.). While pockets of intransparency remain, in most respects Asian IG is increasingly demonstrating developed-market-like characteristics. Though spreads have tightened substantially since its peak in March 2020, Asian IG credit spreads remain wider relative to end-2019 levels and historical lows going back to 2011. In contrast, EUR IG and US IG spreads are now trading below pre-pandemic levels (as of 31.12.2019), and touching historical lows (see Chart 6.).
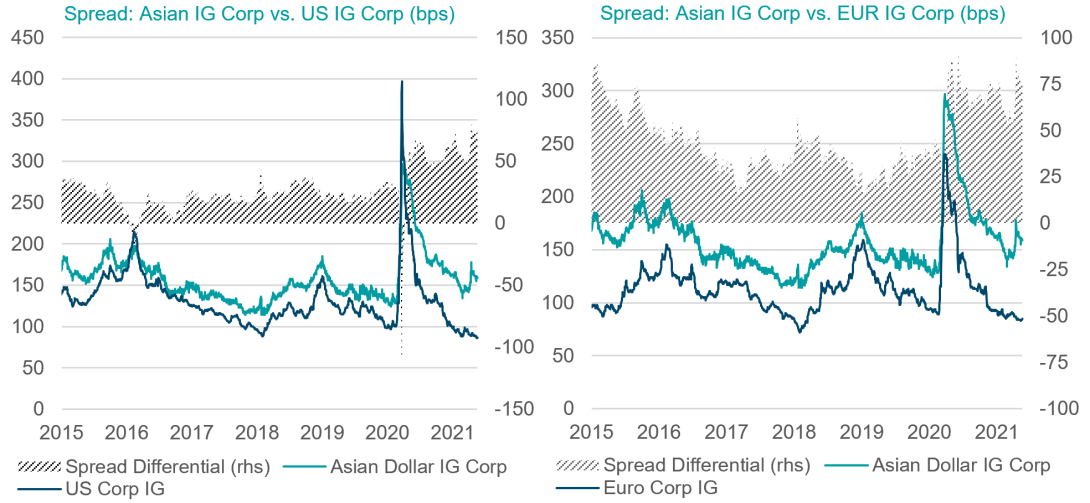

Spread Volatility
Spread volatility of Asian IG credit has fallen below US and EUR IG in recent years. Indeed spread volatility increased more sharply in both the US and Europe during the sell-off in March 2020, when compared to Asian IG credit.
Competitive Risk-Adjusted Returns
Since 2009, Asian IG credit[15] has delivered an annualized return of +4.7% p.a., comparable to US IG[16], +4.6% p.a. Asia has done so however, with lower volatility and as a result, yielded better risk-adjusted returns over the period. At an index level, the duration of the Asian IG credit universe at (5.4y) means investors are taking on less interest rate exposure per unit of yield when compared to US IG (8.1y).
For life insurers looking to immunize longer-dated liabilities, there remains a sizeable market at the long-end with ~$350bn of bonds having a tenor beyond 7yrs. Credit quality of a longer-dated Asia IG market remains robust, with a credit rating of A-. This could allow insurers with long-dated liabilities to potentially harvest the yield pick-up of Asia IG over US IG whilst maintaining credit risk charges.
Stable Credit Fundamentals
Fundamentals[17] for Asian IG corporates have strengthened in recent years, with net leverage at ~2.1x and cash position improving to ~35% of total debt as of end-2020. By comparison, US IG corporates have steadily increased their net leverage to ~2.7x[18] as of end-2020. While there was a weakening in profit margins in 2020, a robust new issuance market allowed many investment grade issuers to rebuild their balance sheets and ensure that near-term refinancing risks are likely to remain low. Interest service ratios have remained stable in line with lower borrowing costs and liquidity remains adequate[19]. Indeed, one of the more striking aspects of corporate Asia has been the tendency of corporate issuers to maintain higher cash balances, which has proven to be a boon given recent volatility.
Rating Migrations
Crucially for insurers, the number and volume of fallen angels[20] has been exceptionally low despite challenging conditions in 2020. Asian investment grade saw just US$5.2 billion of bonds downgraded to High Yield in 9M2020, equating to c.1.4% of total Asian investment grade stock. This is only marginally higher than the 10-year average of c.1.2%. In contrast, US IG and EM IG saw c.4.0% and c.9.0% of the market downgraded to high yield. This is particularly an important point for European insurers as downgrades would cause increased capital consumption under Solvency II. This may exacerbate capital requirements during times of market stress.
Potentially Lower impairments
In assessing risk metrics for the broader Asian credit market it is worth noting that within the high yield segment, Asia has experienced lower default rates and higher recovery rates when compared to its US equivalent. Despite challenging circumstances in 2020, the trailing 12-month default rate for Asia was 4.1%, as compared to 9.8% for the US[21]. In addition, Asia’s recovery rate historically has been amongst the highest of the various high-yield markets[22]. For insurers able to hold lower-rated credits this could potentially result in lower impairments for expected credit loss under IFRS 9.
Capital Efficiency under Solvency II
The average credit rating and duration of the Asian IG market is comparable to that of the Euro IG corporate market and both asset classes therefore are subject to a similar solvency capital requirement (SCR) for the spread risk under Solvency II. However, when taking into account the spread pick-up, Asian IG bonds offer a higher spread per unit of SCR which renders the asset class more capital-efficient. As outlined in Chart 7, our long-term capital market assumptions (LTCMAs) also support the superior capital-adjusted return over an investment horizon of 10 years which may render Asian IG bonds an interesting addition to insurers’ strategic asset mix.
CHART 7: DWS Long-Term Capital Assumptions for Selected Fixed Income Asset Classes
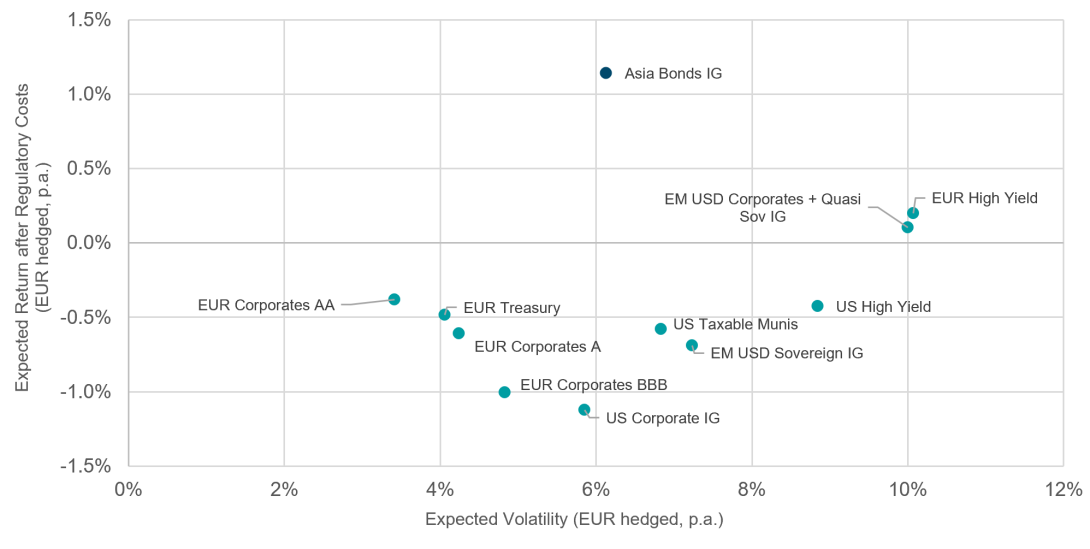
Also when compared to the US IG corporate bond market, Asian IG credit allows European insurers to harvest a yield pick-up whilst even enjoying a lower SCR for the spread risk due to a lower average duration (5.4y for Asia IG bonds vs. 8.1y for US IG equivalents).
Attractive FX hedging costs
Since their peak in late 2018, the costs for hedging US dollar exposures into Euro using short-term forwards have consistently reduced. Chart 8 shows the development of the annual hedging costs since 2015, split into the interest rate differential and cross-currency basis. A significant drop in hedging costs occurred with the start of the Covid-19 crisis in 1H2020 following the Federal Reserve’s rate cuts. Since then, the annualized hedging costs have remained at a fairly stable level of around 0.85%, far from their peak of almost 3.5% in 2018. This means that Euro-based investors could in theory currently obtain a yield after hedging costs of 1.80 %[23] p.a. on Asian IG compared to 0.41%[24] p.a. on Euro IG equivalents, resulting in a yield pick-up of 1.39% p.a.
CHART 8: Short-Term Hedging Costs USD-EUR, 02/01/2015 – 19/05/2021
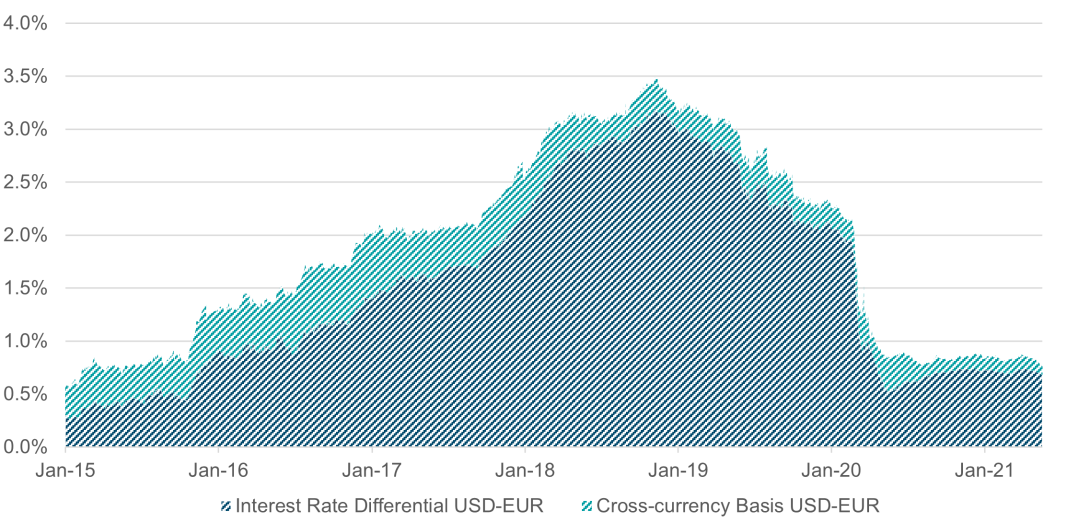
The picture looks similar for insurers based in the UK or Switzerland. Hedging costs have also reduced significantly since the start of the Covid-19 crisis and have remained fairly stable at 0.10% to 0.20% for GBP and 1.00% to 1.10% for CHF respectively.
Summary
Faced with persistently low interest rates, investors globally have had to adjust their asset allocations in order to maintain adequate returns and income levels. If the sell-off during the Covid-19 crisis proves to be an accurate indication, Asian IG certainly possesses the right ingredients to become a viable alternative to conventional developed market IG. This is particularly relevant for European insurers that are looking for a yield pick-up over local corporate bonds at an attractive solvency capital consumption.

Ronald Thoe
Fixed Income Specialist

Thomas Gillmann
Global Insurance Strategy & Advisory
[1] In the past 10 years, CEMBI Asia Yield to Worst (YTW) has consistently been lower than CEMBI Latin America YTW, with an average of 4.34% and 5.81% respectively. As of 30/4/21.
[2] JPM JACI Investment Grade Index, drawdown between 28/2/20 – 31/3/20
[3] JPM Asia Credit Index market cap, as of 19/5/21. Source: J.P. Morgan
[4] JACI Index market cap, CAGR calculated from 2008 – 2020. Source: J.P. Morgan, DWS Investments GmbH. As of 31/12/20.
[5] EM Corporate Bond Stock (Non Quasi). Source: J.P. Morgan, DWS Investments GmbH. As of 31/12/20.
[6] GDP for Asia Pacfic region based on purchasing power parity. World Economic Outlook, International Monetary Fund, April 2021.
[7] Source: Bond Radar, Bloomberg and J.P. Morgan. As of 31/12/20.
[8] Source: Bloomberg. As of 19/5/21
[9] Source: Bloomberg. As of 19/5/21.
[10] Asia IG = ICE BofA Dollar IG Corporate Index; US IG = ICE BofA US Corporate Index. Source: Bloomberg, DWS Investments GmbH. As of 19/5/21.
[11] Asia IG = ICE BofA Dollar IG Corporate Index; US IG = ICE BofA US Corporate Index. Source: Bloomberg, DWS Investments GmbH. As of 19/5/21. Excludes period between 9/3/20 – 7/4/20 where US IG temporarily offered a spread premium over Asia IG during the sell-off.
[12] Source: J.P. Morgan, DWS Investments GmbH. As of 19/5/21.
[13] Source: J.P. Morgan, DWS Investments GmbH. As of 19/5/21.
[14] Source: J.P. Morgan, DWS Investments GmbH. As of 19/5/21.
[15] JACI IG Index (Duration = 5.4y); Risk (volatility) is calculated with monthly total return data over 10 years, annualized. Period: 31/12/09 – 31/3/21. Source: DWS Group GmbH & Co. KGaA, Bloomberg, as of 31/3/21.
[16] Bloomberg Barclays US Agg Credit Index (Duration = 8.1y); Risk (volatility) is calculated with monthly total return data over 10 years, annualized. Period: 31/12/09 – 31/3/21. Source: DWS Group GmbH & Co. KGaA, Bloomberg, as of 31/3/21.
[17] Source: J.P. Morgan. “Asia Credit Outlook and Strategy – Reflation, Reflection and Repositioining”, as of 12/4/21.
[18] Source: J.P. Morgan. “US High Grade Credit Fundamentals”, as of 18/3/21.
[19] Source: J.P. Morgan. “Asia Credit Outlook and Strategy – Reflation, Reflection and Repositioining”, as of 12/4/21.
[20] Source: JP Morgan. “Asia Credit Conference 2020: Key takeaways and summary of panel discussions”, as of 22/10/20.
[21] Souce: BofA Global Research, as of 28/2/21.
[22] Souce: BofA Global Research, as of 31/3/21.
[23] Asia IG = ICE BofA Dollar IG Corporate Index; Source: Bloomberg, DWS Investments GmbH. As of 19/5/21.
[24] EUR IG = ICE BofA EUR Corporate Index; Source: Bloomberg, DWS Investments GmbH. As of 19/5/21.
Please note certain information in this presentation constitutes forward-looking statements. Due to various risks, uncertainties and assumptions made in our analysis, actual events or results or the actual performance of the markets covered by this presentation report may differ materially from those described. The information herein reflect our current views only, are subject to change, and are not intended to be promissory or relied upon by the reader. There can be no certainty that events will turn out as we have opined herein.
Past performance is not a reliable indicator of future returns. No assurance can be given that investment objectives will be achieved. Forecasts are not a reliable indicator of future returns. Forecasts are based on assumptions, estimates, views and hypothetical models or analyses, which might prove inaccurate or incorrect.
EU: For Professional Clients (MiFID Directive 2014/65/EU Annex II) only. No distribution to private/retail customers. Switzerland: For Qualified Investors (Art. 10 Para. 3 of the Swiss Federal Collective Investment Schemes Act (CISA)). Asia: For institutional investors only. Further distribution of this material is strictly prohibited. Australia: For professional clients only.
Risks
Disclaimer
DWS is the brand name of DWS Group GmbH & Co. KGaA and its subsidiaries under which they operate their business activities. The respective legal entities offering products or services under the DWS brand are specified in the respective contracts, sales materials and other product information documents. DWS, through DWS Group GmbH & Co. KGaA, its affiliated companies and its officers and employees (collectively “DWS”) are communicating this document in good faith and on the following basis.
This document has been prepared without consideration of the investment needs, objectives or financial circumstances of any investor. Before making an investment decision, investors need to consider, with or without the assistance of an investment adviser, whether the investments and strategies described or provided by DWS Group, are appropriate, in light of their particular investment needs, objectives and financial circumstances. Furthermore, this document is for information/discussion purposes only and does not constitute an offer, recommendation or solicitation to conclude a transaction and should not be treated as giving investment advice.
The document was not produced, reviewed or edited by any research department within DWS and is not investment research. Therefore, laws and regulations relating to investment research do not apply to it. Any opinions expressed herein may differ from the opinions expressed by other legal entities of DWS or their departments including research departments.
The information contained in this document does not constitute a financial analysis but qualifies as marketing communication. This marketing communication is neither subject to all legal provisions ensuring the impartiality of financial analysis nor to any prohibition on trading prior to the publication of financial analyses. This document contains forward looking statements. Forward looking statements include, but are not limited to assumptions, estimates, projections, opinions, models and hypothetical performance analysis. The forward looking statements expressed constitute the author‘s judgment as of the date of this document. Forward looking statements involve significant elements of subjective judgments and analyses and changes thereto and/ or consideration of different or additional factors could have a material impact on the results indicated. Therefore, actual results may vary, perhaps materially, from the results contained herein. No representation or warranty is made by DWS as to the reasonableness or completeness of such forward looking statements or to any other financial information contained in this document. Past performance is not guarantee of future results.
We have gathered the information contained in this document from sources we believe to be reliable; but we do not guarantee the accuracy, completeness or fairness of such information. All third party data are copyrighted by and proprietary to the provider. DWS has no obligation to update, modify or amend this document or to otherwise notify the recipient in the event that any matter stated herein, or any opinion, projection, forecast or estimate set forth herein, changes or subsequently becomes inaccurate.
Investments are subject to various risks, including market fluctuations, regulatory change, possible delays in repayment and loss of income and principal invested. The value of investments can fall as well as rise and you might not get back the amount originally invested at any point in time. Furthermore, substantial fluctuations of the value of any investment are possible even over short periods of time. The terms of any investment will be exclusively subject to the detailed provisions, including risk considerations, contained in the offering documents. When making an investment decision, you should rely on the final documentation relating to any transaction.
No liability for any error or omission is accepted by DWS. Opinions and estimates may be changed without notice and involve a number of assumptions which may not prove valid. DWS or persons associated with it may (i) maintain a long or short position in securities referred to herein, or in related futures or options, and (ii) purchase or sell, make a market in, or engage in any other transaction involving such securities, and earn brokerage or other compensation.
DWS does not give taxation or legal advice. Prospective investors should seek advice from their own taxation agents and lawyers regarding the tax consequences on the purchase, ownership, disposal, redemption or transfer of the investments and strategies suggested by DWS. The relevant tax laws or regulations of the tax authorities may change at any time. DWS is not responsible for and has no obligation with respect to any tax implications on the investment suggested.
This document may not be reproduced or circulated without DWS written authority. The manner of circulation and distribution of this document may be restricted by law or regulation in certain countries, including the United States.
This document is not directed to, or intended for distribution to or use by, any person or entity who is a citizen or resident of or located in any locality, state, country or other jurisdiction, including the United States, where such distribution, publication, availability or use would be contrary to law or regulation or which would subject DWS to any registration or licensing requirement within such jurisdiction not currently met within such jurisdiction. Persons into whose possession this document may come are required to inform themselves of, and to observe, such restrictions.
DWS is the brand name of DWS Group GmbH & Co. KGaA and its subsidiaries under which they operate their business activities. The respective legal entities offering products or services under the DWS brand are specified in the respective contracts, sales materials and other product information documents. DWS, through DWS Group GmbH & Co. KGaA, its affiliated companies and its officers and employees (collectively “DWS”) are communicating this document in good faith and on the following basis.
This document has been prepared without consideration of the investment needs, objectives or financial circumstances of any investor. Before making an investment decision, investors need to consider, with or without the assistance of an investment adviser, whether the investments and strategies described or provided by DWS are appropriate, in light of their particular investment needs, objectives and financial circumstances. Furthermore, this document is for information/discussion purposes only and does not constitute an offer, recommendation or solicitation to conclude a transaction and should not be treated as giving investment advice.
The document was not produced, reviewed or edited by any research department within DWS and is not investment research. Therefore, laws and regulations relating to investment research do not apply to it. Any opinions expressed herein may differ from the opinions expressed by other legal entities of DWS or their departments including research departments.
The information contained in this document does not constitute a financial analysis but qualifies as marketing communication. This marketing communication is neither subject to all legal provisions ensuring the impartiality of financial analysis nor to any prohibition on trading prior to the publication of financial analyses.
This document contains forward looking statements. Forward looking statements include, but are not limited to assumptions, estimates, projections, opinions, models and hypothetical performance analysis. The forward looking statements expressed constitute the author‘s judgment as of the date of this document. Forward looking statements involve significant elements of subjective judgments and analyses and changes thereto and/ or consideration of different or additional factors could have a material impact on the results indicated. Therefore, actual results may vary, perhaps materially, from the results contained herein. No representation or warranty is made by DWS as to the reasonableness or completeness of such forward looking statements or to any other financial information contained in this document. Past performance is not guarantee of future results.
We have gathered the information contained in this document from sources we believe to be reliable; but we do not guarantee the accuracy, completeness or fairness of such information. All third party data are copyrighted by and proprietary to the provider. DWS has no obligation to update, modify or amend this document or to otherwise notify the recipient in the event that any matter stated herein, or any opinion, projection, forecast or estimate set forth herein, changes or subsequently becomes inaccurate.
Investments are subject to various risks, including market fluctuations, regulatory change, possible delays in repayment and loss of income and principal invested. The value of investments can fall as well as rise and you might not get back the amount originally invested at any point in time. Furthermore, substantial fluctuations of the value of any investment are possible even over short periods of time. The terms of any investment will be exclusively subject to the detailed provisions, including risk considerations, contained in the offering documents. When making an investment decision, you should rely on the final documentation relating to any transaction.
No liability for any error or omission is accepted by DWS. Opinions and estimates may be changed without notice and involve a number of assumptions which may not prove valid. DWS or persons associated with it may (i) maintain a long or short position in securities referred to herein, or in related futures or options, and (ii) purchase or sell, make a market in, or engage in any other transaction involving such securities, and earn brokerage or other compensation.
DWS does not give taxation or legal advice. Prospective investors should seek advice from their own taxation agents and lawyers regarding the tax consequences on the purchase, ownership, disposal, redemption or transfer of the investments and strategies suggested by DWS. The relevant tax laws or regulations of the tax authorities may change at any time. DWS is not responsible for and has no obligation with respect to any tax implications on the investment suggested.
This document may not be reproduced or circulated without DWS written authority. The manner of circulation and distribution of this document may be restricted by law or regulation in certain countries, including the United States.
This document is not directed to, or intended for distribution to or use by, any person or entity who is a citizen or resident of or located in any locality, state, country or other jurisdiction, including the United States, where such distribution, publication, availability or use would be contrary to law or regulation or which would subject DWS to any registration or licensing requirement within such jurisdiction not currently met within such jurisdiction. Persons into whose possession this document may come are required to inform themselves of, and to observe, such restrictions.
Issued in German under DWS Investment GmbH and DWS International GmbH. © 2021 DWS International GmbH /DWS Investment GmbH
Issued in the UK by DWS Investments UK Limited which is authorised and regulated by the Financial Conduct Authority (Reference number 429806). © 2021 DWS Investments UK Limited
In Hong Kong, this document is issued by DWS Investments Hong Kong Limited and the content of this document has not been reviewed by the Securities and Futures Commission. © 2021 DWS Investments Hong Kong Limited
In Singapore, this document is issued by DWS Investments Singapore Limited and the content of this document has not been reviewed by the Monetary Authority of Singapore. © 2021 DWS Investments Singapore Limited
In Australia, this document is issued by DWS Investments Australia Limited (ABN: 52 074 599 401) (AFSL 499640) and the content of this document has not been reviewed by the Australian Securities Investment Commission. © 2021 DWS Investments Australia Limited
For investors in Bermuda This is not an offering of securities or interests in any product. Such securities may be offered or sold in Bermuda only in compliance with the provisions of the Investment Business Act of 2003 of Bermuda which regulates the sale of securities in Bermuda. Additionally, non-Bermudian persons (including companies) may not carry on or engage in any trade or business in Bermuda unless such persons are permitted to do so under applicable Bermuda legislation.
© 2021 DWS Group GmbH & Co. KGaA. All rights reserved. I-082767-1.3
Unlock full access to our vast content library by registering as an institutional investor
RegisterUnlock full access to our vast content library by registering as an institutional investor .
Create an accountAlready have an account ? Sign in