Recap: Over the second quarter the investment grade credit market continued to be affected to varying degrees by many of the same drivers that pushed spreads wider in the first quarter, including heightened interest rate volatility, fund outflows, and increasingly determined and aggressive central bank policy to curb near-record inflation in addition to mounting fears that a more severe slowdown in economic growth or even a recession may take hold sooner than expected. Credit spreads increased each month in the second quarter as secondary trading liquidity fluctuated with the corporate bond market feeling a bit fragile throughout the quarter. We began the quarter with March’s market dislocations eventually spilling over into April as the overall pressure on risk markets, which had abated somewhat in the back half of March, resumed. The unsettled macro backdrop, persistently elevated inflation data and lingering impact of the situation in Ukraine continued to weigh on investors and sentiment. The investment grade credit market showed signs of finding its footing and stabilizing toward the end of May and the beginning of June as central bank hiking expectations were dialed back, China’s Covid lockdowns eased and new issue activity fell short of expectations. However, many of the aforementioned macro drivers coupled with the Federal Reserve’s seeming last-minute change in course from setting up the market for a 50 basis point rate hike in the federal funds rate at the June FOMC meeting to leaking a shift in their thinking two days before the decision to tee up the market for the eventual 75 basis point increase caused spreads to gap wider while risk markets melted in June to finish off a very difficult first half of the year.
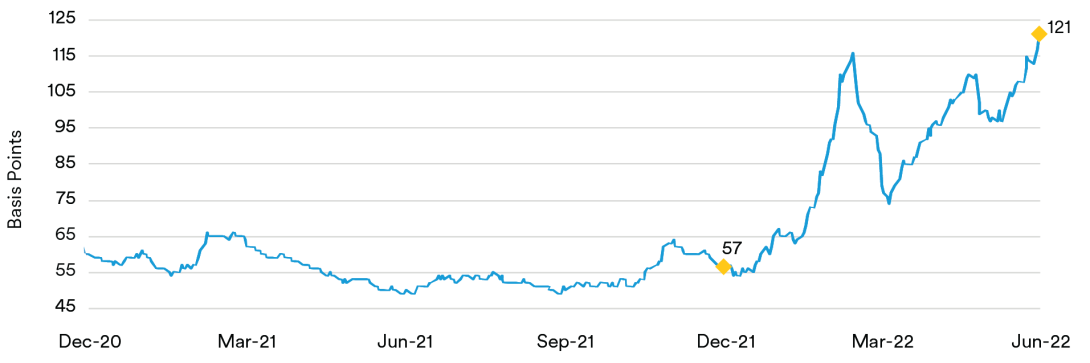
ICE BofA Corporate 1-5 Year Index
(as of June 30, 2022)
Source: ICE Data Services
Moving on to corporate credit fundamentals, first-quarter earnings reports broadly evidenced continued strength. Although many companies have benefited from strong demand via the global economy’s reopening trade, selected subsectors are experiencing elevated pressures on operating margins from wage costs, rising transportation and distribution expenses and lasting supply chain issues in addition to approaching headwinds due to the strength of the dollar, whose impact will be felt in coming quarters. To date, most firms have been able to pass through higher costs to customers or absorb greater expenses by making cuts elsewhere sufficient to preserve operating margins and continue to generate solid operating income and cash flow. Debt leverage has remained fairly steady in aggregate while certain subsectors like basic industry/materials and energy have benefited from the rise in commodity prices to produce impressive operating results and make substantial headway in paying down debt. Certain other subsectors like retail have been hurt by slowing revenue growth, higher costs and huge, unanticipated jumps in inventories as some management teams misread the shift in consumer buying patterns from goods to services and got stuck with unwanted inventory, forcing markdowns and likely collapsing margins for several quarters. We continue to watch for signs that the steep declines in U.S. consumer sentiment and negative small business optimism readings, probably driven by the ongoing inflationary pressures, coupled with the Federal Reserve’s hawkishly aggressive monetary policy tack signal the economy will tip into a recession, making the second half of the year a challenging one for investment grade credit investors.
Portfolio Actions & Outlook: Our bellwether front-end investment grade corporate index, the ICE BofA 1-5 Year U.S. Corporate Index, ended the second quarter at an option-adjusted spread (OAS) of 121 basis points, 42 basis points wider than where the index entered April. While corporate credit fundamentals across most subsectors remain on a solid footing, at a high level we took advantage of the increase in benchmark yields and widening in credit spreads to selectively add names to our portfolios that generally skew more toward being more up-in-quality and/or in subsectors that are less susceptible to being meaningfully impacted in the event the economy rolls over and takes a more decided downturn into recessionary territory as we sold some of our few remaining positions in issuers less well-positioned in our view. Thus, as we generally held our sector weightings relatively steady over the quarter, it represented a period where we were content to “pick our spots” in the corporates sector, especially against a somewhat choppy backdrop with secondary trading liquidity oftentimes much less than we have been accustomed to seeing.
We stuck to our disciplined and selective approach across strategies in the second quarter, focusing on purchasing fixed-rate corporate bonds through the new issue calendar and the secondary market in the desired maturity ranges. We continue to favor more defensive subsectors like banking, consumer non-cyclicals, technology, and electric utilities given their afore-mentioned greater resilience in a more difficult economic scenario and ability to sustain strong fundamentals. In our shorter strategies across portfolios, we added shor-dated fixed-rate corporates less than a year out to 1.5 years maturity-wise at what we deemed to be attractive yields, including an electric utility’s six-month bonds, a Yankee bank’s one-year bonds and a pharmaceutical company’s 1.5-year bonds. Purchases were funded principally by our continued selling of some of our few remaining floating-rate securities.
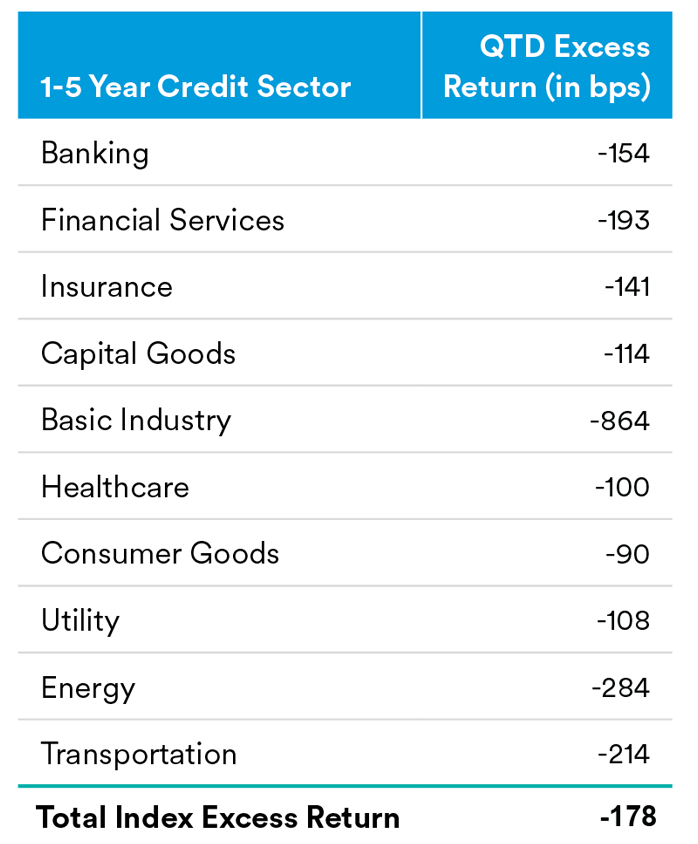
Corporate Credit Excess Returns
(as of June 30, 2022)
Source: BofA
In our 1-3 year portfolios over the second quarter, we were very active in notably adding two-year, fixed-rate exposure in a number of electric utility names and a pharmaceutical company via secondary purchases and one new issue utility while also adding mainly 1.5-2-year duration bonds in a Canadian bank, U.S. regional bank, securities exchange, life insurer, aerospace and defense company, and large domestic commercial/custodian bank. Our purchases were funded by selling some of our less favored names in the banking sector, specifically Yankee issuers, consumer cyclical issues, several positions whose spreads had tightened dramatically since their issuance and some of our few remaining floating-rate positions.
In our 1-5 year portfolios, it was much the same story as was described as having been executed in the 1-3 year strategy portfolios over the second quarter. Secondary purchases included adding a number of 1.5-2-year duration fixed-rate electric utility positions. On the new issue front we also purchased the aerospace and defense company’s two-year bond. Other new issue purchases, either in the three-year or five-year maturity area included a life insurer, Canadian bank, large e-tailer, U.S. trust bank, U.S. regional bank, health insurer, and large domestic commercial/ custodian bank. We swapped out of some floaters and less favored or more cyclically exposed issuers, mainly in the consumer cyclical and banking subsectors plus several positions whose spreads had tightened dramatically since their issuance.
As the tailwinds from an historic amount of fiscal and monetary policy support fade, we are destined to see financial conditions tighten with a Federal Reserve seemingly determined to play catch up from its current position of being well behind the curve. This should cause the pace of both nominal and real growth to decline over the quarters ahead even if inflation fails to roll over and move down closer to the Fed’s long-term 2% average target. While the impact of the coronavirus in terms of supply chain challenges, labor shortages and distortions in consumer behavior begins to diminish more decidedly, moving forward corporate credit fundamentals are expected to be maintained at current levels or see only modest improvement. This past quarter’s widening in spreads and reset to higher all-in yields presented us with attractive opportunities to increase our sector exposure slightly in investment grade credit and invest selectively in areas where we saw value.
As we look forward and embark on the third quarter, we see signs of increasing headwinds building and difficulties for the global economy and the investment grade credit market with the potential for a recession on the horizon. Flat or inverted yield curves, central banks committed to tightening policy rates to rein in or prevent runaway inflation, a rapid appreciation in the value of the U.S. dollar and persistent supply chain disruptions and growing margin pressure on companies in an environment of already slowing growth is not a recipe for things getting better for corporate fundamentals in the near term. Consequently, while we are more comfortable putting money to work in the current market at wider spreads and attractive all-in yields, we are not comfortable raising our risk appetite until we see signs signaling a brighter outlook is warranted. While our counterparty broker-dealer balance sheets that were clogged with secondary inventory at various points in the second quarter have largely been reduced and cleared to improve the technical backdrop at the margin, we continue to view the lack of market depth and liquidity as a vulnerability. The adverse change in foreign investor hedging costs has left them less inclined to invest in and support the U.S. bond market while steady fund investor outflows have weighed on technicals. Overall, we remain biased to remain positioned more defensively in credit and focus on up-in-quality securities and select subsectors better positioned to weather a more challenging economic landscape through steady or more inelastic demand and less pressure on their costs or at least the ability to pass them on to customers to preserve operating margins. Our favored subsectors and issuers continue to be found within banking, insurance, consumer non-cyclicals, communications, technology, and electric utilities given their proven ability to maintain strong operating cash flow, credit metrics and balance sheets while limiting the possibility of rating downgrades.
Performance: The investment grade credit sector was a detractor from relative performance across strategies in the second quarter. Credit spreads pushed wider throughout the quarter as benchmark Treasury yields rose, interest rate volatility spiked higher, central banks remained determined to tighten monetary policy to curb inflation, and the outlook for economic growth dimmed. Once again as with the first quarter, we saw all investment grade credit subsectors within Credit post negative excess returns over the quarter, producing not often seen back-to-back quarterly excess return declines. Thus, for our short dated, 1-3 year and 1-5 year strategy portfolios we observed our holdings generally widen with the market. As with the first quarter, we experienced weakness in some of the traditionally well supported subsectors like banking, insurance, automotive and electric utilities, which represent some of the most liquid subsectors. These subsectors suffered as the widening in credit spreads was exacerbated by investors selling the most easily tradable bonds to reduce exposure or satisfy investor outflows.
Treasuries / Agencies
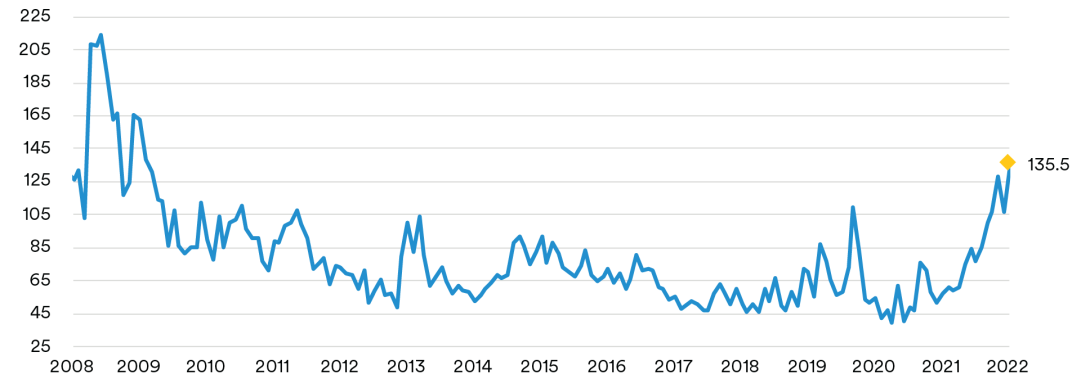
Recap: The second quarter of the year was defined by increased inflation concerns in the Treasury market as rates across the curve moved above the prior cycle’s highs with front-end yields peaking north of 3.60%. After delivering a 50 basis point rate hike in May, a stronger than expected CPI report in June prompted the Fed to hike by 75 basis points, with the groundwork laid for another 75 basis point hike in July. The continued repricing of Federal Reserve expectations in the front end of the market also resulted in continued high volatility, which also hit its highest levels since the Global Financial Crisis (GFC). Daily basis point moves being priced into the front end of the Treasury market moved from close to 8 basis points per day at the start of the quarter to over 10 basis points per day by the end of the quarter, a 25% increase and more than double what we saw at the start of the year. The Merrill Lynch Option Volatility Estimate (MOVE) Index, which is a yield curve-weighted index of the normalized implied volatility on Treasury options across the maturity spectrum, spiked higher in the second quarter to levels last seen in the summer of 2009.
The Merrill Lynch Option Volatility Estimate (MOVE) Index
(as of June 30, 2022)
Source: Bloomberg
Regarding Federal Reserve policy, 125 basis points in aggregate rate hikes during the quarter were accompanied by messaging of more to come with 50 or 75 basis point hikes now firmly on the table for some of the four remaining FOMC meetings this year. Quantitative tightening commenced with limited fanfare, with this process expected to continue to run in the background. Despite the risks of recession, the Fed made it clear that they are willing to continue tightening aggressively with a median terminal rate projection of 3.75%. The market continued to reprice Fed hiking expectations dramatically with a year-end 2022 projected fed funds rate moving from 240 basis points at the start of the quarter up to 338 basis points by the end of the quarter. Market expectations for the peak fed funds rate was also repriced significantly with expectations for a 3.50% to 3.75% funds rate around Q2 2023.
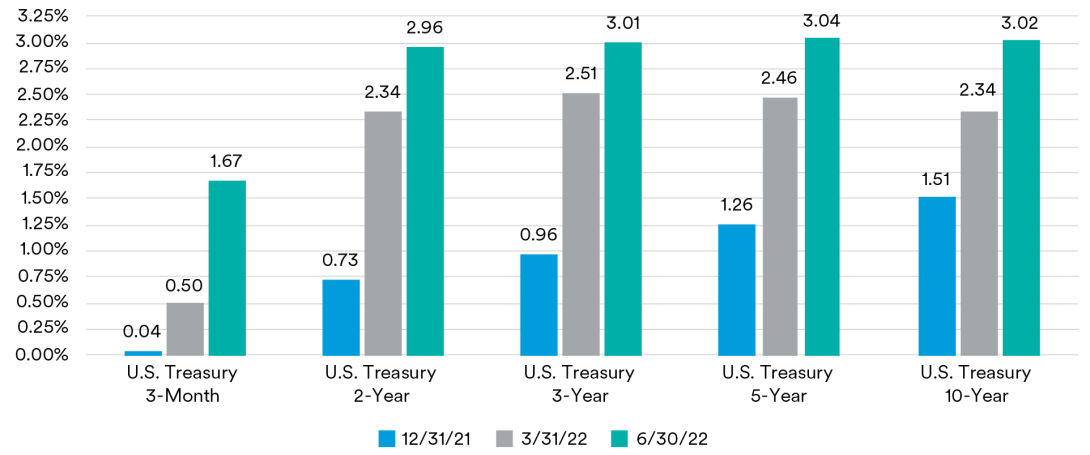
The very front end of the market led the selloff in the second quarter as short rates responded to liftoff and the promise of more rate hikes to come. The 3-month, 6-month and 1-year Treasury bill yields were 115 basis points, 145 basis points and 114 basis points higher during the quarter, respectively. Two-year Treasuries moved 61 basis points higher during the quarter, ending at 2.96%. Five-year Treasuries sold off slightly less but still moved 58 basis points higher during the quarter while the Ten-year Treasuries sold off slightly more, moving 67 basis points higher during the quarter. Yields across the curve peaked in mid-June before moving lower into quarter-end as fears of a potential recession started to filter through the market. After flattening dramatically in the first quarter of the year, the yield curve moved in a relatively parallel manner in Q2 when looking at the maturities two years and out. The spread between the 10-year Treasury and the 2-year Treasury moved from just slightly negative at the start of the second quarter to 6 basis points at the end of the quarter. The spread between the 5-year Treasury and 2-year Treasury moved from 12 basis points at the start of the second quarter to 9 basis points at the end of the quarter.
U.S. Treasury Yields
(as of June 30, 2022)
Source: Bloomberg
The widening we saw in breakeven inflation rates in the first quarter reversed sharply in Q2 providing a vote of confidence for the Fed’s inflation fighting credibility. The decline in market-based measures of inflation expectations was especially encouraging given energy prices remained high. Looking at the 2-year TIPS breakeven inflation rate, it moved from 441 basis points at the start of the second quarter to 329 basis points at the end of the quarter. Further out the curve, TIPS breakeven inflation rates also moved lower but not as much as the very front end. Five-year TIPS breakeven rates were 80 basis points lower during the quarter while 10-year TIPS breakeven rates were 55 basis points lower. With TIPS breakeven rates moving lower, real yields (yield-adjusted for inflation expectations) moved significantly higher during the quarter. The 5-year real yield moved back into positive territory from -91 basis points to start the quarter to 44 basis points to end the quarter while the 10-year real yield went from -49 basis points to 67 basis points during the same period.
Front-end Government-Sponsored Enterprise (GSE) agency spreads moved slightly wider over the second quarter as the option-adjusted spread (OAS) of the ICE BofA 1-5 Year U.S. Bullet (fixed maturity) Agency Index ended the second quarter at 3 basis points, a basis point wider from the beginning of the quarter. In the SSA subsector, U.S. dollar-denominated fixed-maturity securities saw spreads widen by 11 basis points and finish the second quarter, on average, at 32 basis points over comparable-maturity Treasuries. Agency callable spreads widened to Treasuries as short-dated and short-expiry volatilities in the upper left portion of the volatility surface continued to spike.
Portfolio Actions & Outlook: In the second quarter, we continued to increase our allocations to Treasuries while using nominals to opportunistically add duration at specific points on the curve across our portfolios. Along with rising rates and elevated volatilities, Agency callable yields were very close to the highest levels last seen in 2014. Given this environment we think callables with short maturities and short options look the most attractive, adding to these structures across most strategies during the quarter.
As we enter the third quarter, market expectations are for the Fed to tighten monetary policy extremely aggressively with another 190 basis points of hikes priced in by year-end 2022 and 200 basis points of hikes priced in by end of Q1 2023, in line with Fed terminal rate projections. FOMC members continue to be very vocal about being behind the curve and the need to bring inflation levels lower. The recent Fed minutes released on July 6 mentioned inflation 90 times. Our thoughts continue to be that too much Fed hiking may be priced into the market with the potential for financial conditions to tighten dramatically at some point during the hiking cycle and the probability of a recession on the horizon increasing. Overall Treasury yield levels across the curve may have peaked in Q2 but high levels of uncertainty remain. The TIPS market seems more attractive with the move to higher real yields and we would expect nominal Treasuries to underperform TIPS in the near term. We think SSA spreads remain unattractive as the spread over comparable Treasuries does not adequately compensate for reduced liquidity and additional volatility in risk-off scenarios. Looking ahead we expect to see further widening of SSA spreads and issuance to slow, consistent with seasonal supply patterns into the second half of the year.
Performance: Our slightly short to neutral duration posture and yield curve positioning relative to benchmark indices did not add or detract materially from excess returns while the Agency sector saw modestly negative excess returns as spreads moved slightly wider across the various Agency subsectors.
ABS
Recap: Spreads on short-tenor ABS tranches moved wider relative to like-duration Treasuries over the course of the second quarter as investors grappled with rising interest rates, the impact of inflation on the consumer and global macro volatility. Over the quarter spreads on two-year, fixed-rate AAA-rated credit card, prime auto and subprime auto tranches moved 18, 13 and 45 basis points wider to end the quarter at 60, 75 and 158 basis points over Treasuries, respectively. Three-year, floating-rate FFELP student loan tranches widened 15 basis points over the quarter to end at a spread of 90 basis points over LIBOR. ABS issuance was healthy over the quarter with over $73 billion of new deals coming to the market, compared to just over $70 billion in the second quarter last year. In typical fashion, the auto sector was the largest contributor with over $35 billion of deals. This was followed by $16.5 billion of issuance in the “other ABS” subsector (which includes collateral like cell phone payment plans, timeshares, mortgage servicer advances, insurance premiums, aircraft leases, etc.) and $9.4 billion of new credit card ABS.
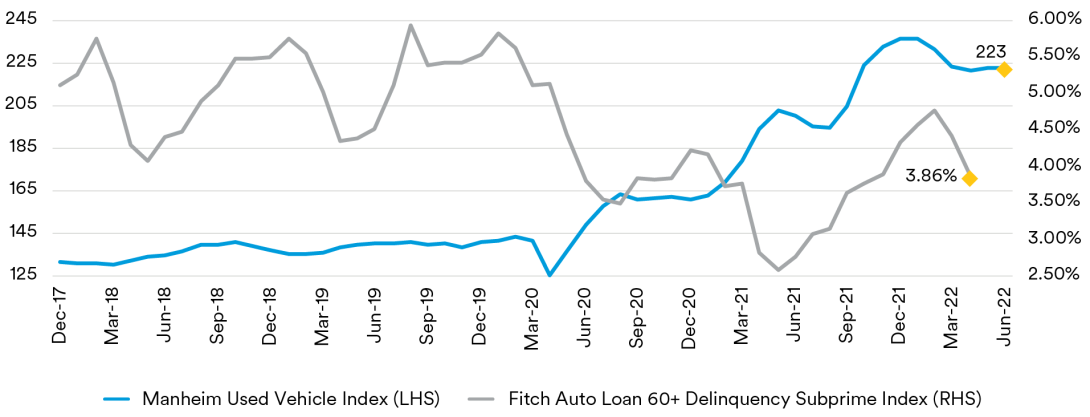
Despite the headwinds of inflation and rising interest rates on the consumer, credit card trust performance remains solid. Data from the June remittance reporting cycle as measured by the JP Morgan credit card performance indices showed bank credit card trust charge-offs rising only 5 basis points and 60+-day delinquencies falling 6 basis points over the quarter. With trust credit metrics still hovering near their best levels since the global financial crisis, we expect deterioration going forward as conditions worsen for consumers. That said, since ABS credit card trusts are backed by seasoned, prime underlying account receivables, we do not anticipate any material impact on AAA and AA-rated credit card tranches. Constrained by limited inventories, rising interest rates and rising prices, new vehicle sales continued to trend lower over the quarter. After posting sales at a 14.3 million SAAR (seasonally-adjusted annualized rate) pace in April, volumes declined to a pace of 12.7 million SAAR in May before rebounding slightly to 13.0 million SAAR in June. Cox Automotive noted that June sales came in below expectations with large year-over-year declines for Buick, Honda, Mazda, Nissan and other automakers. In particular, Cox noted that Honda sales had declined 54% year-over-year and that the automaker had “simply run out of inventory”. In June, Cox lowered their full-year forecast for new vehicle sales to 14.4 million units, down from 15.3 million and below the sales volumes seen in the pandemic year of 2020 as inventory has become the industry’s “long-haul problem”. Used car prices, as measured by the Manheim Used Vehicle Index, were essentially flat over the quarter after declining in the first quarter from a record high of 236.3 in January. The index closed the quarter at 219.9 which, while off from January’s level, still reflects a 9.7% increase in prices compared to last year.
Manheim Used Vehicle Index & Fitch Auto Loan 60+ Delinquency Subprime Index
(as of June 30, 2022)
Source: Bloomberg
High used car prices have helped sustain auto ABS trust performance. Through April, the 60+-day delinquency rates on the Fitch Auto ABS indices were 0.17% for the prime index and 3.86% for the subprime index. Annualized net loss rates for the indices stood at 0.13% for the prime index and 4.13% for the subprime index. As we have noted in prior commentaries, we are seeing a divergence between prime and subprime performance. For the prime indices, these levels continue to remain near historic lows with loss rates flat and delinquencies only 2 basis points higher than year-ago levels. In contrast, for the subprime indices, April’s numbers showed losses increasing 80 basis points and delinquencies rising 104 basis points. In our view, the subprime borrower is bearing the brunt of the impact of rising inflation and higher interest rates which the prime borrower, with healthy savings balances, is better able to bear. We expect this dynamic to persist and credit metrics for both auto subsectors to worsen further with subprime borrowers showing a greater degree of deterioration. That said, we still believe that AAA and AA-rated tranches of both prime and subprime auto deals have more than sufficient credit enhancement to outlast any coming downturn.
Portfolio Actions and Outlook: Over the course of the quarter we modestly reduced our ABS exposure in our longest strategy while modestly increasing ABS exposure in our enhanced cash, three and five-year strategies. Notably we reduced our CLO exposure across most strategies as part of an effort to swap floating-rate instruments into higher yielding fixed-rate alternatives. We participated in several new issue deals, including two fleet lease transactions, several auto transactions and a credit card deal.
At current spreads, we find ABS attractive and are likely to increase exposure going forward. However, in the current environment of heightened macro volatility, we remain cautious and are predisposed to favor more liquid, on-the-run sectors like prime autos and credit cards. For less liquid subsectors, we are likely to remain highly selective and will only participate in opportunities that present sufficient spread reward.
Performance: With benchmark spreads widening, our ABS holdings produced negative excess performance across most of our strategies in the second quarter after adjusting for duration and yield curve exposure. The exception was in our shorter strategies where performance was essentially flat. Our longer strategies were hurt by higher weightings in fixed-rate private student loans.
CMBS
Recap: Spreads on short-tenor CMBS securities widened over the course of the second quarter relative to like-duration Treasuries. At the end of the quarter, spreads on three-year AAA-rated conduit tranches stood at 110 basis points over Treasuries (45 basis points wider) and spreads on five-year AAA-rated conduit tranches stood at 112 basis points over Treasuries (28 basis points wider). Agency tranches were also wider on spread with three-year Freddie Mac “K-bond” tranches moving out 13 basis points to end the quarter at a spread of 36 basis points over comparable Treasuries. Over the course of the quarter over $72 billion of new issue CMBS came to market, a decrease of almost 17% compared to the $88 billion that printed in the second quarter last year. The decrease was due to much lower volumes in the non-agency sector as agency CMBS saw $45 billion of new issuance, almost $2 billion more than last year’s second quarter. Non-agencies saw $27.7 billion of new deals, with declines in all subsectors. We attribute the lower non-agency issuance volume to the combination of market volatility and rising interest rates.
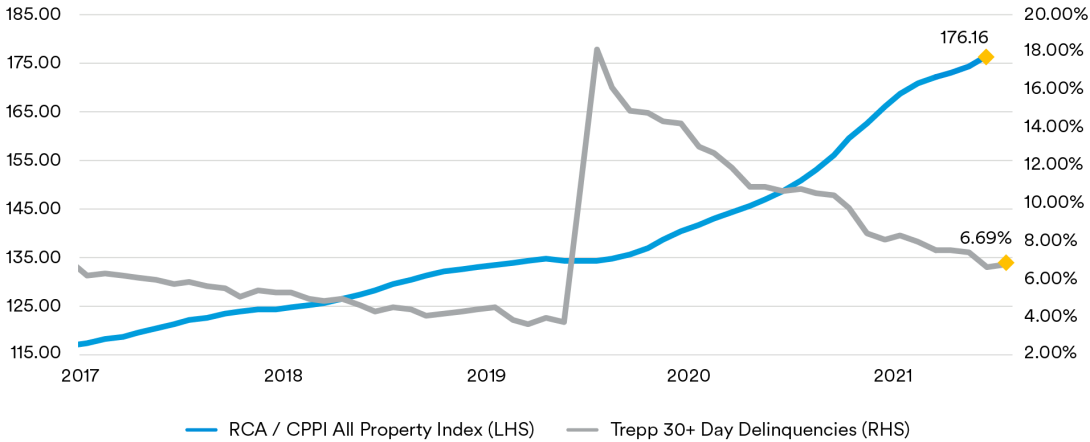
CMBS delinquencies continued to trend lower over the course of the second quarter. As measured by the Trepp 30+-day delinquency rate, CMBS delinquencies ended June at 3.20%, a decline of 53 basis points for the quarter and 295 basis points year-over-year. However, perhaps aligning with the worsening new issue dynamics, CMBS delinquencies actually ticked upward for the month, rising 6 basis points in June from May’s level. The increase is only the second rise in the last two years. In our view, it is too soon to tell whether this rise reflects an inflection point in the direction of delinquencies but it bears watching. Within the various commercial real estate subsectors, retail properties continue to be the worst performing with delinquencies of 6.69%, 81 basis points lower for the quarter. Lodging properties are the next worst with delinquencies of 5.94%, 93 basis points lower for the quarter. Industrial properties continue to be the top performer with delinquencies of only 0.49%, although that reflects a 1 basis point increase compared to the prior quarter’s level.
Led by strength in the industrial and apartment sectors, commercial real estate prices continue to exhibit strong growth. The June release of the RCA CPPI National All-Property Composite Index showed an 18.6% annualized gain through May, only slightly below the record high 19% growth rate seen in the first quarter of the year. RCA noted that industrial property prices grew at a record 28.6% annualized rate even as deal volumes contracted for the second straight month. Apartment prices also saw record year-over-year gains, with prices rising 23.3%, matching the record pace seen in April. Retail properties saw 18.8% annualized growth, which while still strong double-digit growth reflected the third consecutive month of slowing growth. Office properties showed the slowest annual growth with prices rising 12.2% year-over-year, led by strength in Central Business District (CBD) office properties which rose 13.4%. RCA noted this was the fastest rate of price growth for CBD offices since 2014. Suburban office properties rose 10.5% year-over-year. Office properties have shown flat or slowing growth rates for the last eight months. Prices in the Non-Major Metros rose 20.8% year-over-year while prices in the six Major Metros (Boston, Chicago, Los Angeles, New York, San Francisco and Washington, D.C.) climbed only 11.2%.
RCA / CPPI All Property Index & Trepp 30+ Day Delinquencies
(as of June 30, 2022)
Source: RCA CPPI
Despite record attendance and an in-person format, the CRE Finance Council (“CREFC”) industry conference held New York City in June (prior to the Fed’s decision to raise interest rates 75 basis points) was fairly downbeat in tone. Participants expressed concerns over the lack of clarity around property valuations and cap rates, an expected slowdown in lending volumes and the possibility of an approaching recession.
The Fed’s April 2022 Senior Loan Officer Opinion Survey showed lending standards and demand for commercial real estate loans was unchanged except for loans secured by multi-family residential properties which saw looser lending standards and higher demand. In addition, the survey asked banks a set of special questions about changes in their credit policies for each CRE loan category over the past year (these questions have been asked in the April survey for the past six years). Respondents generally reported easing lending standards for CRE loans, including increasing the maximum loan size, reducing the spread of loan rates, lengthening maturities and interest-only periods and expanding market areas served. The Fed noted that these responses contrasted with the answers to the same questions in the April 2021 survey, in which domestic banks reported generally tighter terms on most CRE loans other than multi-family.
Portfolio Actions & Outlook: Over the course of the quarter we reduced our CMBS exposure across all strategies. The reduction reflected the sale of many of our floating-rate SASB holdings and resulted in a more pronounced reduction in overall CMBS exposure in our longer strategies where we sold a larger proportion of our SASB holdings. The sales were designed to reduce floating-rate exposure and extend portfolio duration so as to enhance portfolio yields. As we were predisposed to sell floating-rate exposure, we did not participate in any floating-rate new issues during the quarter; in prior quarters we have used the new issue market to add floating-rate SASB tranches collateralized by high-quality collateral. We did purchase several fixed-rate conduit tranches and later in the quarter a few fixed-rate agency positions in various accounts. At current spreads, we expect to continue to prefer fixed-rate conduit tranches over floating-rate SASB alternatives and we will continue to look for 1.0 to 1.5-year weighted average life conduit tranches with favorable structures backed by attractive collateral (lower concentrations of real estate, office and lodging properties).
Performance: After adjusting for duration and yield curve exposure, we saw negative performance from our CMBS holdings across all strategies in the second quarter. As in the first quarter, our non-agency floating-rate SASB holdings were the worst performers. Our agency holdings were generally positive contributors to performance except in our longest strategy where wider spreads outweighed the income gained from coupon payments, resulting in negative performance.
RMBS
Recap: Residential mortgage-backed securities widened on spread over the course of the second quarter as higher interest rates, global macro volatility and continued concerns about the end of the Fed’s QE mortgage purchase program weighed on market sentiment. Generic 30-year collateral ended the quarter at a spread of 137 basis points over ten-year Treasuries (22 basis points wider) while 15-year collateral ended the quarter at a spread of 65 basis points over five-year Treasuries (29 basis points wider). Non-agency spreads also widened over the quarter with prime jumbo front cashflow tranches ending the quarter at a spread of 184 basis points over Treasuries (30 basis points wider).
With the Fed raising interest rates, mortgage rates surged higher over the quarter. The Freddie Mac 30-year mortgage commitment rate reached 5.81% in June before retracing slightly to end the quarter at 5.70%, 103 basis points higher for the quarter and at levels not seen since 2008. With rates rising, mortgage prepayments continued to fall with July’s prepayment report showing speeds on Fannie Mae 30-year mortgages falling to 9.3 CPR in June, following a drop to 9.9 CPR in May from 11.4 CPR in April. Fannie 15-year speeds were flat in June at 9.4 CPR after falling from 10.1 CPR in April. With interest rates rising over the second quarter, we expect further declines in prepayment speeds over the next few months due to the lagged response of refinancing activity. Despite the affordability challenges created by rising mortgage rates, home prices continued to move higher over the quarter. The June release of the S&P CoreLogic Case-Shiller 20-City Home Price Index showed home prices rising at a 21.2% annualized pace through April, ahead of economists’ projections and the largest gain on record. The Sunbelt metros continued to show the highest growth with Tampa (+35.8%), Miami (+33.3%), Phoenix (+31.3%), Dallas (+31.0%) and San Diego (+28.5%) showing the fastest growth. In contrast, Minneapolis (+12.3%), Washington DC (+12.7%) and Chicago (+13.0%) showed the slowest price growth. On a national level, Case-Shiller’s data showed prices rising 20.4%, down slightly from the record 20.6% pace seen in March.
With higher prices and rising mortgages rates causing affordability challenges for home buyers, the pace of home sales continued to slip. June’s data showed U.S. existing home sales fell to a 5.41 million annualized pace in May, the fourth consecutive monthly decline and the lowest level seen in almost two years. While the monthly supply of homes available for sale increased for the fourth straight month, the number of homes for sale fell relative to year ago levels to 1.16 million. At the current sales pace if would take 2.6 months to sell all the homes on the market, which is still historically low. Realtors consider anything below five months of supply as indicative of a tight housing market. New home sales also fell over the quarter, although June’s release showed a 10.7% rebound to a 696,000 annualized pace compared to the 629,000 print seen in the prior release. Homebuilder sentiment closed the quarter at a two-year low with the National Association of Home Builders sentiment index dropping 2 points in June to 67 with rising materials and labor costs weighing on homebuilder optimism.
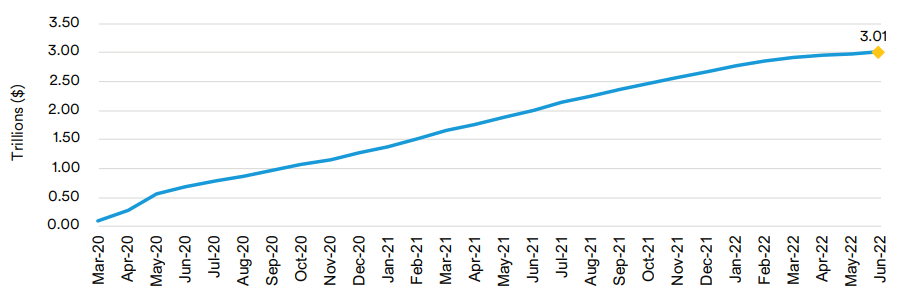
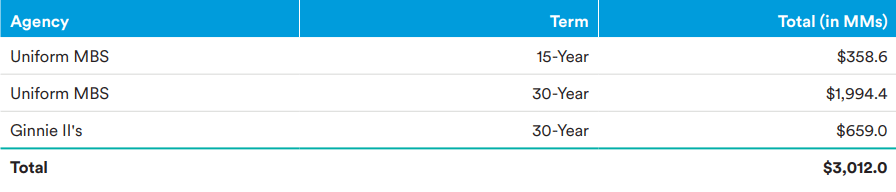
At the May FOMC meeting the Fed announced its plan to wind down its QE MBS purchase program by setting caps on the reinvestment of paydowns on its MBS portfolio. The Fed set caps at $17.5 billion for three months (June, July and August) then rising to $35 billion thereafter, with paydowns reinvested only to the extent that they exceed the caps. In our view, given the current level of interest rates it is unlikely that the higher $35 billion cap will be breached setting the stage for the Fed to cease MBS reinvestments in September. After the announcement, the market’s focus shifted to the possibility that the Fed might also seek to sell MBS. During congressional testimony in June, Fed Chair Powell stated that the Fed might need to sell MBS at some future date and the impact of losses from selling would not impact the Fed’s decision. Under Fed accounting rules, losses reduce the net income generated by the Fed and remitted to the U.S. Treasury. If net income turns negative, Treasury remittances are halted and the losses become a deferred asset on the Fed’s balance sheet that must be reduced by future positive income before Treasury remittances can resume.
Federal Reserve Balance Sheet Mortgage Backed Holdings
(as of June 30, 2022)
Source: J.P. Morgan
Portfolio Actions & Outlook: Over the course of the quarter we modestly decreased our exposure to RMBS across all of our strategies. This was accomplished as any prepayments and maturities were reinvested into other sectors and not through outright RMBS sales. Absent materially wider RMBS spreads, we are content to wait for greater clarity around the Fed’s path to reduce their portfolio before looking to increase our exposure. We remain cautious around non-agencies given the pronounced negative convexity impact of higher mortgage rates on the sector and potential extension risks.
Performance: Our RMBS positions generated negative excess returns for the quarter across all of our strategies driven by wider spreads across the sector. In particular, our limited holdings in “Non-QM” tranches experienced significant price deterioration over the quarter. We note that the credit performance of these securities remains solid and the underperformance reflects the negative convexity impact of higher rates and much slower prepayment assumptions combined with a significant volume of new issue Non-QM deals coming to the market during the quarter. Our seasoned agency CMO holdings were generally our best performers due to the protections of favorable structures and seasoned “burned-out” collateral that is less sensitive to prepayments.
Municipals
Recap: Total municipal new issue supply was $106.5 billion during the second quarter, 13% lower than last year’s second quarter. Lower refunding issuance was the primary catalyst for lower taxable supply levels. The current higher interest rate environment has made it uneconomical for issuers to advance refund outstanding debt. Issuers have also benefited from increased tax receipts, economic growth, and support from the federal government, lessening their need to access the primary market. Taxable municipals had negative absolute returns during the quarter. However, shorter-dated municipals had positive excess returns. For the second quarter, the ICE BofA 1-5 Year U.S. Taxable Municipal Securities Index total return was -0.64% versus the ICE BofA 1-5 Year U.S. Treasury Index total return of -0.81%.
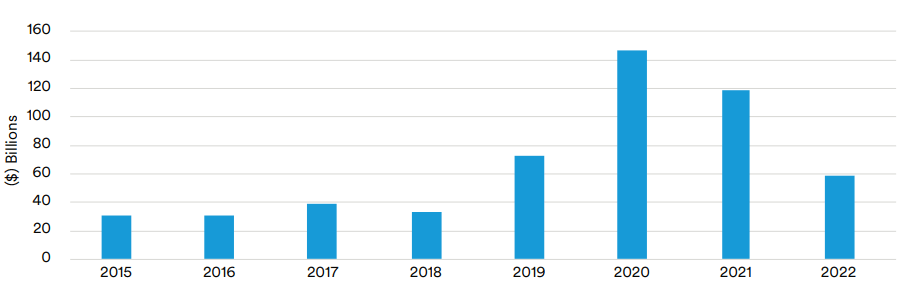
Taxable Municipal Issuance
(as of June 30, 2022)
Source: Bank of America
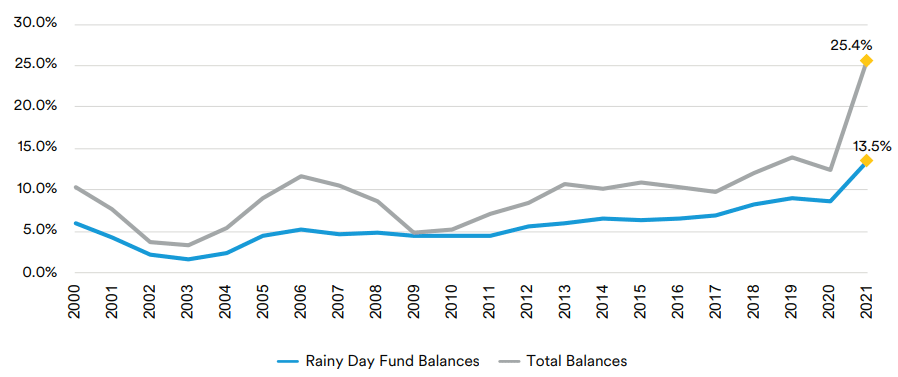
Strong credit fundamentals have driven positive ratings actions. The Port Authority of New York and New Jersey was upgraded by S&P on May 6 to AA- from A+, citing improved rate-setting ability and a strong financial risk profile as well as the continued recovery in air travel demand as contributing factors behind the upgrade. Traffic recovery, strong demographics, and improved market position were noted as catalysts for Moody’s upgrading the City and County of Denver, CO Airport System to Aa3 from A1 on June 17. Also of note was an upgrade of the State of Illinois to Baa1 from Baa2 by Moody’s on April 21, followed by a two-notch upgrade to BBB+ from BBBby Fitch on May 5 and S&P to BBB+ from BBB on May 6. The agencies pointed to tax revenue growth, increased payments towards unfunded liabilities and rebuilding financial reserves in their rationales for the upgrades. Data collected from state budget offices and published in the National Association of State Budget Officers (“NASBO”) Fiscal Survey of States – Spring 2022 edition illustrates the impact of stimulus measures and increased tax revenues on total fund balances and rainy-day funds. At the end of fiscal 2021, both total fund and rainy-day fund balances reached record levels of 25.4% and 13.5% of expenditures, respectively.
Rainy Day Fund Balances
(as of December 31, 2021)
Source: National Association of State Budget Officers
Portfolio Actions & Outlook: Our allocation to Taxable Municipals increased in our shorter duration strategies and levels were maintained or moderately decreased in our longer strategies. Purchases in the portfolios continue to be defensively focused and were concentrated in higher-quality, low duration securities. We focused on state general obligation or tax-backed debt when investing in longer-duration securities. Any reductions in our allocation were not related to credit concerns but based on relative value opportunities in other spread sectors; sales were primarily in securities with durations of under one year.
Over the quarter we added to our holdings in the airport sector as air travel demand continued to improve. On average for the second quarter, TSA throughput was only down 10% compared to 2019 levels. We expect credit fundamentals to continue to improve while airport systems maintain their balance sheet strength and liquidity levels. We believe pent-up demand will offset any revenue decline resulting from travel disruptions due to flight cancellations related to staffing shortages. We are also comfortable holding select CFC-backed airport bonds, as rentalcar-transaction-day recovery has been stronger than enplanement recovery in some markets, and several issuers have made bondholder-friendly adjustments to their indentures, resulting in stronger liquidity and greater debt service coverage.
We remained selective in our purchases in the healthcare sector over the quarter and continued to stick with our up-in-quality investment strategy in this somewhat volatile sector. Our focus remained on issuers with high market share, commitment to balance sheet strength and strong financial performance. Labor pressures are a leading headwind for healthcare providers, driven by a nursing shortage and personnel quitting or retiring early during the pandemic due to burnout. We are also mindful of the role of the federal government in setting health care policy and as a major payer via Medicaid and Medicare. Specifically, we see the non-profit hospital space as being exposed to policy risk that could alter expectations about returns on their high fixed-cost investments in facilities and personnel.
Performance: Our municipal holdings generated mixed performance across our strategies in the second quarter. On an excess return basis, the sector was a positive contributor in our shorter duration strategies and detracted slightly from, or were neutral to, performance in our longer strategies. Holdings in Essential Services and Tax-backed issuers generated positives excess returns, while holdings in Airport names generated mixed excess returns. Detracting from performance were select holdings in State and Local Appropriation bonds.
Disclaimers
This material is intended solely for Institutional Investors, Qualifed Investors and Professional Investors. This analysis is not intended for distribution with Retail Investors. This document has been prepared by MetLife Investment Management (“MIM”)1 solely for informational purposes and does not constitute a recommendation regarding any investments or the provision of any investment advice, or constitute or form part of any advertisement of, ofer for sale or subscription of, solicitation or invitation of any ofer or recommendation to purchase or subscribe for any securities or investment advisory services. The views expressed herein are solely those of MIM and do not necessarily refect, nor are they necessarily consistent with, the views held by, or the forecasts utilized by, the entities within the MetLife enterprise that provide insurance products, annuities and employee beneft programs. The information and opinions presented or contained in this document are provided as the date it was written. It should be understood that subsequent developments may materially afect the information contained in this document, which none of MIM, its afliates, advisors or representatives are under an obligation to update, revise or afrm. It is not MIM’s intention to provide, and you may not rely on this document as providing, a recommendation with respect to any particular investment strategy or investment. Afliates of MIM may perform services for, solicit business from, hold long or short positions in, or otherwise be interested in the investments (including derivatives) of any company mentioned herein. This document may contain forward-looking statements, as well as predictions, projections and forecasts of the economy or economic trends of the markets, which are not necessarily indicative of the future. Any or all forward-looking statements, as well as those included in any other material discussed at the presentation, may turn out to be wrong. All investments involve risks including the potential for loss of principle and past performance does not guarantee similar future results. Fixed income investments are subject interest rate risk (the risk that interest rates may rise causing the face value of the debt instrument to fall) and credit risks (the risk that the issuer of the debt instrument may default). In the U.S. this document is communicated by MetLife Investment Management, LLC (MIM, LLC), a U.S. Securities Exchange Commission registered investment adviser. MIM, LLC is a subsidiary of MetLife, Inc. and part of MetLife Investment Management. Registration with the SEC does not imply a certain level of skill or that the SEC has endorsed the investment advisor. This document is being distributed by MetLife Investment Management Limited (“MIML”), authorised and regulated by the UK Financial Conduct Authority (FCA reference number 623761), registered address 1 Angel Lane, 8th Floor, London, EC4R 3AB United Kingdom. This document is approved by MIML as a fnancial promotion for distribution in the UK. This document is only intended for, and may only be distributed to, investors in the UK and EEA who qualify as a “professional client” as defned under the Markets in Financial Instruments Directive (2014/65/EU), as implemented in the relevant EEA jurisdiction, and the retained EU law version of the same in the UK. MIMEL: For investors in the EEA, this document is being distributed by MetLife Investment Management Europe Limited (“MIMEL”), authorised and regulated by the Central Bank of Ireland (registered number: C451684), registered address 20 on Hatch, Lower Hatch Street, Dublin 2, Ireland. This document is approved by MIMEL as marketing communications for the purposes of the EU Directive 2014/65/EU on markets in fnancial instruments (“MiFID II”). Where MIMEL does not have an applicable cross-border licence, this document is only intended for, and may only be distributed on request to, investors in the EEA who qualify as a “professional client” as defned under MiFID II, as implemented in the relevant EEA jurisdiction. For investors in the Middle East: This document is directed at and intended for institutional investors (as such term is defned in the various jurisdictions) only. The recipient of this document acknowledges that (1) no regulator or governmental authority in the Gulf Cooperation Council (“GCC”) or the Middle East has reviewed or approved this document or the substance contained within it, (2) this document is not for general circulation in the GCC or the Middle East and is provided on a confdential basis to the addressee only, (3) MetLife Investment Management is not licensed or regulated by any regulatory or governmental authority in the Middle East or the GCC, and (4) this document does not constitute or form part of any investment advice or solicitation of investment products in the GCC or Middle East or in any jurisdiction in which the provision of investment advice or any solicitation would be unlawful under the securities laws of such jurisdiction (and this document is therefore not construed as such). For investors in Japan: This document is only being provided to general employees’ pension funds based in Japan, business owners who implement defned beneft corporate pension plans, etc. and Qualifed Institutional Investors domiciled in Japan. For Investors in Hong Kong S.A.R.: This document is being issued by MetLife Investments Asia Limited (“MIAL”), a part of MIM, and it has not been reviewed by the Securities and Futures Commission of Hong Kong (“SFC”). MIAL is licensed by the Securities and Futures Commission for Type 1 (dealing in securities), Type 4 (advising on securities) and Type 9 (asset management) regulated activities. For investors in Australia: This information is distributed by MIM LLC and is intended for “wholesale clients” as defned in section 761G of the Corporations Act 2001 (Cth) (the Act). MIM LLC exempt from the requirement to hold an Australian fnancial services license under the Act in respect of the fnancial services it provides to Australian clients. MIM LLC is regulated by the SEC under US law, which is diferent from Australian law. MetLife, Inc. provides investment management services to afliates and unafliated/third party clients through various subsidiaries.1 MetLife Investment Management (“MIM”), MetLife, Inc.’s institutional investment management business, has more than 900 investment professionals located around the globe. MIM is responsible for investments in a range of asset sectors, public and privately sourced, including corporate and infrastructure private placement debt, real estate equity, commercial mortgage loans, customized index strategies, structured fnance, emerging market debt, and high yield debt. The information contained herein is intended to provide you with an understanding of the depth and breadth of MIM’s investment management services and investment management experience. This document has been provided to you solely for informational purposes and does not constitute a recommendation regarding any investments or the provision of any investment advice, or constitute or form part of any advertisement of, ofer for sale or subscription of, solicitation or invitation of any ofer or recommendation to purchase or subscribe for any securities or investment advisory services. Unless otherwise specifed, the information and opinions presented or contained in this document are provided as of the quarter end noted herein. It should be understood that subsequent developments may afect the information contained in this document materially, and MIM shall not have any obligation to update, revise or afrm. It is not MIM’s intention to provide, and you may not rely on this document as providing, a complete or comprehensive analysis of MIM’s investment portfolio, investment strategies or investment recommendations. No money, securities or other consideration is being solicited. No invitation is made by this document or the information contained herein to enter into, or ofer to enter into, any agreement to purchase, acquire, dispose of, subscribe for or underwrite any securities or structured products, and no ofer is made of any shares in or debentures of a company for purchase or subscription. Prospective clients are encouraged to seek advice from their legal, tax and fnancial advisors prior to making any investment. Confdentiality. By accepting receipt or reading any portion of this Presentation, you agree that you will treat the Presentation confdentially. This reminder should not be read to limit, in any way, the terms of any confdentiality agreement you or your organization may have in place with Logan Circle. This document and the information contained herein is strictly confdential (and by receiving such information you agree to keep such information confdential) and are being furnished to you solely for your information and may not be used or relied upon by any other party, or for any other purpose, and may not, directly or indirectly, be forwarded, published, reproduced, disseminated or quoted to any other person for any purpose without the prior written consent of MIM. Any forwarding, publication, distribution or reproduction of this document in whole or in part is unauthorized. Any failure to comply with this restriction may constitute a violation of applicable securities laws. Past performance is not indicative of future results. No representation is being made that any investment will or is likely to achieve profts or losses or that signifcant losses will be avoided. There can be no assurance that investments similar to those described in this document will be available in the future and no representation is made that future investments managed by MIM will have similar returns to those presented herein. No ofer to purchase or sell securities. This Presentation does not constitute an ofer to sell or a solicitation of an ofer to buy any security and may not be relied upon in connection with the purchase or sale of any security. No reliance, no update and use of information. You may not rely on this Presentation as the basis upon which to make an investment decision. To the extent that you rely on this Presentation in connection with any investment decision, you do so at your own risk. This Presentation is being provided in summary fashion and does not purport to be complete. The information in the Presentation is provided to you as of the dates indicated and MIM does not intend to update the information after its distribution, even in the event that the information becomes materially inaccurate. Certain information contained in this Presentation, includes performance and characteristics of MIM’s by independent third parties, or have been prepared internally and have not been audited or verifed. Use of diferent methods for preparing, calculating or presenting information may lead to diferent results for the information presented, compared to publicly quoted information, and such diferences may be material. Risk of loss. An investment in the strategy described herein is speculative and there can be no assurance that the strategy’s investment objectives will be achieved. Investors must be prepared to bear the risk of a total loss of their investment. No tax, legal or accounting advice. This Presentation is not intended to provide, and should not be relied upon for, accounting, legal or tax advice or investment recommendations. Any statements of U.S. federal tax consequences contained in this Presentation were not intended to be used and cannot be used to avoid penalties under the U.S. Internal Revenue Code or to promote, market or recommend to another party any tax-related matters addressed herein. Forward-Looking Statements. This document may contain or incorporate by reference information that includes or is based upon forward-looking statements within the meaning of the Private Securities Litigation Reform Act of 1995. Forward-looking statements give expectations or forecasts of future events. These statements can be identifed by the fact that they do not relate strictly to historical or current facts. They use words and terms such as “anticipate,” “estimate,” “expect,” “project,” “intend,” “plan,” “believe,” “will,” and other words and terms of similar meaning, or are tied to future periods in connection with a discussion of future performance. Forwardlooking statements are based on MIM’s assumptions and current expectations, which may be inaccurate, and on the current economic environment which may change. These statements are not guarantees of future performance. They involve a number of risks and uncertainties that are difcult to predict. Results could difer materially from those expressed or implied in the forward-looking statements. Risks, uncertainties and other factors that might cause such diferences include, but are not limited to: (1) difcult conditions in the global capital markets; (2) changes in general economic conditions, including changes in interest rates or fscal policies; (3) changes in the investment environment; (4) changed conditions in the securities or real estate markets; and (5) regulatory, tax and political changes. MIM does not undertake any obligation to publicly correct or update any forward-looking statement if it later becomes aware that such statement is not likely to be achieved.
1 MetLife Investment Management (“MIM”) is MetLife, Inc.’s institutional management business and the marketing name for the following afliates that provide investment management services to MetLife’s general account, separate accounts and/or unafliated/third party investors: Metropolitan Life Insurance Company, MetLife Investment Management, LLC, MetLife Investment Management Limited, MetLife Investments Limited, MetLife Investments Asia Limited, MetLife Latin America Asesorias e Inversiones Limitada, MetLife Asset Management Corp. (Japan), MIM I LLC and MetLife Investment Management Europe Limited.
L0722024313[exp0123][All States][DC,PR] 0722024350[exp0724][All States][DC,PR] L0722024306[exp1222][All States][DC,PR] L0722024381[exp0123][All States][DC,PR] L0722024451[exp0724][All States][DC,PR]