Hybrid characteristics provide attractive risk/reward profile.
Key Insights
- High yield bonds, in our view, have a key role as a strategic long‑term investment and a mainstay allocation in a well-diversified portfolio.
- High yield bonds have an attractive risk/reward profile, having historically provided equity‑like returns with less volatility than stocks.
- Investors have been able to recognize much of high yield’s value by maintaining a long‑term allocation and taking advantage of the regular coupon payments.
High yield (HY) bonds, in our view, have a key role as a strategic long‑term investment and a mainstay allocation in a well‑diversified portfolio. Historically, high yield bonds have provided equity‑like returns with less volatility. Investors have been able to recognize much of high yield’s value over time by maintaining a long‑term allocation and taking advantage of the potential compounding effect of regular coupon payments.
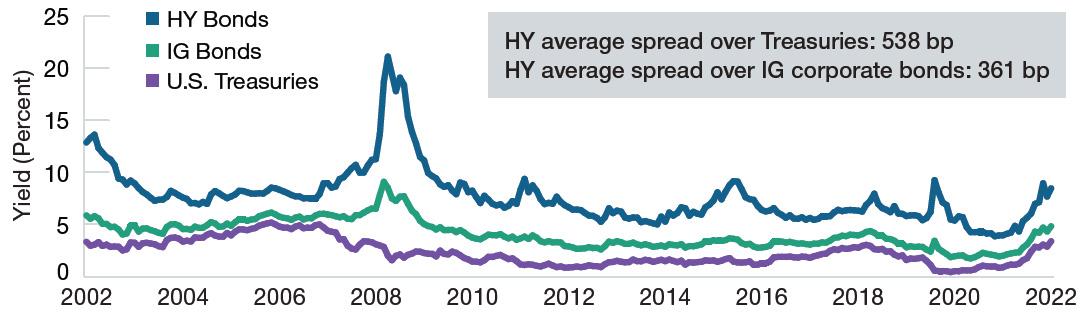
Yields and Spreads Over Time
(Fig. 1) Wider spreads to Treasuries indicate greater risk
From August 30, 2002, to August 31, 2022.
Past performance is not a reliable indicator of future performance.
Source: T. Rowe Price calculations using data from FactSet Research Systems Inc. All rights reserved.
High yield bonds are represented by ICE BofA U.S. High Yield Constrained Index; investment‑grade
corporate bonds by Bloomberg U.S. Corporate Investment‑Grade Index; and U.S. Treasuries by ICE BofA
U.S. Treasury Index. A basis point is 0.01 percentage point.
Yield is based on yield to worst, which is the lowest potential yield that can be realized on a bond without
the issuer defaulting.
The High Yield Risk/Reward Dynamic
High yield bonds are typically issued by companies that are rated below investment grade by one or more of the three main credit rating agencies. Due to their lower credit ratings, investors typically receive higher yields on below investment‑grade bonds in exchange for greater risk of default. This risk/reward dynamic is also expressed through credit spreads on high yield bonds, or their incremental yields over similar‑maturity U.S. Treasuries, which are perceived to carry near‑zero default risk. Typically, wider spreads indicate greater perceived risk.
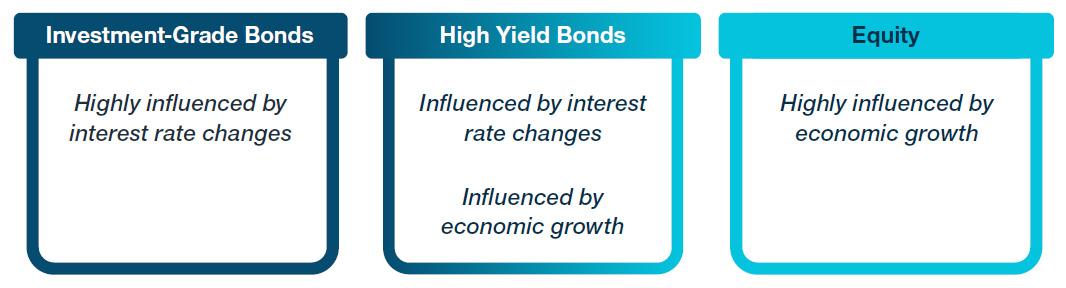
Hybrid Asset Class
High yield bonds are often considered to be a hybrid asset class because they tend to exhibit characteristics of both fixed income and equities. Like most other fixed income securities, high yield bonds offer a steady stream of income in the form of coupon payments, which averaged 7.40% over the 20 years ended August 31, 2022.1
However, high yield bonds tend to be more equity‑like in how they behave, given that credit (default) risk is the primary risk associated with investing in the asset class. Thus, unlike most other traditional fixed income instruments whose performance is closely tied to changes in interest rates, high yield bonds’ performance tends to be much more strongly linked to the business results and fundamentals of the companies that issue them.
Positioning in a Diversified Portfolio
Given their hybrid nature, high yield bonds have a unique and attractive risk/reward profile, having historically provided equity‑like returns with less volatility than stocks. Therefore, they can be thought of as either part of an overall fixed income allocation or a potential equity replacement. For fixed income investors, high yield bonds provide the potential for higher yields and greater returns, while also adding important diversification from traditional fixed income investments.2 For equity investors, particularly those that may be more risk averse, high yield bonds can offer similar returns with lower volatility and potential downside than stocks.
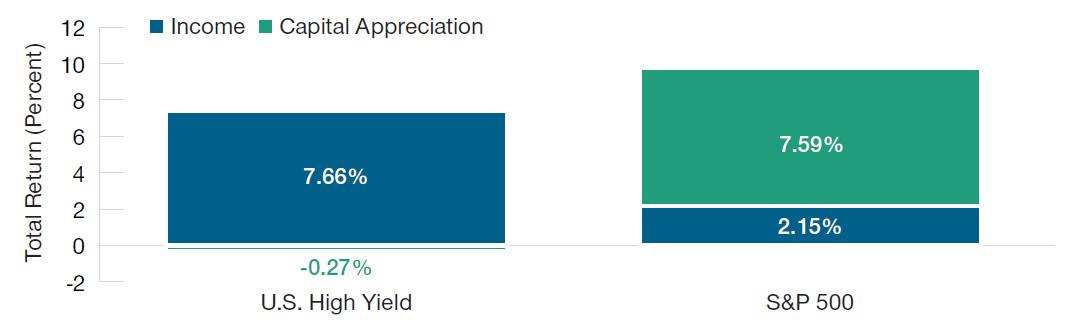
Income as a Key Source of Return
Most high yield bond portfolio managers focus on opportunities for both income and price appreciation as they invest. However, an analysis of historical sources of return shows that, unlike stocks, high yield bonds have typically derived the majority of their long‑term total returns from income rather than capital appreciation.
Their relatively high and generally consistent coupon payments are a key reason why high yield bonds have historically exhibited lower volatility than stocks. Because their long‑term returns have tended to be so heavily income driven, it pays to think of high yield bonds as a long‑term strategic investment because the compounding effect of these regular coupon payments can be meaningful over time.
Characteristics of a Hybrid Asset Class
For illustrative purposes only.
Key Asset Class Metrics
(Fig. 2) Twenty years ended August 31, 2022
| | Average Annualized Return | Standard Deviation* | Average Yield | Sharpe Ratio† | Correlation‡ to High Yield Bonds |
| HY Bonds | 7.39% | 9.11% | 8.00% | 0.68 | - |
| Stocks | 9.74 | 14.85 | 1.88 § | 0.58 | 0.71 |
| IG Bonds | 4.48 | 6.08 | 4.08 | 0.54 | 0.65 |
| U.S. Treasuries | 2.99 | 4.55 | 2.34 | 0.40 | -0.11 |
As of August 31, 2022.
Past performance is not a reliable indicator of future performance.
Source: Created with Zephyr StyleADVISOR. T. Rowe Price calculations using data from FactSet Research Systems Inc. All rights reserved. High yield bonds are represented by ICE BofA U.S. High Yield Constrained Index; stocks by S&P 500 Index; investment‑grade corporate bonds by Bloomberg U.S. Corporate Investment‑Grade Index; and U.S. Treasuries by ICE BofA U.S. Treasury Index. Average yield is based on yield to worst over the period.
*Standard deviation is a measure of the amount of variation or dispersion of a set of values. A low standard deviation indicates that the values tend to be close to the mean of the set, while a high standard deviation indicates that the values are spread out over a wider range.
† The Sharpe ratio is a measure of return relative to risk, calculated as an asset’s return above the risk‑free rate, divided by the standard deviation of the asset’s excess return. Risk‑free rate of return is a theoretical return of an investment with zero risk and the measure is used as a rate against which other returns are measured.
‡ Correlation measures how one asset class, style, or individual group may be related to another. A perfect positive correlation means that the correlation coefficient is exactly 1. This implies that as one security moves, either up or down, the other security moves in lockstep, in the same direction. A perfect negative correlation of ‑1 means that two assets move in opposite directions, while a zero correlation implies no relationship at all.
§ Trailing 12 months dividend yield.
Historical Performance and Relative Returns
What should investors expect out of high yield as an asset class over the long term? While past performance is not indicative of future returns, history can serve as a helpful reference point. Over the long term, high yield bonds have outperformed almost every other major fixed income asset class. In fact, in the 10 years ended August 31, high yield bonds generated a cumulative total return of 74%, compared with 19% for U.S. Treasuries and 43% for investment‑grade corporates.3
As Figure 4 demonstrates, there have only been five calendar years with negative returns over the last 25 years and, for investors that had the patience to stay invested, negative return years typically have been immediately followed by outsized return years.
Long-Term Sources of Return
(Fig. 3) Compounding of coupon payments can be meaningful.
Average Annualized Return. Twenty years ended August 31, 2022.
Past performance is not a reliable indicator of future performance.
Source: T. Rowe Price calculations using data from FactSet Research Systems Inc. All rights reserved.
*ICE BofA U.S. High Yield Constrained Index
High Yield Calendar Year Returns
(Fig. 4) Historical calendar year returns, U.S. high yield* 
| Number of Negative Calendar Years 1997-2021 | | Max. Drawdown † 20 Years Ended 8/31/22 |
| IG Bonds: 6 | HY Bonds: 5 | | Treasuries: -14% | HY Bonds: -33% |
| Stocks: 5 | Treasuries: 4 | | IG Bonds: -15% | Stocks: -51% |
As of December 31, 2021.
Past performance is not a reliable indicator of future performance.
Source: T. Rowe Price calculations using data from FactSet Research Systems Inc. All rights reserved. Index performance is for illustrative purposes only and is not indicative of any specific investment. Investors cannot invest directly in an index.
*ICE BofA U.S. High Yield Constrained Index weighted by bond face amount outstanding. Investment‑grade corporate bonds represented by Bloomberg U.S. Corporate Investment‑Grade Index; U.S. Treasuries by ICE BofA U.S. Treasury Index; and stocks by S&P 500 Index.
† Maximum drawdown is the peak to trough decline during a specific year.
Performance Through Market Cycles
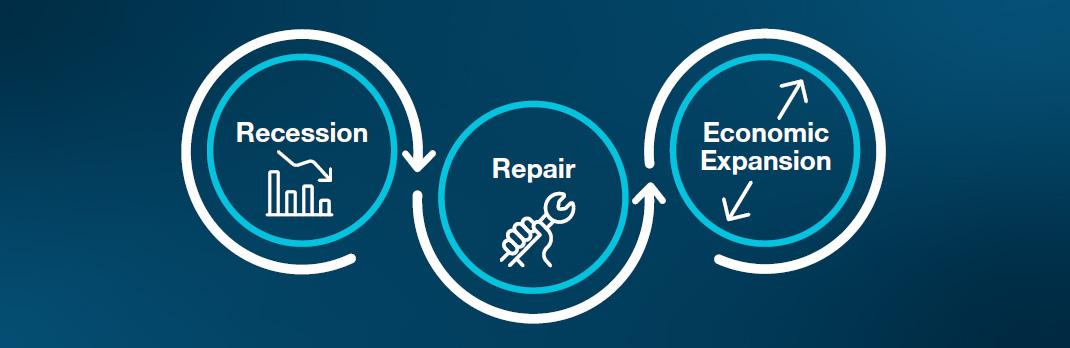
For high yield bonds, credit cycles tend to drive performance more than any other single factor, so a proper understanding of the stages of the economic cycle—and their investment implications—is critical. Below we highlight the key components of a typical market cycle and discuss how we would typically expect high yield bonds to perform in each phase.
Recession: High yield bonds tend to be susceptible to recessionary environments as economic downturns typically result in lower economic activity and make it more difficult for high yield issuers to service their debt. Credit spreads also tend to widen in such environments in anticipation of increasing defaults. In recessionary environments, high yield bonds tend to fare better than stocks but generally underperform “safer” fixed income asset classes such as Treasuries as investors flock to safety.
Repair: During the repair phase of the economic cycle, businesses generally seek to improve their balance sheets by trimming unproductive assets and paying off or restructuring debt. Default risk during these periods tends to decline as economic activity increases and it becomes easier for companies to service their debt. High yield bonds tend to outperform in these environments as default rates fall, credit spreads narrow, and higher coupons contribute to returns in excess of Treasuries.
Economic Expansion: During economic expansions, economic and credit conditions typically improve. Companies are generally able to earn more profits, making it easier for them to service their debt. Spreads tend to narrow. High yield bonds tend to outperform. When the cycle matures, interest rates rise as the Federal Reserve tightens monetary policy to slow the economy. High yield bonds tend to be more resilient to rising interest rates than other fixed income asset classes due to their shorter duration4 and higher coupons.
Components of the Credit Cycle
For illustrative purposes only.
Understanding Key Risks
Given the risk/reward trade‑off associated with any investment, it’s important to acknowledge and understand not only opportunities, but also key risks. High yield bonds have an asymmetrical nature of risk in that price appreciation potential is often limited by the fact that they typically pay back par at maturity (or sooner, if called by the issuer). Meanwhile, defaults can trigger significant principal losses and wipe out coupon gains, resulting in an outsized impact to the downside.
Therefore, when investing in high yield, it is important to work with an experienced portfolio manager with expertise in bottom‑up credit research and a strong long‑term security selection track record. Acknowledging that defaults are an inherent part of the asset class, the goal of most high yield managers isn’t necessarily to avoid default risk altogether; rather, the goal is to understand and measure key sources of risk and then seek an adequate level of compensation via a return (or spread) over the risk‑free rate to compensate for that risk. Backed by this risk management, we believe investors can maintain a long‑term allocation to the high yield bond asset class in aiming to take advantage of its attractive income over time.
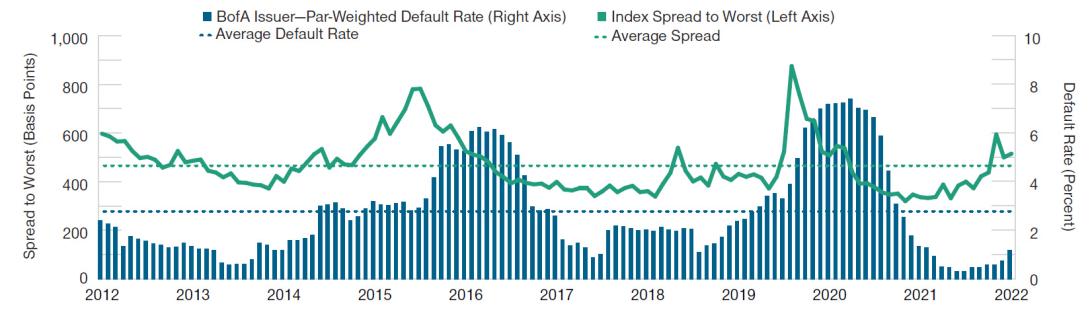
High Yield Spreads vs. Defaults
(Fig. 5) Defaults are an inherent part of the asset class.
As of August 31, 2022.
Past performance is not a reliable indicator of future performance.
Sources: ICE BofA (see Additional Disclosure), T. Rowe Price calculations using data from FactSet Research Systems Inc. All rights reserved.
Default rate is for ICE BofA U.S. High Yield Constrained Index weighted by bond face amount outstanding. Spread to worst is the lowest potential credit spread that can be realized on a bond without the issuer defaulting.
1 Par‑weighted coupon for the ICE BofA US High Yield Constrained Index. Source: Financial data and analytics provider FactSet. Copyright 2022 FactSet. All Rights Reserved. Index performance is for illustrative purposes only and is not indicative of any specific investment. Investors cannot invest directly in an index. Past performance is not a reliable indicator of future performance.
2 Diversification cannot assure a profit or protect against loss in a declining market.
3 High yield bonds measured by the ICE BofA U.S. High Yield Constrained Index; U.S. Treasuries by the ICE BofA U.S. Treasury Index; and investment‑grade corporate bonds by the Bloomberg U.S. Corporate Investment‑Grade Index. Past performance is not a reliable indicator of future performance.
4 Duration measures a bond’s sensitivity to changes in interest rates.
Download PDF
Authors
Kevin Loome, CFA
Portfolio Manager, U.S. High Yield Bond Strategy
Ashley Wiersma
Portfolio Specialist
Additional Disclosure
ICE Data Indices, LLC (“ICE DATA”), is used with permission. ICE DATA, ITS AFFILIATES AND THEIR RESPECTIVE THIRD‑PARTY SUPPLIERS DISCLAIM ANY AND ALL WARRANTIES AND REPRESENTATIONS, EXPRESS AND/OR IMPLIED, INCLUDING ANY WARRANTIES OF MERCHANTABILITY OR FITNESS FOR A PARTICULAR PURPOSE OR USE, INCLUDING THE INDICES, INDEX DATA AND ANY DATA INCLUDED IN, RELATED TO, OR DERIVED THEREFROM. NEITHER ICE DATA, ITS AFFILIATES NOR THEIR RESPECTIVE THIRD‑PARTY SUPPLIERS SHALL BE SUBJECT TO ANY DAMAGES OR LIABILITY WITH RESPECT TO THE ADEQUACY, ACCURACY, TIMELINESS OR COMPLETENESS OF THE INDICES OR THE INDEX DATA OR ANY COMPONENT THEREOF, AND THE INDICES AND INDEX DATA AND ALL COMPONENTS THEREOF ARE PROVIDED ON AN “AS IS” BASIS AND YOUR USE IS AT YOUR OWN RISK. ICE DATA, ITS AFFILIATES AND THEIR RESPECTIVE THIRD‑PARTY SUPPLIERS DO NOT SPONSOR, ENDORSE, OR RECOMMEND T. ROWE PRICE OR ANY OF ITS PRODUCTS OR SERVICES.
Important Information
This material is being furnished for general informational and/or marketing purposes only. The material does not constitute or undertake to give advice of any nature, including fiduciary investment advice, nor is it intended to serve as the primary basis for an investment decision. Prospective investors are recommended to seek independent legal, financial and tax advice before making any investment decision. T. Rowe Price group of companies including T. Rowe Price Associates, Inc. and/or its affiliates receive revenue from T. Rowe Price investment products and services. Past performance is not a reliable indicator of future performance. The value of an investment and any income from it can go down as well as up. Investors may get back less than the amount invested.
The material does not constitute a distribution, an offer, an invitation, a personal or general recommendation or solicitation to sell or buy any securities in any jurisdiction or to conduct any particular investment activity. The material has not been reviewed by any regulatory authority in any jurisdiction.
Information and opinions presented have been obtained or derived from sources believed to be reliable and current; however, we cannot guarantee the sources’ accuracy or completeness. There is no guarantee that any forecasts made will come to pass. The views contained herein are as of the date written and are subject to change without notice; these views may differ from those of other T. Rowe Price group companies and/or associates. Under no circumstances should the material, in whole or in part, be copied or redistributed without consent from T. Rowe Price.
The material is not intended for use by persons in jurisdictions which prohibit or restrict the distribution of the material and in certain countries the material is provided upon specific request. It is not intended for distribution to retail investors in any jurisdiction.