The potential knock-on effect of tighter financial policy has come into focus, as investors shift their attention from inflationary pressures to slowing economic growth. Many investors suggest an inevitable recession in 2023 which has historically had an outsized impact on the high-yield (HY) corporate market. But should we use history as a guide for 2023? In this piece, IR+M’s High Yield team reviews some themes from last year’s challenging environment, with wider spreads and higher rates, before previewing what we might expect in the year ahead.
2022 Recap
- Returns were weak in 2022 with few places to hide within the traditional equity and fixed income markets. Domestic equity markets were down almost 20%, the Bloomberg Aggregate Index was down 13%, while the Bloomberg High Yield Index (HY Index) was down only 11%. HY corporates held up reasonably well versus other asset classes considering the normally higher risk associated with “junk” bonds.
- It was somewhat of an unusual year. HY investors spent much of the year focused on the Federal Reserve (Fed) and its liftoff from extraordinary accommodative policy. Typically, HY returns follow credit ratings, with BBs outperforming in risk-off environments and CCCs outperforming in years where the market rallies. However, in 2022, total returns of BBs lagged single Bs due their higher interest-rate sensitivity and tighter starting spreads. The duration of the HY market is relatively low, meaning the sector has historically been less sensitive to changes in interest rates than other broad market indices. The influx of fallen angels in 2020 improved the quality of the HY Index, but also extended the duration of the universe. Yields on the HY Index started the year at 4.2% and more than doubled to close the year at almost 9.0%. Spreads widened from 277bps to 457bps, representing only 40% of the change in the HY Index yield. While all-in yields are near their all-time highs, spreads are hovering around their long-term average, despite the growing risk of recession driving mixed valuation signals.
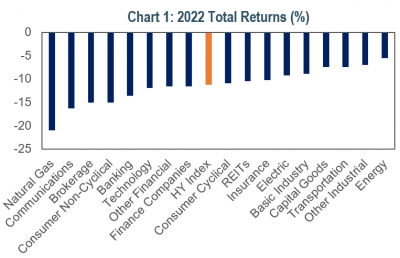
- Defensive sectors were less defensive. The high yield market underperformed Treasuries by over 350bps last year. Energy, typically a very cyclical sector performed well, with an excess return of 270bps, while the usually more stable Communications sector underperformed with an excess return of -810bps. Energy companies were beneficiaries of higher inflation given the rise in commodity prices, while Cable & Wireline sectors were pressured by higher capex requirements and rising funding costs.
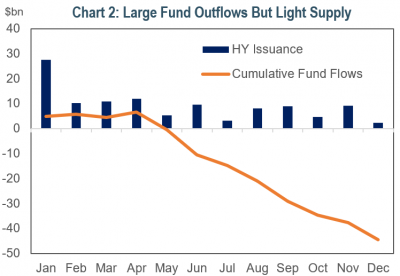
- Technicals were supportive despite fund outflows. Higher rate volatility and soft market sentiment kept many HY issuers on the sidelines. Supply totaled just over $100 billion in 2022, roughly 25% of what priced in 2020 and 2021. The heavier supply in those years pushed out the “maturity wall” and reduced the need for HY issuers to come to market in 2022. For those issuers that did come to market, it was a mixed bag – there were several “hung deals,” i.e., deals that did not get done, and there were deals that had to price with steep original issue discounts (OID). However, some deals performed well, proving the market was selective despite higher yields and demand was there for deals with the right terms and pricing. The low supply and roughly $100 billion of rising stars caused the HY market to shrink by 9% in 2022.
Looking Ahead
- We expect more volatility in 2023. There is still uncertainty around whether the Fed can engineer a “soft landing.” While inflation has fallen from the peak in June 2022, there is still more progress needed until we settle near the Fed’s long-term target of 2%. If the US enters a recession, the impact would be felt across the entire HY market, especially for the lower rated Bs and CCCs that are more levered to the economy. Investors have not been concerned yet, as the HY market is off to a strong start, returning over 4% through February, and pricing roughly $20 billion in new supply in January alone.
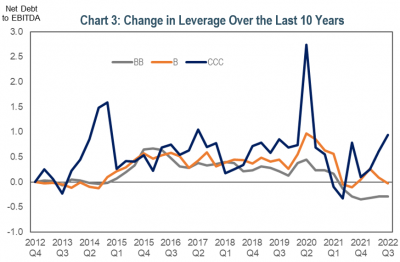
- Fundamentals will likely deteriorate, but from a strong starting point. The earnings environment is likely to weaken in light of a softer economy, with supply cost pressures weighing on margins, revenues lower, and employment costs higher. As a result, cash flows will likely be weaker, margins thinner, and leverage higher. The good news, however, is that corporate balance sheets are in better shape than they are typically when entering an economic downturn. Leverage remains below where it was prior to 2020 for many issuers which should give issuers some leeway from rating agencies.
- Defaults are expected to increase. Moody’s predicts the trailing 12-month default rate could rise from its current 2.8% to almost 6% by the end of 2023, above the long-term average of 3.9%, but well-below the high-water mark of historical default spikes (14.7% in 2009). In 2020, the influx of fallen angels added higher-quality issuers to the HY index while the spike in defaults removed the weakest companies out of the universe. Overall, the HY market has accomplished balance sheet repair over the past two years and locked in relatively low interest costs for several years. For those issuers that do default, the average HY dollar price of $86 suggests less downside risk versus historical recovery values (~40%). In addition, the strong new issue demand in 2021 and 2022 resulted in weakened bond covenants, which will perversely allow issuers more time to work through difficult operating environments to avoid default.

- Higher financing costs may deter aggressive mergers and acquisitions (M&A) or leveraged buyouts (LBOs). Low interest rates spurred a pickup of debt funded M&A over the past years. With rates up and spreads wider, the economic incentive for these types of deals has diminished. Going forward, companies may shift their focus to operating within cash flow and/or debt reduction to keep leverage low. Depending on market tone, we expect supply to be higher than 2022, but not as high as 2020 and 2021 levels. The heavy supply in recent years allowed many of the upcoming maturities to be refinanced or called. The “wall of maturities” many market participants reference looks relatively clear for the next 18 months with only 2.2% of the market coming due.
What It All Means
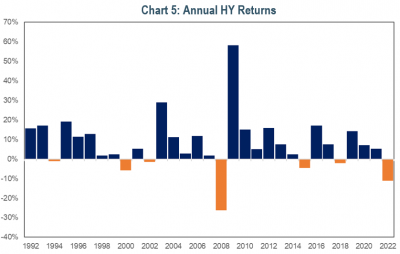
- Income is still a powerful driver of returns. With a starting yield of 8% there is a lot more yield to underpin performance this year. Historically, negative returns are followed by a positive rebound. As such, we are looking for a modestly positive total return driven by improved carry offset by wider spreads. Lower dollar prices have improved the market’s convexity and may also create greater upside potential in the event of an M&A-triggered change of control (CoC) or if bonds are called early.
- Any weakness would likely be unevenly distributed. The upshot of these crosscurrents is significantly more differentiation across sectors and companies than we normally see in beta-driven risk-on/risk-off markets. High dispersion is expected with a wide range of outcomes between the winners and losers. We believe these types of environments align well with our bottom-up security selection process.
- Be nimble. It will be important to have dry powder and be agile as we believe there will be unique opportunities for security selection across the entire universe. Going into the year, we preferred to be up-in-quality in more defensive issuers, but our positioning reflects that we are not beholden from sourcing sectors and issuers across the ratings spectrum. Issuers supported by durable cash flows will be paramount given the potential for weakening fundamentals. We also favor low-dollar price BBs, select CCCs, and short duration, high coupon debt for enhanced income. We believe we are well-positioned to benefit from further market volatility, but also have ample liquidity to capitalize on changes in market tone.
With a softer macro-outlook, we expect more volatility as the market assesses the Fed’s ability to engineer a “soft landing” in pursuit of its lower inflation mandate. As a result, we favor the higher quality parts of the market and are opportunistically participating in unique credit stories. We believe we have a cache of dry powder prepared to take advantage of market dislocations. We are looking forward to what we are sure will be another interesting year ahead.
Sources: Bloomberg and Bloomberg PORT. Index returns, spreads, and yields are as of 12/31/22. Size of the HY market is based on the amount outstanding of the Bloomberg High Yield Index. Year-to-date return of the HY market in “Looking Ahead” is calculated using the Bloomberg High Yield Index from 12/31/22 to 1/31/23. Moody’s default statistics sourced from Moody’s December 2022 Monthly Default Report. Chart 1: Returns are based on the Bloomberg High Yield Index. Chart 2: Cumulative fund flows based on the ICI Bond Taxable High Yield Estimated Weekly Net New Cash Flows Index and sourced from Bloomberg. Chart 3: Net Debt to EBITDA sourced from Bloomberg as of 12/31/22 and uses a trimmed mean (top/bottom 10%). Chart 4: Expected maturities using the projected maturities using Bloomberg PORT. Upcoming maturities represents the percentage of the Bloomberg High Yield Index that matures in the next 18 months as of 12/31/22. Chart 5: Returns are for the Bloomberg High Yield Index. The views contained in this report are those of Income Research & Management (“IR+M”) and are based on information obtained by IR+M from sources that are believed to be reliable but IR+M makes no guarantee as to the accuracy or completeness of the underlying third-party data used to form IR+M’s views and opinions. This report is for informational purposes only and is not intended to provide specific advice, recommendations, or projected returns for any particular IR+M product. Investing in securities involves risk of loss that clients should be prepared to bear. More specifically, investing in the bond market is subject to certain risks including but not limited to market, interest rate, credit, call or prepayment, extension, issuer, and inflation risk. It should not be assumed that the yields or any other data presented exist today or will in the future. Past performance is not a guarantee of future results and current and future portfolio holdings are subject to risk. Forward looking analyses are based on assumptions and may change. It should not be assumed that recommendations made in the future will be profitable or will equal the performance of the securities listed. Some statistics require assumptions for calculations which can be disclosed upon request. “Bloomberg®” and Bloomberg Indices are service marks of Bloomberg Finance L.P. and its affiliates, including Bloomberg Index Services Limited (“BISL”), the administrator of the index (collectively, “Bloomberg”) and have been licensed for use for certain purposes by IR+M. Bloomberg is not affiliated with IR+M, and Bloomberg does not approve, endorse, review, or recommend the products described herein. Bloomberg does not guarantee the timeliness, accurateness, or completeness of any data or information relating to any IR+M product. IR+M claims compliance with the CFA Institute Asset Manager Code of Professional Conduct. This claim has not been verified by the CFA Institute. This material may not be reproduced in any form or referred to in any other publication without express written permission from IR+M.
Printable Version