In 30 years, the world’s pension shortfall is projected to reach US$400 trillion—five times the size of the global economy today.1 This makes the responsibility of paying today’s retirees, while ensuring the financial security for future pensioners, all the more challenging, especially for cash-flow-negative schemes. Plans that are failing to generate enough investment income to pay member pensions face two choices: invest in income-yielding assets, or divest to boost liquidity. Because divesting is problematic during an economic downturn, most schemes have typically focused on optimizing their allocations to income-generating assets.
In the past, pension funds could count on two things to help them meet their liabilities: a high, risk-free interest rate and a workforce that was getting younger. But with most major economies getting older and interest rates at historical lows, CIOs have had to look for alternative solutions.
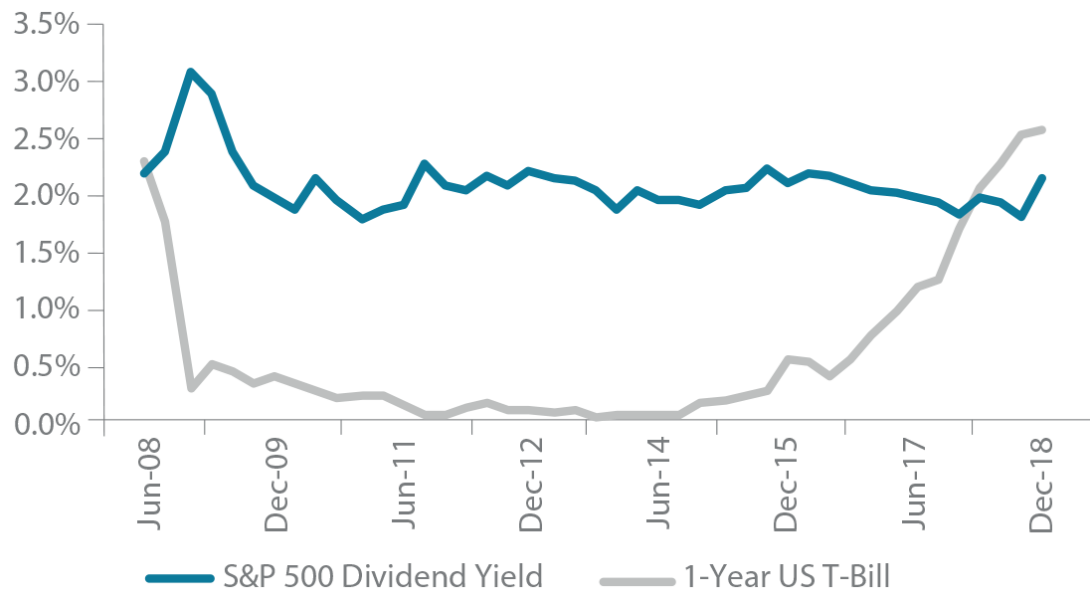
After the global financial crisis, investing heavily in public equities was a worthwhile strategy, providing attractive total returns as well as a competitive dividend yield. In the last few years, however, this too has changed. With yields from public equities below that of government bonds (Figure 1), where are CIOs to turn in the hunt for yield?FIGURE 1 | S&P TRAILING 1-YEAR YIELD VS 1-YEAR T-BILL
Source: Campbell Lutyens, 2019.
Where to Hunt?
Some investors have turned to more exotic solutions such as leasing out artwork; others have looked to high-yield sovereign and corporate bonds. For most investors, however, neither approach is considered to be institutional quality. Because the ability to deploy on a large scale is critical for the world's largest and most sophisticated investors, institutions have increasingly turned to private markets. Preqin estimates that fundraising across private markets has more than doubled since 2010, reaching approximately US$800 billion in 2018. Moreover, private equity funds, used as a proxy for private markets, have historically outperformed public markets.2
The Simple Dynamics: Yield vs. Capital Gain Strategies
Private markets can be divided into equity- and yield-driven strategies. Equity-driven strategies, like private equity, seek higher capital gains and tend to have higher returns (Figure 2). But they tend to be correlated to equity markets and subject to greater volatility. There is also a greater probability of losses at the asset level (Figure 3).
On the other hand, yield-driven strategies, like infrastructure and private debt, seek to generate income. They attract investor capital due to their diversification potential and defensive characteristics. Private debt, for instance, can be deployed more quickly and thus returns capital sooner; infrastructure may be slower to deploy and have a longer duration, but it is precisely these differentiators that attract investors (Figure 4). At both the asset and fund levels, returns from yield-oriented strategies show lower variance and loss ratios. But, the nature of returns from yield-oriented strategies have been evolving, requiring investors to be more aware of their composition so they can design the appropriate incentive mechanisms for managers.
FIGURE 2 | FUND-LEVEL NET TOTAL VALUE MULTIPLES
Source: StepStone Private Markets Intelligence, as of November 2018.
FIGURE 3 | AVERAGE DEAL-LEVEL LOSS RATIOS
Source: StepStone Private Markets Intelligence, as of November 2018.
FIGURE 4 | DPI CASH FLOW PROFILES

Source: Burgiss Private iQ as of 30 September 2017.
75th percentiles. Private Debt excludes distressed and mezzanine strategies and Private Equity comprises buyout and growth equity strategies.
COMPOSITION OF RETURNS IN REAL ASSETSSince the start of this decade, real assets have posted attractive returns (Figure 5). Early on, the multiple effect played a major role in total returns. But since 2016, this effect has been muted; in the wake of the global financial crisis, greater discipline (read: less leverage) resulted in lower return multiples. Throughout this period, however, income growth and income yield remained stable and were the sole return drivers. As a result, investors have had to become more judicious in their approach to hone in on opportunities with the greatest income-generating potential. We expect this trend to continue into next decade.3FIGURE 5 | DECOMPOSITION OF REAL ESTATE RETURN DRIVERS
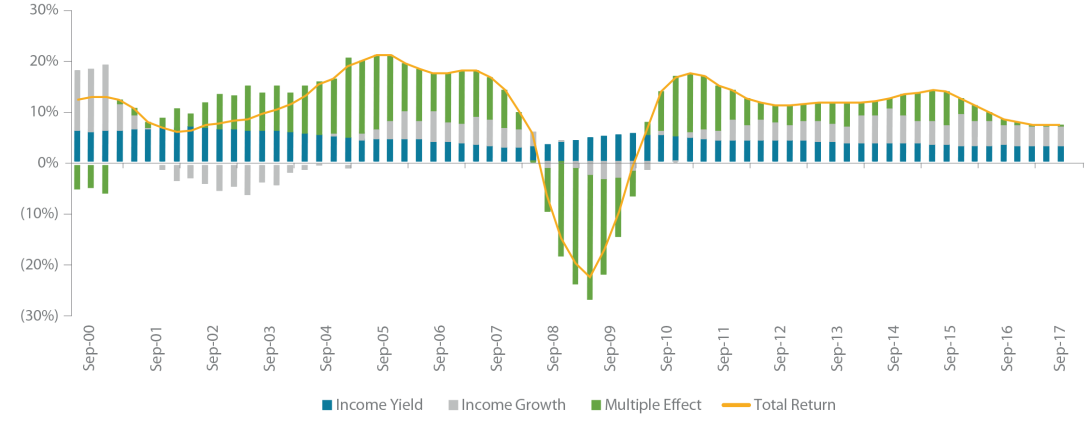
Source: BlackRock, NCREIF, December 2017, NCREIF Property Index.
Past performance is not reliable indicator of future results. It is not possible to invest directly in an index.
Infrastructure investors also face another constraint that underscores the importance of identifying incomegenerating opportunities. In a world where discount rates are historically low, regulators in key markets including Britain and Australia have steadily lowered the weighted average cost of capital, lowering the cap on returns that privately-financed infrastructure projects can generate.
THE MARKET MATURESPrivate market fees are attracting greater attention. Evolving return drivers are one reason; the maturing of alternatives as product markets is another. As alternative investments have become more popular, investors have become more sophisticated and more capable of vetting fees and fee structures. Besides reducing the fees paid to managers, LPs should strive to put in place fee structures that fit each asset class and the types of returns they offer. Doing so can help LPs fine-tune their allocation to private markets, and potentially benefit from the expansion and diversity of the market.
FEE MODELSPrivate debt and infrastructure have emerged recently as standalone asset classes. They have in the process inherited many of the fund terms from real estate and private equity, despite employing strategies that can be markedly different.
Private equity managers are compensated on the back end, through carried interest structures that reward capital gain strategies. As seen in Figure 6, direct lending managers, on the other hand, tend to earn most of their revenues from management fees. Still, 35% of revenues come in the form of carried interest, which implies some expectation of outperformance. This can lead to a mismatch between investors’ expectations and managers’ strategies.
Figure 7 illustrates a slight difference in the percentage of gross returns that private equity and direct lending managers are paid. But is this appropriate? Perhaps: Investors have very different return expectations for each asset class, potentially creating a perception issue given the difference in return profiles. Paying one-quarter of your returns to an income-generating manager can be justified if investors consider the value of diversification to their portfolio, capital protection, and the stability of those returns rather than just focusing on return enhancement.
FIGURE 6 | EXPENSE BREAK-OUT
Source: StepStone, as of April 2018.
FIGURE 7 | TOTAL EXPENSE RATIO
Source: StepStone, as of April 2018.
Like private debt, infrastructure inherited many characteristics from the private equity fee model. But the slowest to deploy is evolving quickly: Recently we have seen several core funds with open-ended structures that use a yield-based carry mechanism. This model may be instructive for private debt investors who are looking to reduce the gross-to-net spread and better align themselves with the GPs with whom they’ve entrusted their capital.
In our estimation, the following terms may be suitable for yield-based asset classes to ensure alignment with LPs and motivate GPs to remain focused on generating income:
» Basis. Using income generated instead of exit value as the basis for carry calculations is especially important for open-ended funds.
» Hard hurdles. While soft hurdles allow GPs to earn an incentive on all profits once the hurdle rate has been achieved, hard hurdles limit carry to the profits in excess of the hurdle. In doing so, the amount of carry earned is more commensurate with the lower return potential of yield-generating assets and allows investors to protect the "riskfree" or "beta" element of their yield generation.
» Nav limit. A NAV limit may complement this trigger. By setting a cap on the amount of carried interest that can be paid out in any one period, a NAV limit helps to ensure that managers are not encouraged to engage in risk-seeking behavior in lower returning more stable asset classes.
» Deferred carry. Under this scenario, carry is paid out over several years, provided the hard hurdle has been met. This may give LPs greater assurances that the GP will stay motivated even after the GP has met the yield trigger.
» Clawbacks. If the manager underperforms in years following a pay out, clawbacks allow investors to recuperate previously paid incentive fees. Shorter duration investments—like private debt—are subject to less uncertainty over who will enforce the clawback.
Conclusion
In the past, institutional investors could rely on yield from fixed-income products and on dividends from public equities alike to meet their short-term liquidity needs. But with yields on public equities below those of government bonds, institutional investors are looking to private markets to satisfy their short-term liquidity needs. Private debt and real assets may not deliver the same returns as private equity, but they can generate the income that cash-strapped investors crave.
While yield-based asset classes have inherited many of the traits that are common in private equity partnerships, investors in these asset classes have worked with GPs to make income generation a priority. NAV limits, deferred carry, and hard hurdles are merely some of the features we look for in yield-based agreements.
1 World Economic Forum, March 2018.
2 Burgiss Private iQ as of 30 September 2017; 2000-2014 vintages (funds thereafter still in J-curve).
3 Cap rates for real estate are flattening around historical lows as interest rates have begun to rise. Even if interest rates change course, cap rates can’t get much lower.
Read the full article here
This document is for information purposes only and has been compiled with publicly available information. StepStone makes no guarantees of the accuracy of the information provided. This information is for the use of StepStone’s clients and contacts only. This report is only provided for informational purposes. This report may include information that is based, in part or in full, on assumptions, models and/or other analysis (not all of which may be described herein). StepStone makes no representation or warranty as to the reasonableness of such assumptions, models or analysis or the conclusions drawn. Any opinions expressed herein are current opinions as of the date hereof and are subject to change at any time. StepStone is not intending to provide investment, tax or other advice to you or any other party, and no information in this document is to be relied upon for the purpose of making or communicating investments or other decisions. Neither the information nor any opinion expressed in this report constitutes a solicitation, an offer or a recommendation to buy, sell or dispose of any investment, to engage in any other transaction or to provide any investment advice or service.
Past performance is not a guarantee of future results. Actual results may vary.
Each of StepStone Group LP, StepStone Group Real Assets LP and StepStone Group Real Estate LP is an investment adviser registered with the Securities and Exchange Commission (“SEC”). StepStone Group Europe LLP is authorized and regulated by the Financial Conduct Authority, firm reference number 551580. Swiss Capital Invest Holding (Dublin) Ltd (“SCHIDL”) is an SEC Registered Investment Advisor and Swiss Capital Alternative Investments AG (“SCAI”) (together with SCHIDL, “Swiss Cap”) is registered as a Relying Advisor with the SEC. Such registrations do not imply a certain level of skill or training and no inference to the contrary should be made.
Manager references herein are for illustrative purposes only and do not constitute investment recommendations.