DWS
Bernard F. Ryan, CFA
Insurance Coverage
bernie.ryan@dws.com
617-295-2105
dws.com/InsuranceAM
875 Third Avenue
New York, NY 10022


Authors: Matthew Caggiano, Chad Farrington, Robert Fogarty
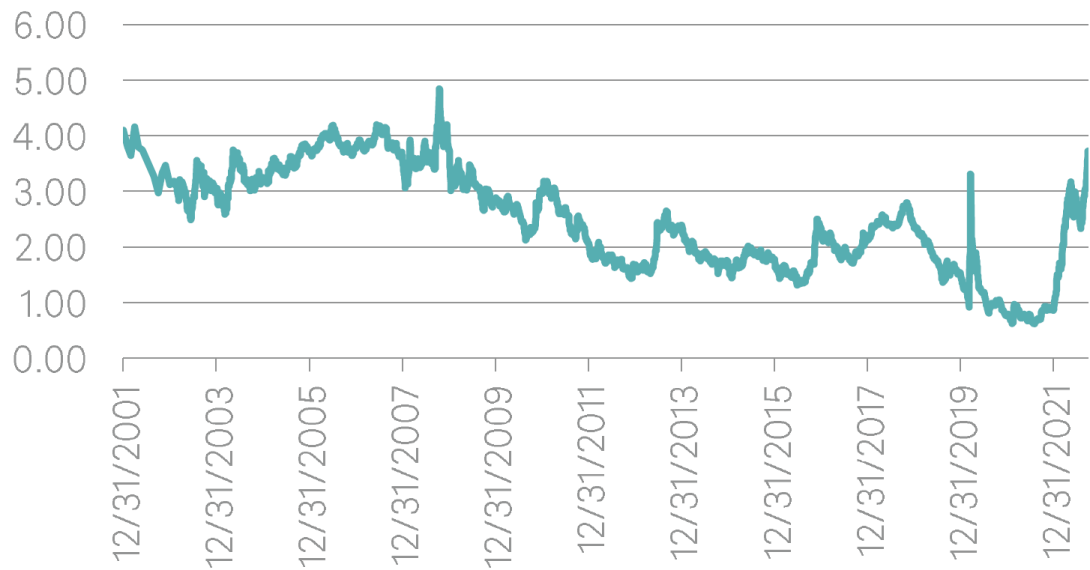
2022 has so far been a painful year for fixed income investors. No market has been spared the pain of rising interest rates and the municipal bond market has been no exception. The muni market is on pace to have the worst annual return since index data began in 1980 (previous record was in 1981 with a –10.23% calendar year return). Through the end of September, the Bloomberg Municipal Bond Index is down 12.13% and the Bloomberg High Yield Municipal Index is down even more at -16.03%. By contrast, the Bloomberg US Corporate Bond Index is down 18.72% and the S&P 500 Index was down 24.77%. Inflation has proven more stubborn than expected, leading to the most aggressive pace of monetary tightening in more than 20 years. When viewing rates from a much longer historical perspective, one could conclude that even with significantly higher rates than where we began the year, interest rates remain low. However, markets tend to anticipate where growth and inflation will be and not where they are. Given the significant rate adjustments since the beginning of the year, there are strong indications that we may be nearing the end of the current rate hike cycle. That doesn’t mean we are fully out of the woods and volatility is behind us. However, market rates tend to turn before the Fed rate hike cycle ends and current yields are much more attractive than they were to begin the year. In 2021, muni mutual funds enjoyed inflows of over $85 billion when investment-grade muni yields averaged just 1.05% and high yield munis averaged just 3.36%. So far in 2022, muni mutual funds have suffered over $91 billion in outflows when investment-grade munis currently yield over 4% for the first time since 2011 and high yield munis yield over 6% for the first time since 2017. Clearly the reason for outflows has been the near-record losses year-to-date caused by sharply higher yields; but it lends the question, is now the time to consider municipal bonds again?
The sell-off this year has been almost entirely due to higher U.S. Treasury rates and record outflows from municipal mutual funds. The selling from funds and aggressive Fed rate hikes has led to the most negative performance for long duration bonds. If inflation remains stubborn, forcing the Federal Reserve to continue hiking rates well into 2023, we may have not yet seen the peak in municipal yields. However, municipal yields for longer maturities (as measured by BVAL) are as high as they have been since 2014 (see below) and are roughly equal to U.S. Treasury yields. Whenever the Bloomberg Municipal Bond Index has yielded 3% or greater, muni returns have been attractive in following periods – averaging 8.6% in rolling 12-month periods.
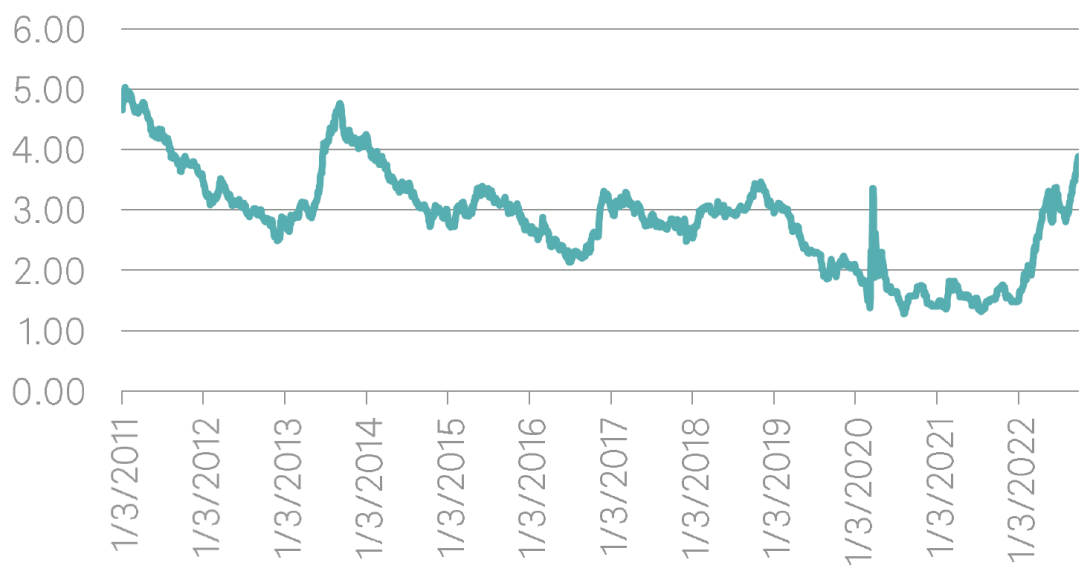
Source: Bloomberg as of 9/30/2022

Source: Bloomberg as of 9/30/2022
One reason to be hopeful that we are near the end of this rate hike cycle is the U.S. Treasury market yield curve inversion. The curve inversion (when short rates yield more than long rates) first occurred in March of this year when the Federal Reserve started hiking the Federal Funds Rate target. Since July 5th, the 2/10 yield curve has been inverted by as much as 51bps and currently 39bps as of 9/30/2022. Typically, once the curve returns to a positive slope between 2/10 year maturities, longer-term market rates have moved lower in the next 12-24 months, which has led to strong total returns for patient bond investors. The Fed Funds rate hike cycle that most closely resembles the current cycle occurred in the mid-1990’s. The world has changed dramatically in the past 30 years, but that was the last rate hike cycle to include a 75bps hike at a single meeting. The 10-yr U.S. Treasury yield peaked 3 months before the last Fed Funds increase during that cycle that lasted 12 months and included seven Fed Funds rate increases.
The intermediate part of the municipal bond yield curve, represented by the Bloomberg Muni 1-15 Year Blend, is much steeper than the Treasury yield curve. Unlike the Treasury market, the shape of the curve has less to do with any economic outlook considerations and is more representative of market demand nuances. Record outflows from one of the largest buyers in the market in 2022, mutual funds, has been offset on the front end of the yield curve by strong demand from separately managed accounts, depressing yields inside of 10 years. Approximately 90% of the yield on the entire municipal yield curve can be captured going out to fifteen years. When comparing the yield and duration of the Bloomberg Muni 1-15 Year Blend versus the overall Bloomberg Municipal Bond Index, investors can capture 89% of the yield (3.04% vs. 3.43%) with 67% of the duration (4.72 vs. 7.01 years). In fact, over the past decade, investment-grade intermediate munis have yielded more than 3% only one other time, for a hot minute in March 2020. We believe an intermediate allocation provides a good defensive place to find yield without as much price downside possibility than longer maturing bonds if interest rates continue to march higher.
Source: Bloomberg as of 9/30/2022
Headlines point to high yield underperformance by citing the more negative performance of the Bloomberg High Yield Municipal Index versus the much larger Bloomberg Municipal Bond Index, but the headline number is a little deceiving. When you break down the index by maturity, high yield underperformance is less dramatic. Since close to half of the Bloomberg High Yield Index is in the longest maturity bucket and long bonds have been by far the worst performers YTD, the heavier weighting drives the overall performance more negative. By contrast, only 19% of the Bloomberg Municipal Bond index is in the longest maturity bonds. Isolating the longest maturity bucket reveals longest maturity investment grade bonds only slightly outperforming similar maturities of lower quality. This is partly explained by the more prevalent issuance of lower coupon bonds in recent years that have seen significant losses due to their longer duration. However, there also must be consideration for the less liquid nature of the high yield market and limited price discovery due to lower trading volume of smaller, below investment grade bonds.
While we remain generally constructive on municipal credit fundamentals, certain sectors are more susceptible to higher rates and/or staffing and other inflationary cost pressures. Healthcare is one area experiencing credit weakness due to staffing shortages and other cost increases that are pressuring operating margins. Senior living facilities that have a strong reliance on entrance fees from new residents are likely to weaken as the housing market affordability is challenged by higher mortgage rates. Special development districts that rely on new housing creation may also deteriorate as the housing market slows. Therefore, while more attractive yields are currently available in the high yield market, there is a good possibility for further spread widening especially as the economy eventually slows.
Although we are likely to see more rate volatility as the Federal Reserve continues hiking rates to fight inflation, yields in the municipal market have moved significantly higher and are now much more appealing from a historical perspective. History has shown that market rates turn before the Fed is finished hiking rates, so getting exposure to high quality, longer duration bonds should benefit the most as the economy slows. For those investors still worried about higher rates, the intermediate part of the municipal curve offers attractive yield with much lower duration. While we still don’t expect widespread defaults in most parts of the high yield municipal market, even a shallow recession may more negatively affect high yield municipal credits, especially since below investment grade spreads have hung in reasonably well so far in 2022.
Important risk information Bond investments are subject to interest-rate and credit risks. When interest rates rise, bond prices generally fall. Credit risk refers to the ability of an issuer to make timely payments of principal and interest. Investments in lower-quality and nonrated securities present greater risk of loss than investments in higher-quality securities. Inverse floaters are derivatives that involve leverage and could magnify gains or losses on tax-free investments. Investments that generate federally tax-free income may have a portion of their distributions subject to federal, state and local taxes, including the alternative minimum tax. Any tax information in this document is merely a summary of our understanding and interpretation of some of the current tax laws and regulations and is not exhaustive. Consult your legal or tax counsel for advice and information concerning your particular situation. Neither DWS nor any of its representatives may give tax or legal advice. The brand DWS represents DWS Group GmbH & Co. KGaA and any of its subsidiaries such as DWS Distributors, Inc. which offers investment products or DWS Investment Management Americas, Inc. and RREEF America L.L.C. which offer advisory services.
DWS Distributors, Inc. 222 South Riverside Plaza Chicago, IL 60606-5808 www.dws.com Tel (800) 621-1148 © 2022 DWS Group GmbH & Co. KGaA. All rights reserved. WSG210179 (10/23) R-081135-2 MUNI-OPIN-FEB RETAIL-PUBLIC
Unlock full access to our vast content library by registering as an institutional investor
RegisterUnlock full access to our vast content library by registering as an institutional investor .
Create an accountAlready have an account ? Sign in