DWS
Bernard F. Ryan, CFA
Insurance Coverage
bernie.ryan@dws.com
617-295-2105
dws.com/InsuranceAM
875 Third Avenue
New York, NY 10022


-by Thomas Farina, Head of U.S. Investment-Grade Credit & Portfolio Manager, DWS
With the emergence of the COVID-19 pandemic and the resulting policy response, 2020 has been a tumultuous year for the U.S. investment-grade market. Yield spreads widened dramatically when the pandemic was declared but recovered quickly when the Federal Reserve launched various programs to support this asset class and other segments of the fixed income market.
Nevertheless, some uncertainty remains about the economy in the near term, and investors continue to have questions about the state of this market. Specifically, given the surge in issuance, how does the supply/demand picture look, and what is the outlook for 2021? In addition, with some sectors continuing to experience economic difficulties, how are the fundamentals, credit ratings and valuations holding up?
While support from the Federal Reserve has facilitated a recovery, yield spreads may now be tighter than investors expected. Given record low rates, can investors still look to this asset class to generate a reasonable income stream? Finally, how important is ESG in today’s investment grade market? Do ESG-sensitive investors have to give up performance?
We believe that despite past periods of tumult, history shows that a strategic approach to investment grade bonds has been rewarded over the long term.
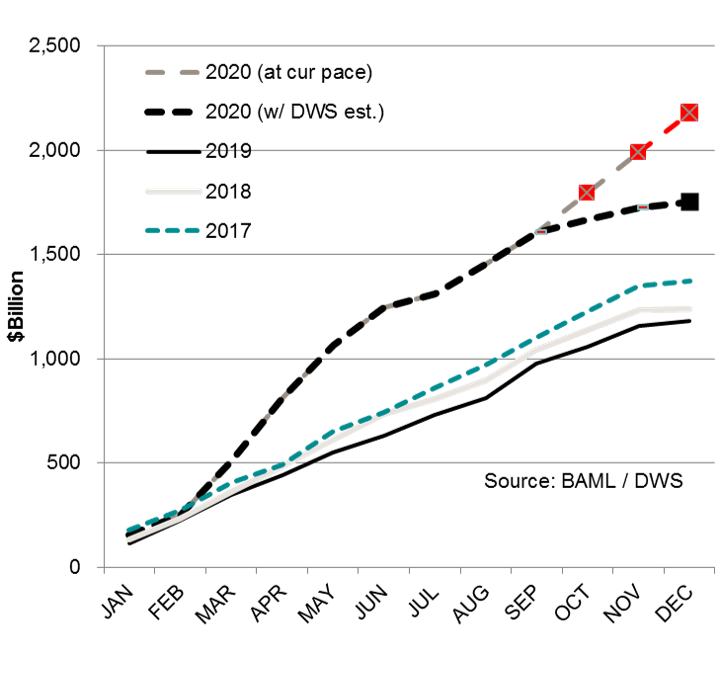
While the investment-grade market in 2020 has experienced turmoil related to COVID-19, another factor in the market has been the surge in new supply. Through three quarters, issuance has far exceeded that of the previous three years, as companies have sought to bolster their balance sheets for what they thought could be an extended or double-dip recession.
As the chart below shows (See Figure 1), our estimate of total issuance for the year would surpass that of 2019 by an even greater amount if the year-to-date pace remained elevated. In our estimation, however, this pace is likely to level off for the remainder of the year and that issuance will proceed at a slower pace into 2021.
FIGURE 1: PRIMARY USD CREDIT ISSUANCE
Primary market issuance ($Bln). Sept. and Q4 2020 are DWS estimates.
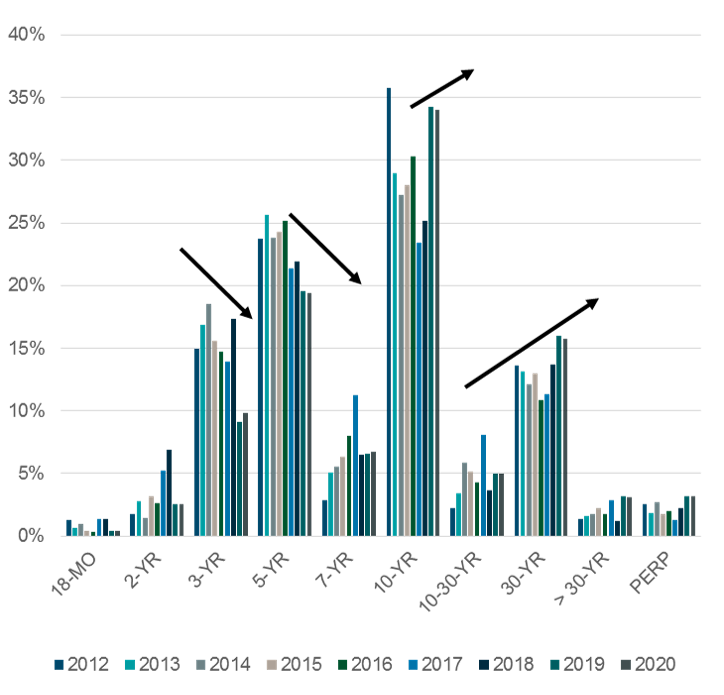
Issuance has not only risen, it has also been concentrated in longer maturities. While it has declined in short-duration bonds, it has risen in longer-duration bonds (See Figure 2). What accounts for this disparity? Although the yield curve is relatively steep between five and 10 years, between five and 20 years, and between five and 30 years, long-term rates are low by historical standards. Thus, it is not much more expensive to finance at longer-term rates than it is at shorter-term rates.
So, companies are issuing longer debt in order to lock in for the long term the financial flexibility that comes with lower rates. In fact, some companies are making tender offers to buy back short maturities and replace it with longer-term debt.
FIGURE 2: ISSUANCE OF LONG-TERM BONDS HAS OUTPACED SHORT-TERM BONDS
Will this surge in issuance result in lower prices in the near term? This surge is somewhat misleading. To put the issuance of the past two years into context, DWS considered net supply. Net supply takes into account call options, tender offers and repurchases. When these factors are considered, the amount of assets in the market that need to be absorbed, is quite low. As the chart shows (See Figure 3), net supply is declining rapidly.
We expect flows into the investment-grade market to absorb this excess supply and believe that these flows will be more than sufficient even if interest rates rise or if demand weakens somewhat.
Ratings: Downgrades have increased, but the storm has passed
Investors have been wary of credit rating downgrades since the emergence of the pandemic.
Although the aggregate amount is high, it is comparable to the downgrades seen in the past during other critical episodes. On the other hand, it does not begin to approach the levels seen during the Great Financial Crisis, even though today’s market is three times as large.
The chart (See Figure 4) shows ratings downgrades during four major episodes over the last 10 years: 2020’s COVID-19 pandemic, the commodity crisis of 2015-16, the downgrade of the U.S. in 2011, and the Great Financial Crisis (GFC) of 2008-09
On a relative basis, ratings downgrades are more moderate than during the GFC
DWS looked at these downgrades in detail and found that there are certain factors driving them. While the number of BBB issues has increased and is likely to exceed the historical high of 50% of the market, the number of BBB- issues has declined. Thus, we believe the concern over the rise in BBB issues is not properly focused, as BBB- issuers pose a higher credit risk.
FIGURE 3: SUPPLY IN EXCESS OF ALL OF NORMAL MARKET ACTIVITY AND THE REDEPLOYMENT OF RISK CONTINUES TO BE VERY LOW.
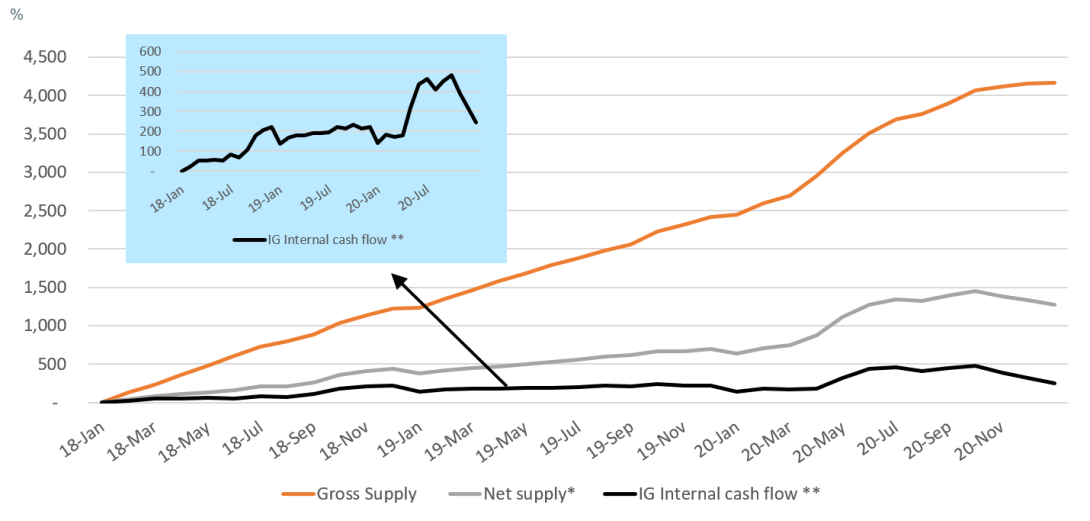
FIGURE 4: ON A RELATIVE SCALE, YTD RATING ACTIONS ARE MORE MODERATE THAN DURING THE GREAT FINANCIAL CRISIS (GFC)

We believe the rise in BBB issues is occurring because companies see little impact in migrating down from higher ratings (See Figure 5). The cost of debt rated BBB is not much more expensive than at debt rated A.
Why is the number of BBB- bonds declining? Companies that approach high yield status face higher interest costs and greater difficulty in accessing capital markets. The difference in the cost of funding between A and BBB amounts to just 20 to 25 basis points as of early November. In contrast, the cost of funding between a BBB- and a high-yield name could vary by as much as 200 basis points. In addition, at BBB-, a company may not be able to issue as much as it needs. So, BBB- supply has declined as companies have sought to maintain access to plentiful and low-cost funding.
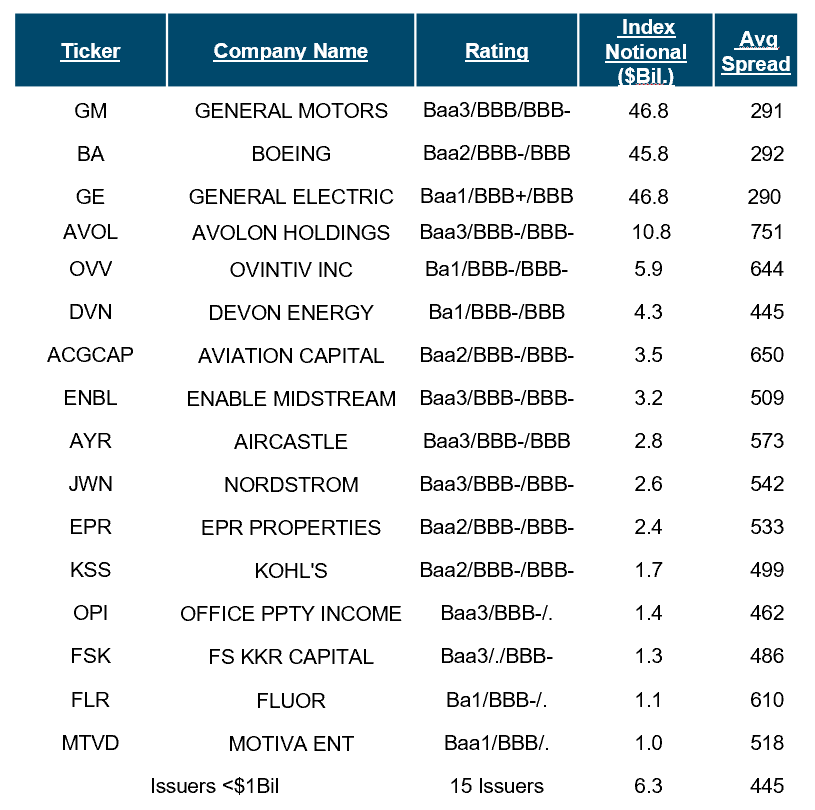
Some companies, however, have been unable to avoid the down migration. But while there will always be “fallen angels,” DWS believes the storm is passed. As the chart shows (See Figure 6), only three large issuers have the potential to migrate lower: GE, Boeing and GM. In fact, we don’t expect this to happen in the near term. So, while there is risk in the investment-grade market, we think that risk is manageable.
FIGURE 5: THE TREND IN BBB - IS VERY DIFFERENT FROM ALL BBBS
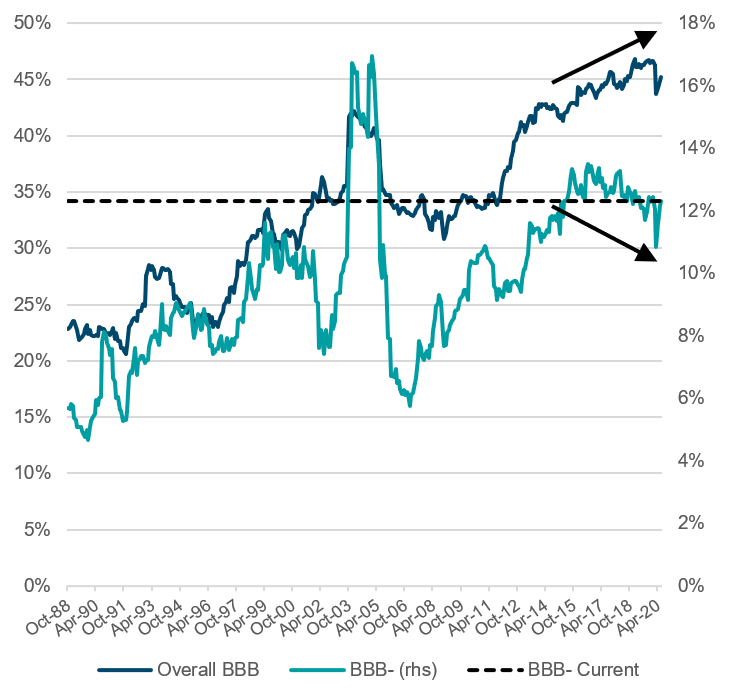
FIGURE 6: POTENTIAL FALLEN ANGELS: GM, BA AND GE PLUS IG INDEX BBB ISSUERS TRADING AT BB-SPREADS OR WIDER
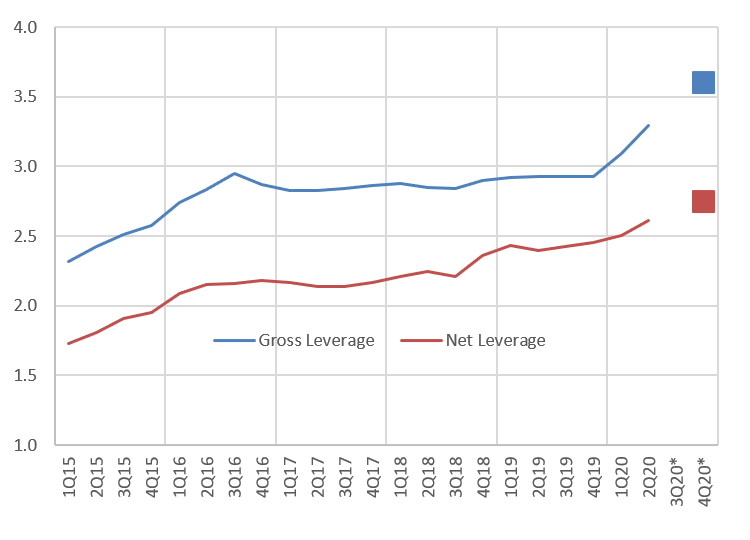
Many issuers have performed well during this period, supported by monetary and fiscal policy, and by the market, which has allowed them to issue debt to improve their financial flexibility. As a result, leverage has increased considerably. But the increase in net leverage has been more moderate. This means that although companies are issuing debt, they’re keeping the proceeds on their balance sheet in the form of cash, bolstering their financial health.
This does not mean that the increase in leverage presents no risk. These debt levels could become permanent, or the new debt might not be used to reduce leverage and improve balance sheets (See Figure 7).
Given higher levels of debt, another risk is the economy. The economic recovery could proceed more slowly than anticipated. Issuers might then have less ability to raise additional debt to help them through this period, which could then become more difficult.
In addition, a slower economy could depress operating earnings and interest coverage ratios. In fact, EBITDA has fallen dramatically, though some sectors have been hit less hard, and this has resulted in a “K-shaped” recovery. While EBITDA has declined generally, if the energy, metals and utilities sectors are excluded, the deterioration has been minimal (See Figure 8).
If the economy continues to rebound, EBITDA should recover as well, and then the ability to manage these larger debt burdens should also be considerable. In addition, because much of this new debt has been issued at such low rates, this larger debt load should also be more manageable than it would be otherwise.
FIGURE 7: GROSS LEVERAGE IS EXPECTED TO KEEP RISING AS COMPANIES FORTIFY FINANCIAL FLEXIBILITY
Nevertheless, this situation bears watching, especially in light of the November 2020 election. Depending on the extent there is a different regulatory environment, this could make recovery in the energy industry, for example, more challenging.
FIGURE 8: A TALE OF TWO EBITDAS

In light of these conditions, some investors believe that current investment grade yield spreads are unreasonably tight. But, in reality, they are comparable to historical averages. In fact, given the technical conditions we’ve outlined, it is possible that spreads will move tighter. The chart (See Figure 9) shows the BofA Merrill Lynch five- to 10-year index. This index takes out some of the duration variability that has occurred in larger indices over time.
Data through 2Q20 provided by JP Morgan. *DWS estimate. All opinions and estimates herein, including forecast returns, reflect our judgment on the date of this report and are subject to change without notice and involve a number of assumptions which may not prove valid.
FIGURE 9: INDEX OAS OF 200+ IS AT AN EXTRAORDINARY LEVEL, WHICH HAS BEEN BREACHED ONLY 10 TIMES IN NEARLY 60 YEARS.
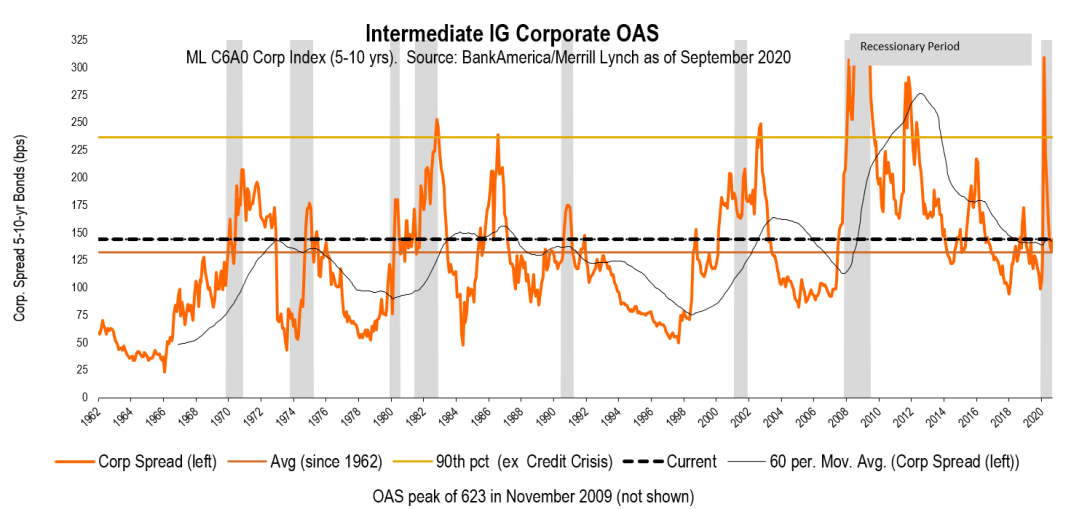
Even in this environment, DWS is not forecasting that spreads will get to levels seen in the late 1970s or mid-1990s. The European Central Bank has supported Europe’s investment-grade market, and a substantial portion of global sovereign debt is negative-yielding. So yields in U.S. investment-grade are tight because investors are looking for more attractive alternatives. U.S. investment-grade debt has been purchased by the Fed as well, so, on balance, there is a bias toward tighter rates despite the increase in supply that is likely in 2021.
Is it possible for investors to obtain a 3% yield level? While there are ways through some asset classes such as emerging markets or some less liquid areas of fixed income, there is, potentially, a credit-oriented way to reach that outcome.
That approach would entail moving down the capital structure or down in credit quality. BBB- companies can be questionable, but there are many that have been BBB- for quite some time and are relatively stable. So we believe that, in some cases, going down in quality is reasonable, and going down the capital structure can also make sense.
Duration can also be a way to increase yield, but we don’t think investors with a preference for five-year duration assets should necessarily rush out to buy 30-year assets. We’re not expecting a dramatic steepening of the yield curve, so interest rate risk is relatively small and taking on incremental duration risk can make sense. This could mean shifting merely from emphasizing five-year maturities to emphasizing six, seven or eight-year maturities.
FIGURE 10: CONSIDER THE ANALYSIS ON HOW ESG MADE A DIFFERENCE IN 2020
FOR ILLUSTRATIVE PURPOSES BASED ON METHODOLOGY COMPARISONS
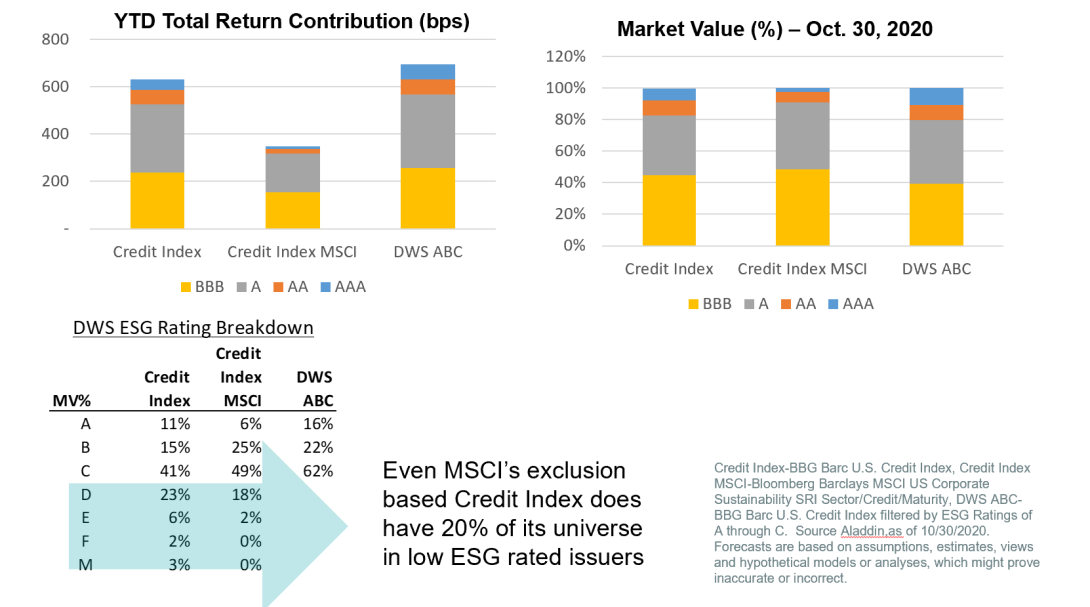
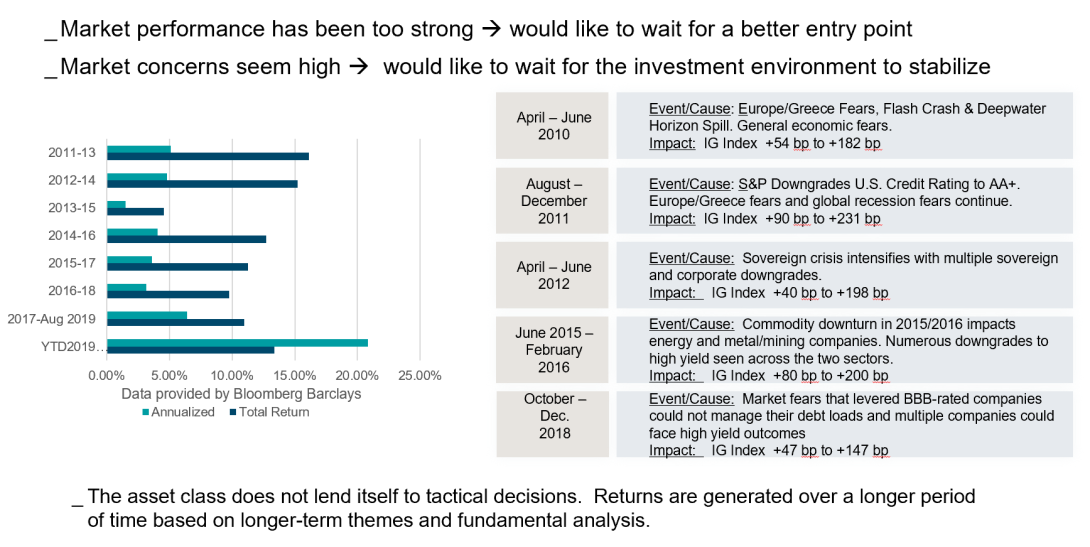
FIGURE 11: IT'S NEVER THE PERFECT TIME TO INVEST
In this unusual year, how has the ESG segment of the investment grade market held up? Companies with high ESG ratings are often industry leaders with higher valuations. Has this hurt performance?
DWS’s approach to ESG differs from that of many others. One approach that is used by much of the industry involves “exclusionary indices,” which remove certain sectors, such as tobacco, weapons, and energy. But wholesale exclusion of sectors can often hinder returns. We believe a more dynamic process presents less of a hindrance to performance.
Our process is similar to our overall approach for the investment grade asset class. For DWS, ESG is not an afterthought, it’s incorporated into the process. For example, if we’re considering a higher-quality BBB name, we’ll include the grade assigned by our ESG group into our analysis because there may be more idiosyncratic risk related to those ESG considerations.
Although DWS’s approach does not exclude whole sectors, it might remove some credits that are included in other approaches. For example, the following chart (See Figure 10) shows that over 30% of the investment grade market, as represented by the Bloomberg Barclays Corporate Credit Index, is unacceptable under our ESG process and methodology. That is, more than 30% have ESG grades of D through M. These are lower than the A, B or C ratings we normally would invest in. But even in the Bloomberg Barclays U.S. Corporate Sustainability Index (MSCI’s ESG exclusionary index), about 20% of the names have grades below the lowest we would consider.
Further, while DWS’s market views would exclude companies with low ESG grades, it allows us to maintain access to all sectors of the market and does not alter the ratings composition of the investment universe. The chart shows that the ratings composition of that universe roughly matches that of both the Bloomberg Barclays U.S. Credit Index and the Bloomberg Barclays U.S. Corporate Sustainability Index.
Unlike an exclusionary approach, our process is dynamic in much the same way that credit ratings are dynamic. So, for example, we don’t say, “We don’t invest in BBB bonds, and therefore we exclude the energy sector.” But not all companies in the energy sector are rated BBB; some are rated higher. So rather than exclude whole sectors, DWS applies this issuer-based approach to ESG grades as well.
This is an important consideration, given that companies in the energy industry could improve their grades over time. Our ESG grades are updated on a monthly basis, and this is dynamic and specific to the issuer.
Is now the right time for investment-grade? History has shown the asset class to weather past crises
Because yield spreads have normalized, we are often asked whether now is a good time to buy investment grade debt. It’s our position that this is an asset class that is predicated on a strategic approach; it does not lend itself to tactical decisions. Returns are generated over long periods, based on secular themes and fundamental analysis, not short-term views about valuations (See Figure 11).
Over the past decade, four significant episodes have occurred in the bond market, some of which include multiple market-roiling events. Returns to investment grade debt have been positive despite these tumultuous periods. If an investor had invested at the beginning of the year and held that investment for the three subsequent years, they would have seen significant, positive total and excess fixed-income returns at the end of the period (based on the Bloomberg Barclays U.S. Investment Grade Index).
Of course, buying credit just before or during a period of market uncertainty can create doubt for investors. But if an investor is going to invest strategically, we believe it is better to be invested sooner rather than later. This means that even if an investor doesn’t invest when spreads are their widest, a strategic, long-term approach has the potential to be rewarded over time.
Please note certain information in this presentation constitutes forward-looking statements. Due to various risks, uncertainties and assumptions made in our analysis, actual events or results or the actual performance of the markets covered by this presentation report may differ materially from those described. The information herein reflect our current views only, are subject to change, and are not intended to be promissory or relied upon by the reader. There can be no certainty that events will turn out as we have opined herein. Forecasts are not a reliable indicator of future returns. Forecasts are based on assumptions, estimates, views and hypothetical models or analyses, which might prove inaccurate or incorrect.
For Institutional Investor and Registered Representative use only. Not to be shared publicly.
This document has been prepared without consideration of the investment needs, objectives or financial circumstances of any investor. Before making an investment decision, investors need to consider, with or without the assistance of an investment adviser, whether the investments and strategies described or provided by DWS, are appropriate, in light of their particular investment needs, objectives and financial circumstances. Furthermore, this document is for information/discussion purposes only and does not constitute an offer, recommendation or solicitation to conclude a transaction and should not be treated as giving investment advice.
The comments, opinions and estimates contained herein are based on or derived from publicly available information from sources that we believe to be reliable. We do not guarantee their accuracy. This material is for informational purposes only and sets forth our views as of this date. Past performance or any prediction or forecast is not indicative of future results. Investments are subject to risks, including possible loss of principal amount invested.
DWS does not give tax or legal advice. Investors should seek advice from their own tax experts and lawyers, in considering investments and strategies suggested by DWS. Investments with DWS are not guaranteed, unless specified.
Although information in this document has been obtained from sources believed to be reliable, we do not guarantee its accuracy, completeness or fairness, and it should not be relied upon as such. All opinions and estimates herein, including forecast returns, reflect our judgment on the date of this report and are subject to change without notice and involve a number of assumptions which may not prove valid.
Investing in financial markets involves a substantial degree of risk. There can be no assurance that investment ideas will achieve positive results. Investment losses may occur, and investors could lose some or all of their investment. No guarantee or representation is made that an investment idea, including, without limitation, the investment objective, diversification strategy, or risk monitoring goal, will be successful, and investment results may vary substantially over time. Investment losses may occur from time to time. Nothing herein is intended to imply that an investment may be considered “conservative”, “safe”, “risk free” or “risk averse”. Economic, market, and other conditions could also cause investments to alter their investment objectives, guidelines, and restrictions.
This publication contains forward looking statements. Forward looking statements include, but are not limited to assumptions, estimates, projections, opinions, models and hypothetical performance analysis. The forward looking statements expressed constitute the author’s judgment as of the date of this material. Forward looking statements involve significant elements of subjective judgments and analyses and changes thereto and/or consideration of different or additional factors could have a material impact on the results indicated. Therefore, actual results may vary, perhaps materially, from the results contained herein. No representation or warranty is made by DWS as to the reasonableness or completeness of such forward looking statements or to any other financial information contained herein. The terms of any investment will be exclusively subject to the detailed provisions, including risk considerations, contained in the Investment Management Agreement. When making an investment decision, you should rely on the final documentation relating to the transaction and not the summary contained herein.
The terms of any investment will be exclusively subject to the detailed provisions, including risk considerations, contained in the Investment Management Agreement. When making an investment decision, you should rely on the final documentation relating to the transaction and not the summary contained herein.
This document may not be reproduced or circulated without our written authority. The manner of circulation and distribution of this document may be restricted by law or regulation in certain countries, including the United States. This document is not directed to, or intended for distribution to or use by, any person or entity who is a citizen or resident of or located in any locality, state, country or other jurisdiction, including the United States, where such distribution, publication, availability or use would be contrary to law or regulation or which would subject DWS to any registration or licensing requirement within such jurisdiction not currently met within such jurisdiction. Persons into whose possession this document may come are required to inform themselves of, and to observe, such restrictions. War, terrorism, economic uncertainty, trade disputes, public health crises (including the recent pandemic spread of the novel coronavirus) and related geopolitical events could lead to increased market volatility, disruption to US and world economies and markets and may have significant adverse effects on the fund and its investments.
Environmental, social responsibility and corporate governance (ESG) related strategies seek to provide U.S. investors with access to assets that meet responsible investment criteria without sacrificing investment returns. Although we strive to incorporate an ESG criterion, as one of many other criteria, in our investment analysis, DWS Investment Management Americas Inc. (DIMA) is a fiduciary and will act in the best interests of the client and investment account. Thus, DIMA's investment team will not s
Unlock full access to our vast content library by registering as an institutional investor
RegisterUnlock full access to our vast content library by registering as an institutional investor .
Create an accountAlready have an account ? Sign in