The investors who have invested in Direct Lending (DL) have done so because of its potential to deliver higher returns and better diversification than can other credit instruments. Some investors, however, have been discouraged by what they perceive to be higher risks. The singular economic effects of efforts to control Covid-19 have challenged even the most creditworthy borrowers.
While the practice of lending dates back thousands of years, the structures we refer to as DL—senior loans to Small-, Middle-, and Large-Market companies made by nonbank lenders financed by long-term, locked-up capital—have come of age since the Global Financial Crisis (GFC). While there are data on the performance of DL during the GFC, the scale of the market today is different enough that some would argue that Covid is DL’s first true test. In any case, given the size of the market relative to even a decade ago, it is fair to say that the experience of most institutions has been defined by the longest bull market in recorded history.
» To test the validity of investors’ concerns about DL, we compared it with senior-secured loans (SSL) and high-yield bonds (HY) along two dimensions: risk and relative value.
» To compare risk, we synthesized two analyses: an ex ante credit ratings analysis, which compared SSL and HY markets using Credit Suisse indices with a subset of DL loans in our proprietary database;1 and an ex post sector analysis consisting of a Covid-specific market survey to which more than 50 general partners (GPs) responded. This led to a series of color-coded matrices that help us gauge Covid-19’s potential impact along several dimensions including creditworthiness and sector exposure.2
» Because gauging DL's vulnerability only partly explains how it might fare, we also conducted a relative value analysis, looking at DL's historical performance as compared with that of SSL and HY.
As we pointed out in our 2019 paper "Private Debt: A Late Cycle Guide," bank liquidity is often an early casualty in an economic downturn. Prior to unprecedented monetary action by central banks, the collapse brought on by Covid-19 was no different. But the onset of this crisis has been much more rapid than prior dislocations, the impact broader and deeper. While there is still considerable uncertainty about how the crisis will play out, there is sufficient data to compare the riskiness of these securities, and to assess the likelihood DL provides the strong risk-adjusted performance its proponents have come to expect.
Methods & Data
CREDIT RATINGS ANALYSIS
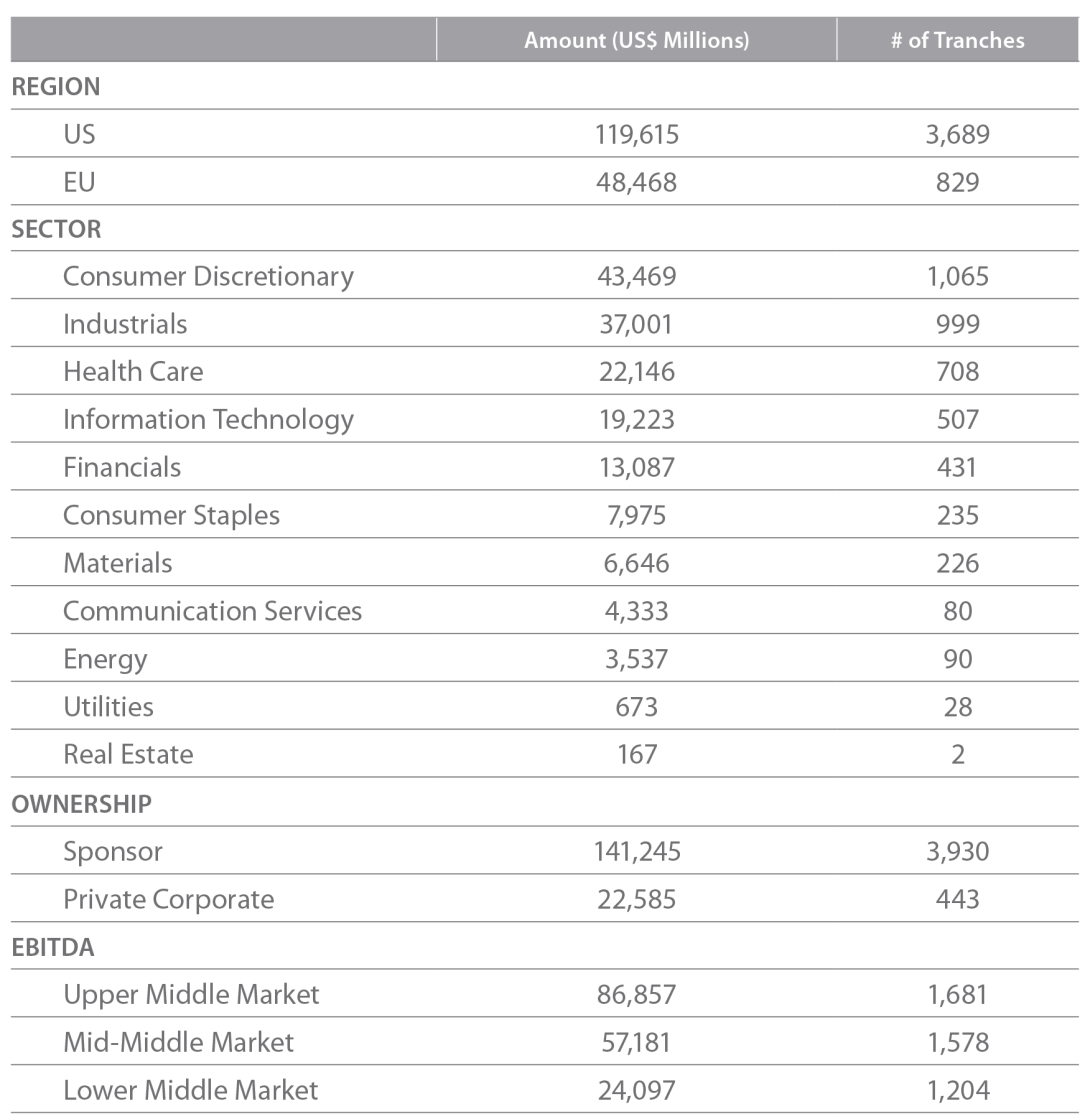
For the credit ratings analysis we drew from about 4,700 DL loans made since 2016, about 20% of which are loans that we have invested in; the remainder consists primarily of deals from GPs with which we do not have any outstanding investments. By including non-invested deals we hoped to mitigate selection bias. This analysis allowed us to compare the credit quality (among other things) of underlying assets in DL, SSL, and HY. For additional details, refer to Exhibit 1 in the Appendix.
SECTOR ANALYSIS
The sector analysis consisted of two parts. The first was a market survey to which more than 50 GPs responded, rating each industry as high, medium, or low vulnerability to Covid. For the second part, we examined each loan in a GP’s portfolio and inferred a risk level based on each borrower’s credit fundamentals.» In addition to providing a sight line to the operational changes GPs have made, the survey allowed us to evaluate each manager’s sector exposure and to incorporate their views on the prospects for each sector in a post-Covid world.
» Because risk can vary markedly, even within the same industry, examining each loan gave us a more nuanced view. Take health care, for example. Covid-19 has been a boon to most but not all segments of that industry. Dentists, for instance, have been negatively affected.
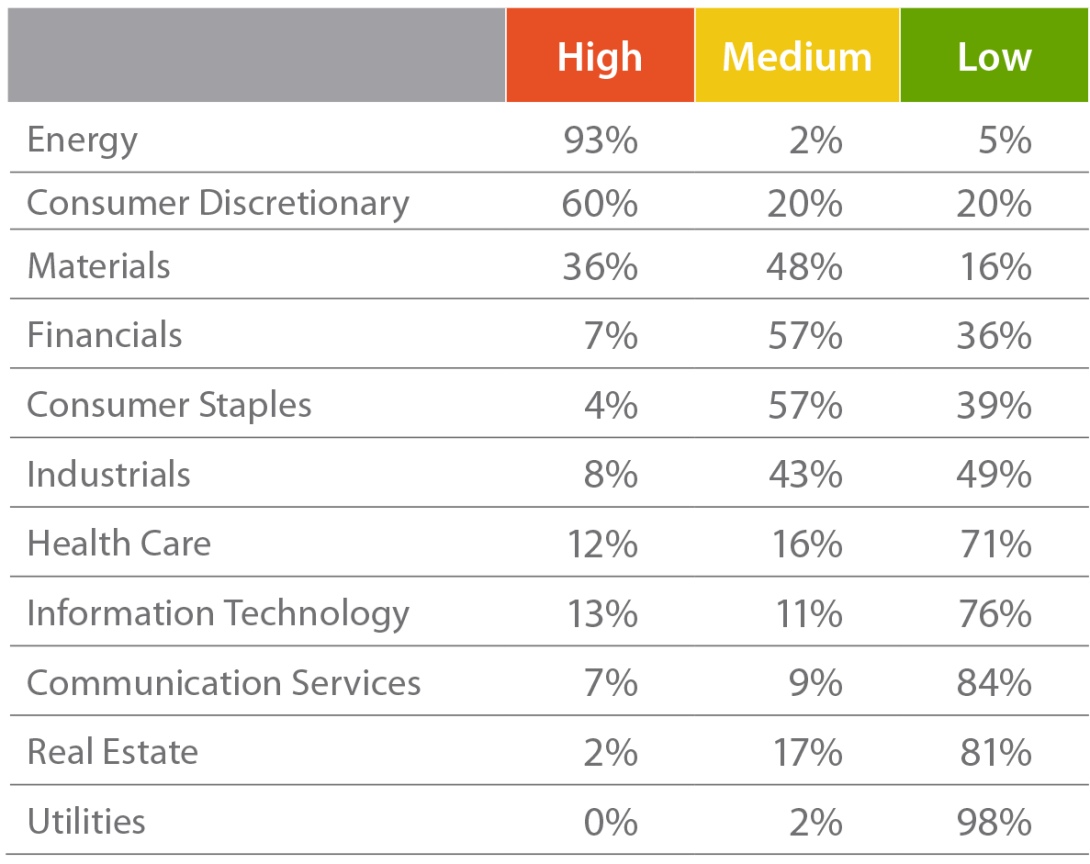
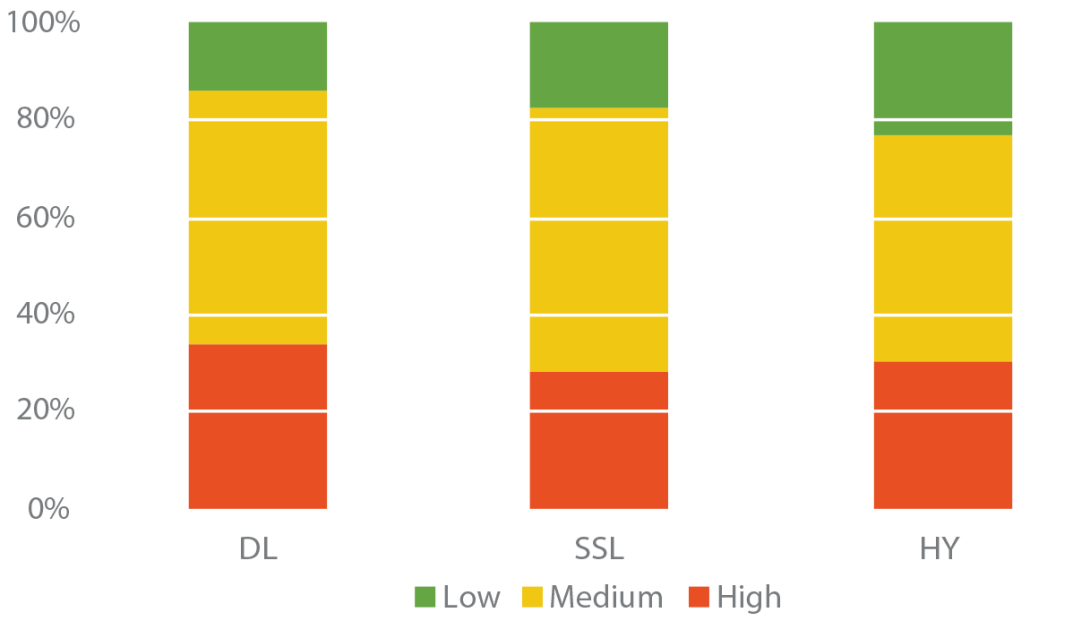
To derive an intuitive measure for each sector's vulnerability to Covid, we used the weighted average of the number of loans GPs have made in each sector. If a GP did not have any exposure to a particular sector, the survey results receive 100% of the weighting. Conversely, if a GP had a great deal of exposure to a given sector, we gave equal weight to the survey responses and the loan-by-loan review. We then aggregated the results and grouped them into the same three categories used by the GPs—high, medium, or low vulnerability (Figure 1).
FIGURE 1 | SUMMARY OF STEPSTONE GROUP DIRECT LENDING VULNERABILITY SURVEY
Source: StepStone Group, 2020.
SYNTHESIZING THE RESULTS
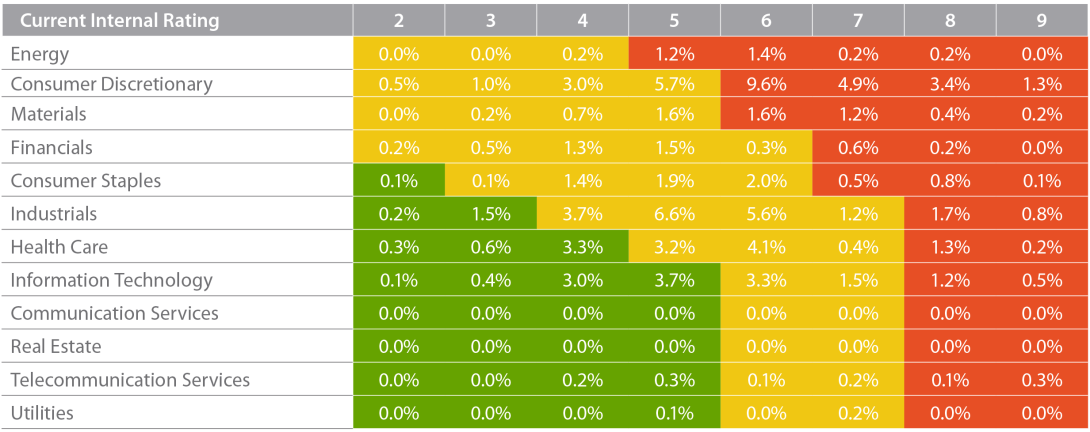
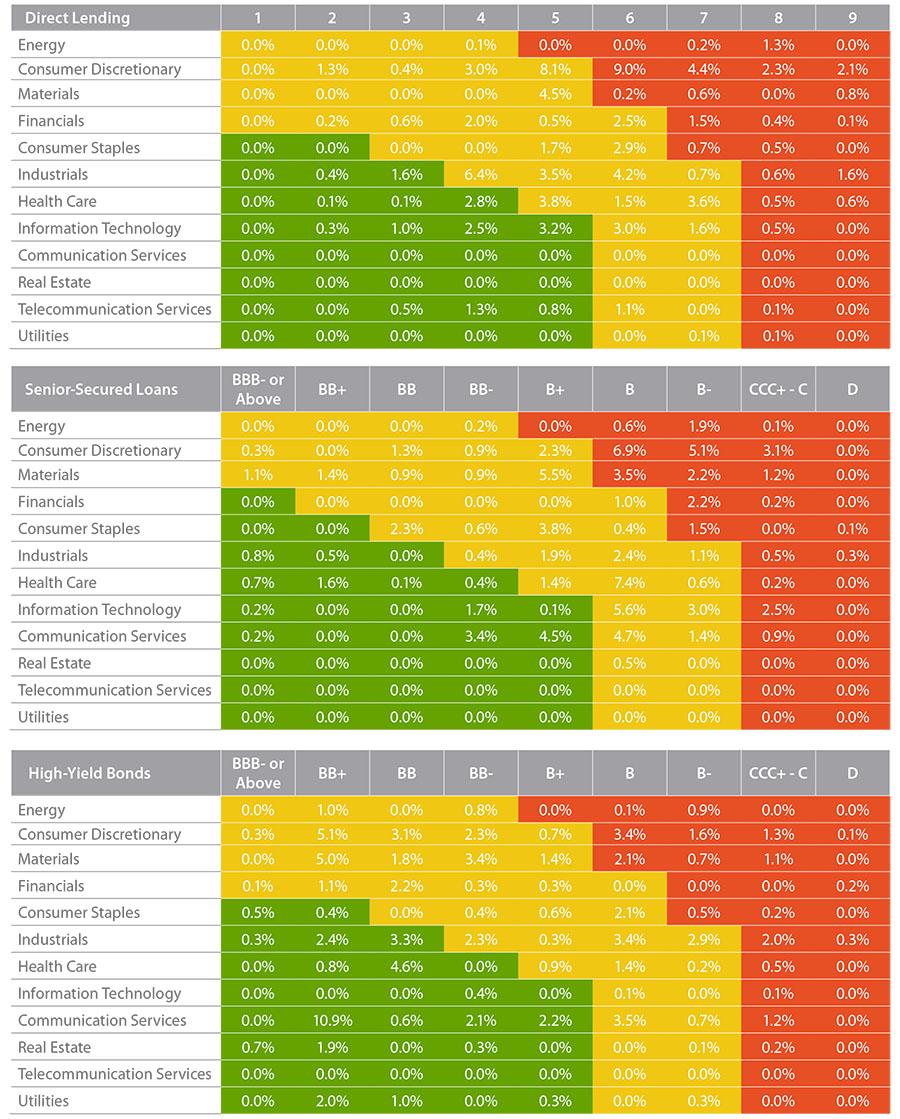
The final output of the credit and sector analyses was a series of matrices—one for each of DL, SSL, and HY. Each matrix groups loans as either high (red), medium (yellow), or low vulnerability (green) based on sector-specific Covid impact and the credit standing of individual borrowers. Credit ratings are along the x-axis, and industry classifications are along the y-axis. The percentages correspond with capital-weighted exposures.
To determine where each risk level begins and ends, we blended the results of the Sector Analysis with those of the Credit Ratings Analysis, taking into account the data from the loan-by-loan review, GP survey responses, and the ex ante credit ratings (Figure 3). We assumed what was risky in DL is also risky in the SSL and HY markets. Therefore, the “shape” and area of each color are the same for all three matrices.
FIGURE 3 | DIRECT LENDING CREDIT SECTOR MATRIX
Source: StepStone Group, 2020.
Note: Figure 3 applies solely to DL; the matrices for SSL and HY are available in Exhibits 6 and 7 in the Appendix.
Read the full article here
SSG Credit Ratings
While ratings for SSL and HY are publicly available, we score DL loans using an in-house ratings
scale. To estimate a company’s credit rating, we rely on two measures: the probability of default
and the probability of loss given default.
To estimate the probability of default, we utilize the fixed charge coverage (FCC), which represents
the cash flows available to repay interest and principal. The higher the ratio, the less probable it is
a company will miss a payment.
To estimate loss given default, we use the loan-to-value (LTV) ratio. A lower LTV corresponds to
lower expected loss given default because there will be more capital junior to the loan that can
absorb losses before they affect the loan being rated.
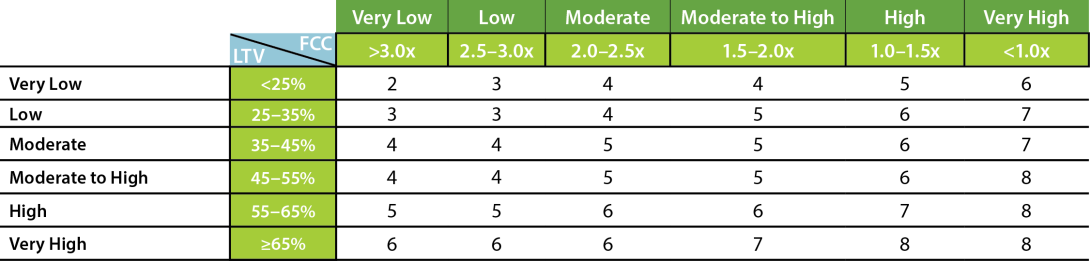
Figure 2 illustrates how we combine these two measures to infer a single credit rating. A “1”
corresponds loosely with an S&P rating of BBB- and above; a “9” is on par with a D.
FIGURE 2 | STEPSTONE CREDIT RATING
Source: StepStone Group, 2020.
Analysis3
CREDIT RATINGS
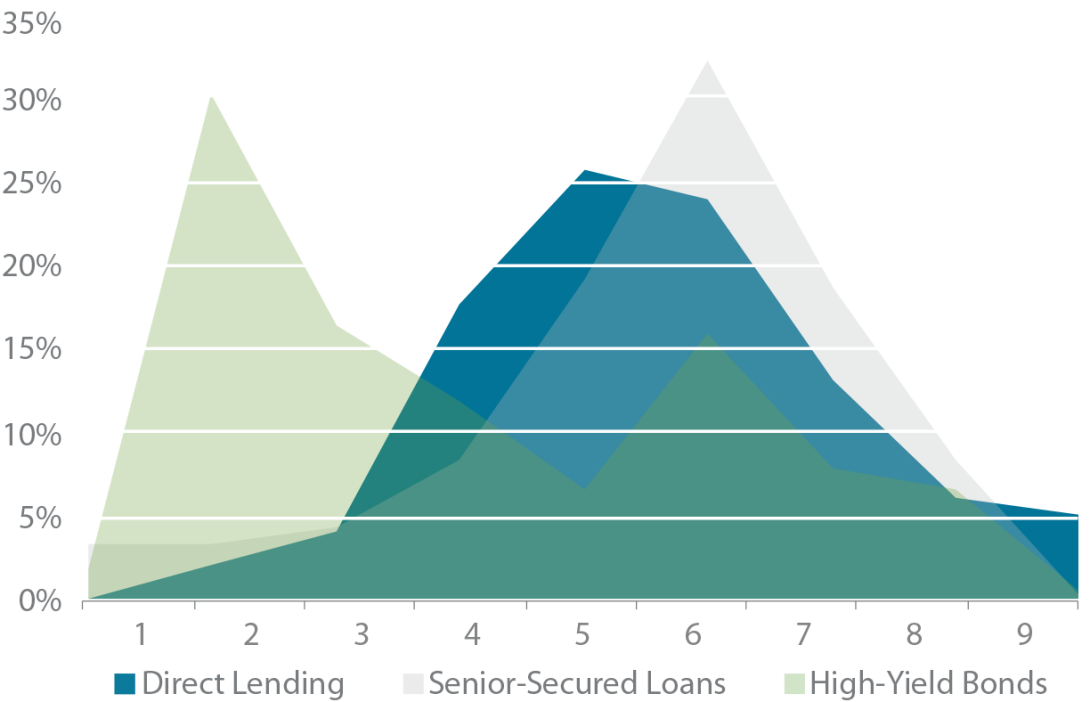
By converting our internal credit scores to their S&P analogues, we can compare risk in DL, SSL, and HY markets on the same basis. As seen in Figure 4, the capital-weighted average credit quality of DL and SSL markets is between B+ and B; the average rating for HY is closer to B+. Although the average ratings are similar, the distributions of rating differ across the three markets. Ratings in the HY market are more evenly distributed, whereas the ratings in DL are concentrated between B+ and B. SSL ratings fall between HY and DL.
FIGURE 4 | CREDIT RATINGS DISTRIBUTION: US

Source: StepStone Group; Credit Suisse, 2020.
SECTOR ANALYSIS
While the credit ratings provide a nice view of a portfolio’s risk profile when markets are tranquil, we need to examine sector exposure to understand better how a portfolio might react to this specific crisis. We needed to understand Covid’s effects on specific business models to assess the relative risk across different sectors. Not all companies in the energy sector are equally affected: Oil storage companies, for instance, are much less disrupted than oil and gas exploration businesses. So, to understand the vulnerability of a sector in this specific crisis, we combined GP expectations with a thorough look at the underlying borrowers.
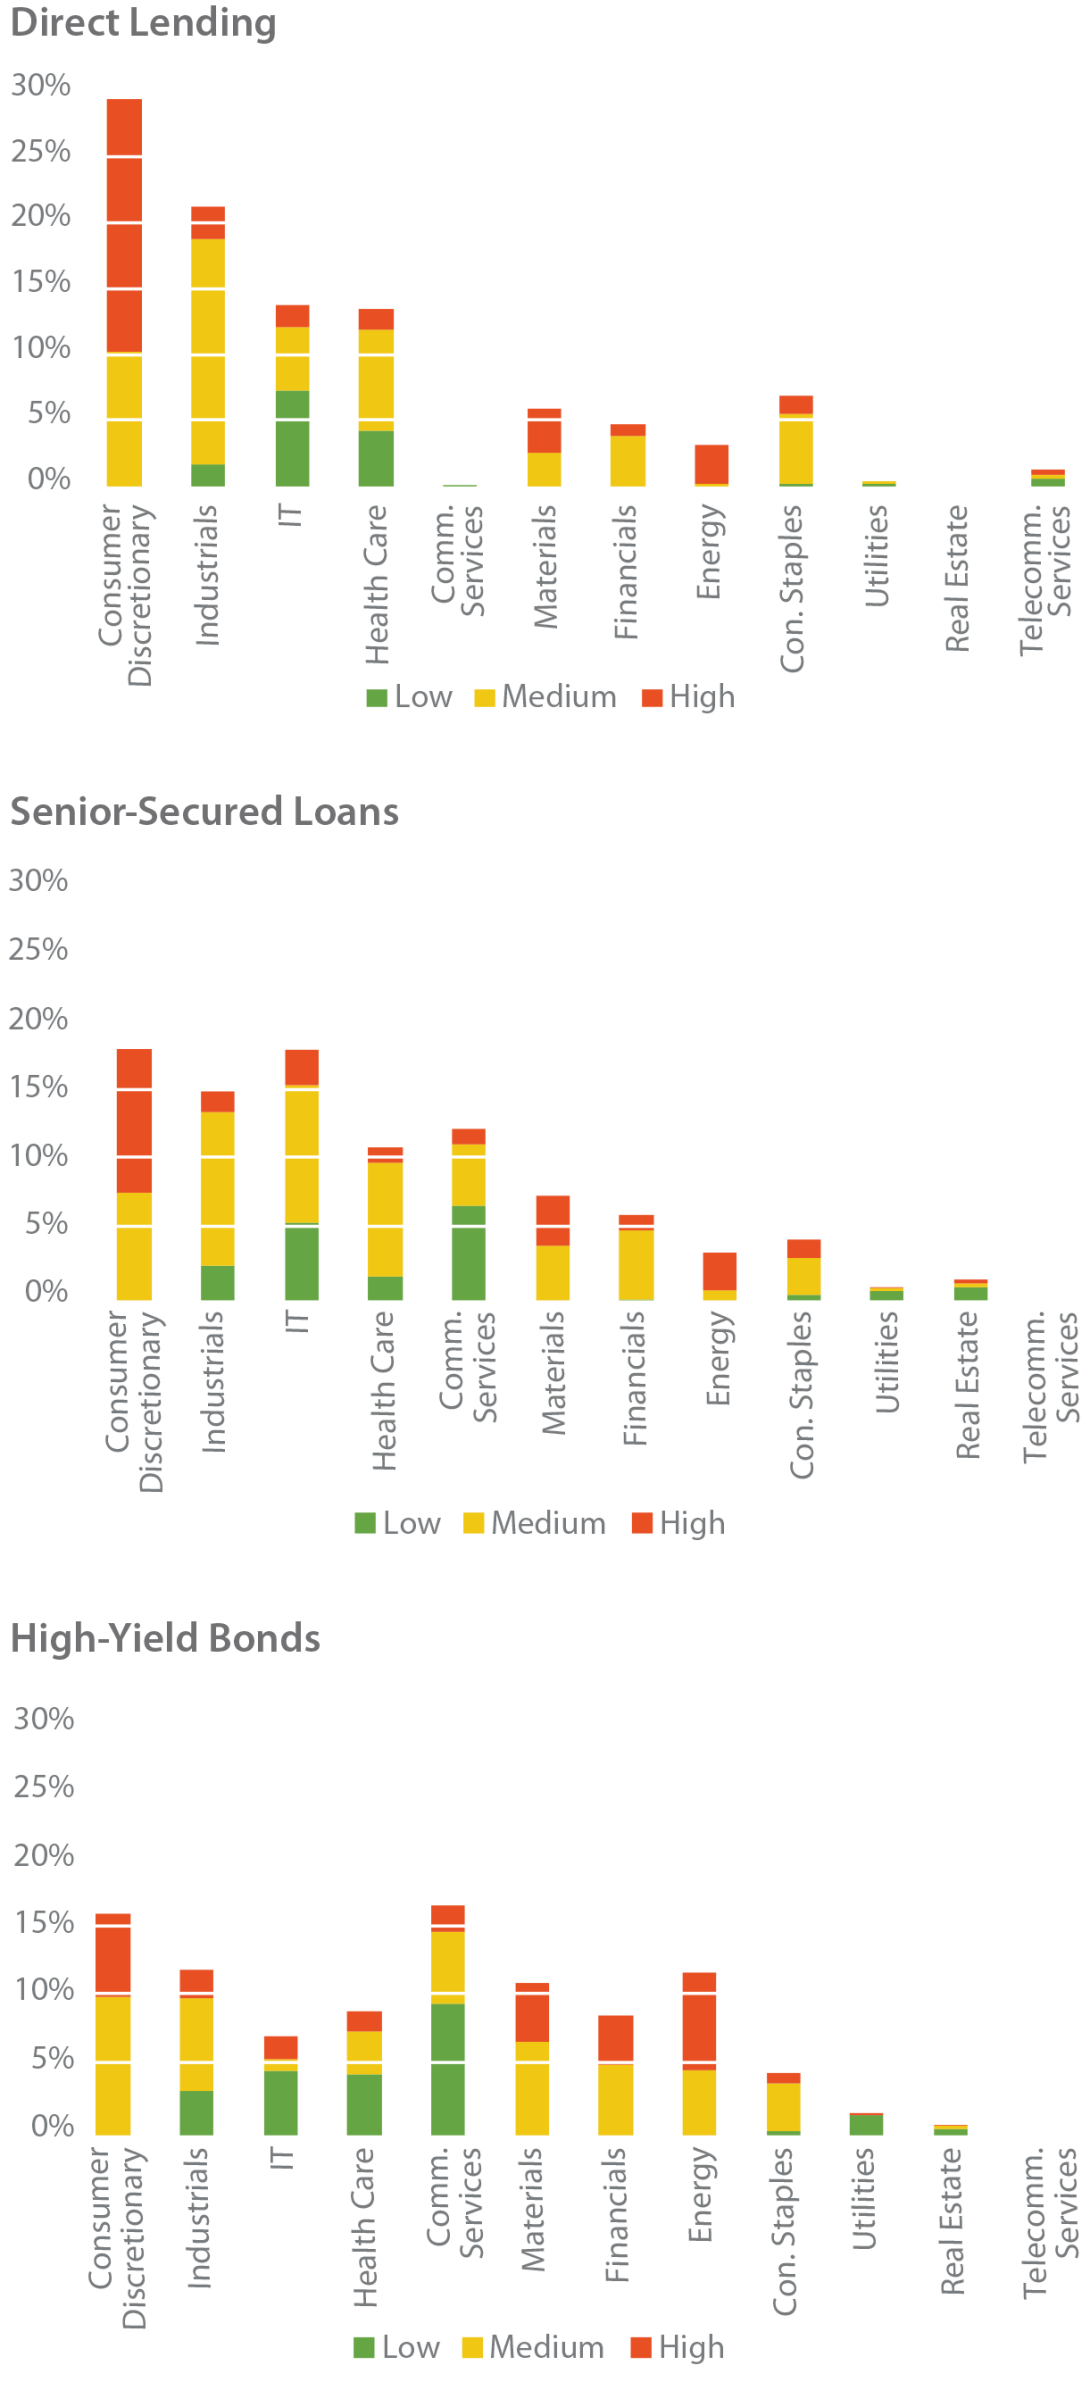
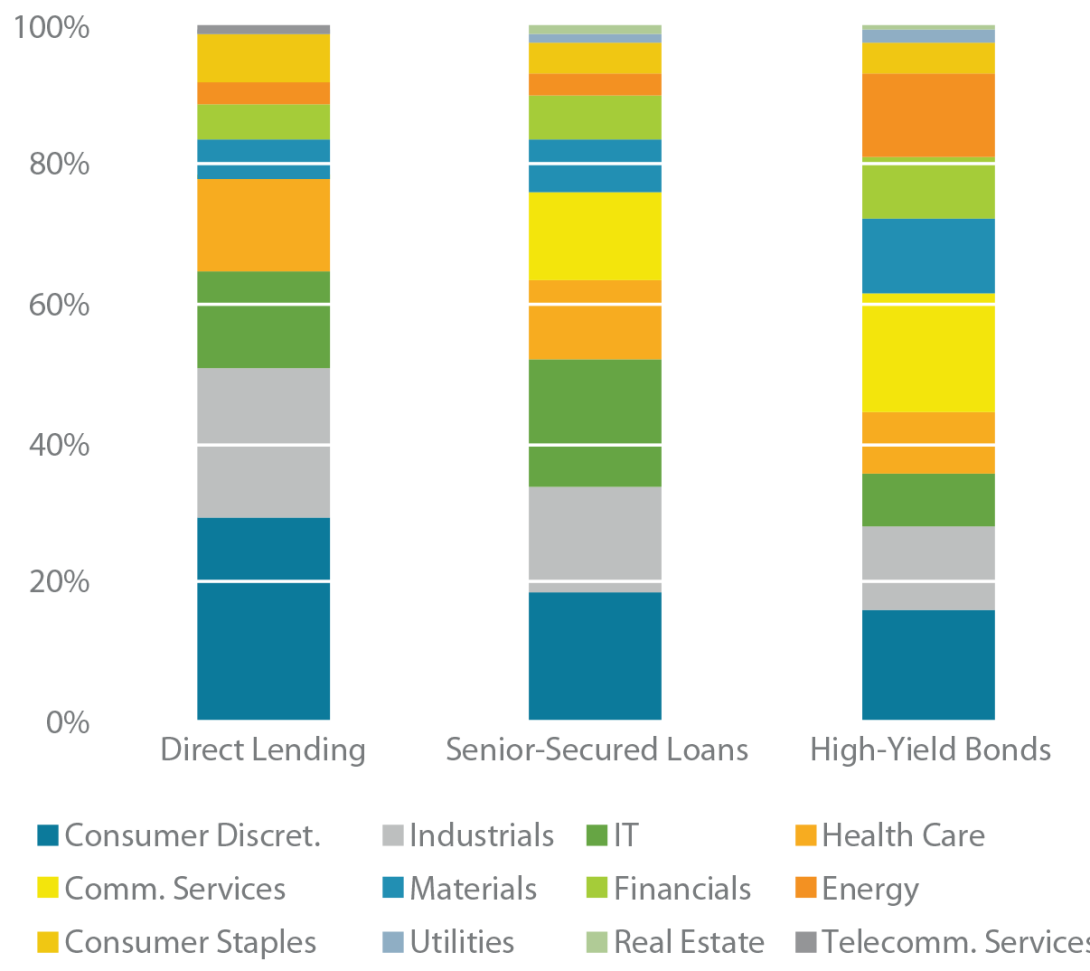
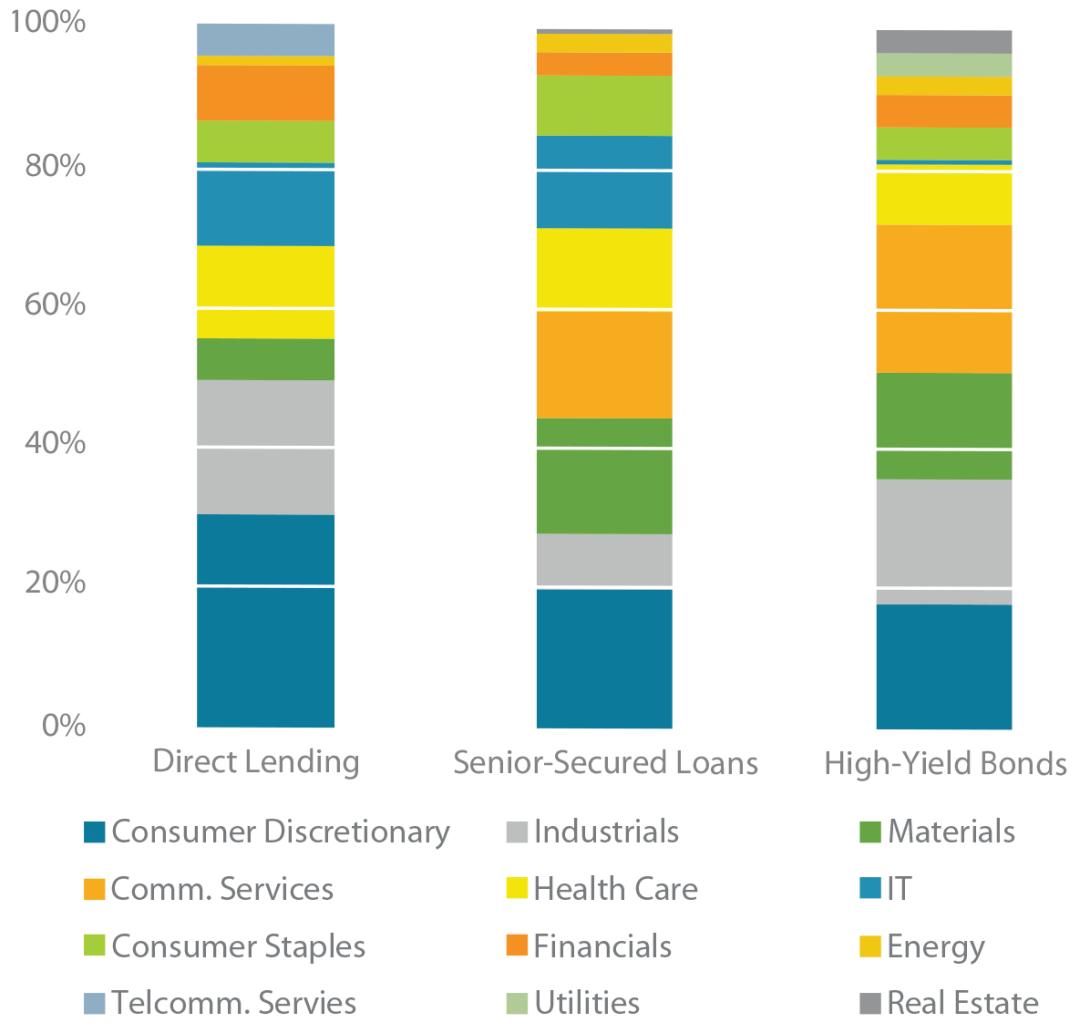
» Direct lenders held a guarded view of energy even before Covid. That sector accounts for just 3% of the capital-weighted exposure among the GPs we surveyed. By contrast, energy makes up about 12% of Credit Suisse’s HY index (Figure 5).
» DL’s high-risk loans are concentrated in a single industry: Consumer discretionary, which accounts for more than half of DL’s most vulnerable loans. Conversely, the exposure to high-risk loans is more diffuse in SSL and HY.
» DL’s low-risk loans are concentrated in IT, which accounts for 52% of exposure to low-risk loans. By contrast, both SSL's and HY's low-risk loans are concentrated in communication services.
FIGURE 5 | COVID-SPECIFIC SECTOR VULNERABILITY
Source: StepStone Group; Credit Suisse, 2020.
MATRIX ANALYSIS
A synthesized view makes it easier to evaluate vulnerability on the same basis for different markets, GPs, and portfolios. The matrix reflects neither the companies’ level of recovery nor realized losses—both of which depend upon various factors. For example, defaults for cov-lite transactions will occur later in the borrower’s underperformance, reducing the recovery rate. Ultimately, a GP’s ability to control and drive negotiations with troubled companies and sponsors will determine recovery and loss rates. Although the matrix may not allow us to determine ultimate risk, we believe it is a good indicator of borrower vulnerability. We would urge investors to monitor the evolution of GPs’ track records through a downturn and their ability to create alpha.
In Figure 6, we aggregated the results from each of the DL, SSL, and HY matrices, all of which are available in Exhibit 6 in the Appendix. This figure shows where the impact is occurring and may indicate which borrowers need to be monitored more diligently.
That determination is different for each type of credit instrument. Still, the analysis suggests Covid may have a larger impact on DL owing to the specific sector impact of the event. But this high-level categorization is not the same as risk itself. Differences in the way DL, SSL, and HY are structured will affect loss rates. Each of these credit instruments also offers different return potentials. Disciplined portfolio construction can be yet another differentiator.
Asset selection aside, it appears that DL borrowers are modestly more affected by Covid than are SSL and HY. The question is, are DL investors compensated for bearing this additional risk?
FIGURE 6 | SUMMARY OF MATRICIES
Source: StepStone Group; Credit Suisse, 2020.
Portfolio Construction
The results presented in Figures 5 and 6 underscore the importance of portfolio design, manager selection, and the pitfalls of index investing. In our experience, the following underwriting behaviors have helped DL investors to outperform the broader market:
» Limit risk. Irrespective of Covid, the credit ratings show the creditworthiness of the underlying borrower. Investors ought to have in place investment guidelines that limit the amount of exposure to high-risk or over-leveraged borrowers.
» Diversify. No one could have predicted Covid and the adverse impact it has had on certain sectors. Had this been a computer virus or some other calamity, the results of our vulnerability assessment would have been markedly different. All this is to say that investors should avoid placing bets on individual sectors. We have found setting an upward limit on the amount invested in each sector an effective way to avoid sector concentration.
» Insist upon covenants. Anecdotally, everyone understands the importance of covenants. But as demand has grown for alternative financing solutions, many direct lenders have been given to taking fewer protections for themselves.
We have found that just a single covenant can cut loss rates significantly.4
Relative Value
LOSS-ADJUSTED YIELDS
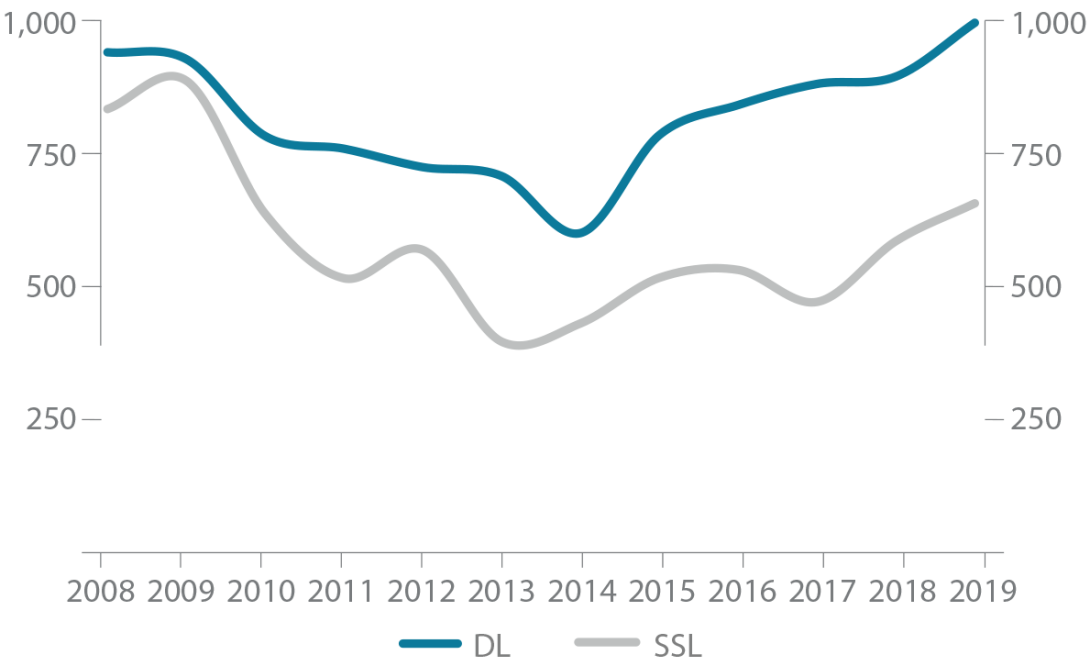
To assess the relative value of each of the credit instruments, we first looked at their yield-generating potential. The yields presented in Figure 7 are based on the year the loan was originated (i.e., vintage); they are net of losses and gross of fees. There are several reasons why we believe DL's loss-adjusted performance is attractive:
- The illiquidity premium for investing in private markets. Many fixed-income investors value liquidity and therefore need marketable securities. Borrowers must pay direct lenders higher returns to attract sufficient capital willing to bear the illiquidity inherent in a DL portfolio—on average, DL loans repay after three years.
- Greater exposure to smaller companies. Yields on loans to companies at the lower end of the market tend to be higher. These loans also tend to be stricter. Cov-lite deals might be the market standard for SSL, but they tend to be less common in DL. Again, just a single covenant can preserve capital significantly.
- Historically higher recovery rates. Because of these greater protections, direct lenders are able to recover more capital than can traditional lenders. As the Covid crisis continues to unfold, we expect recovery rates for SSL to remain lower relative to DL.
- Alignment of interests between debt and equity holders. Most borrowers in the Middle Market are owned by private equity companies. If a borrower starts to underperform, both the direct lender and the private equity holder are motivated by management and performance fees to help the company regain its footing. Private equity companies can provide a capital infusion; direct lenders can defer interest payments or amend the terms of the loan.
- Additional return drivers. Yields (and target returns) are often projected with an assumed tenor of three years. If the borrower repays sooner, the amortization rate increases and, in many cases, direct lenders are entitled to receive early termination fees—both of which result in higher yields.
FIGURE 7 | LOSS-ADJUSTED YIELDS (BASIS POINTS)
Source: StepStone Group; Credit Suisse, 2020.
TOTAL RETURNS
When comparing the total returns that DL, SSL, and HY have delivered since 2004, it is clear DL generated the highest, most stable returns (Figure 8). The difference: a higher cash coupon and significantly lower drawdowns relative to listed fixed-income markets.
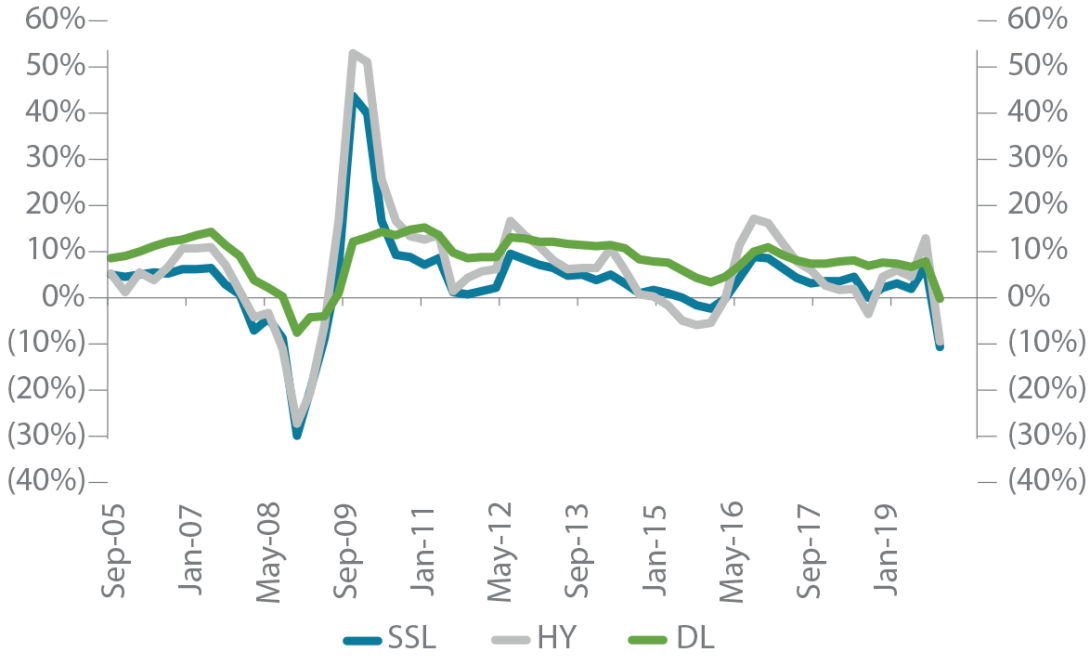
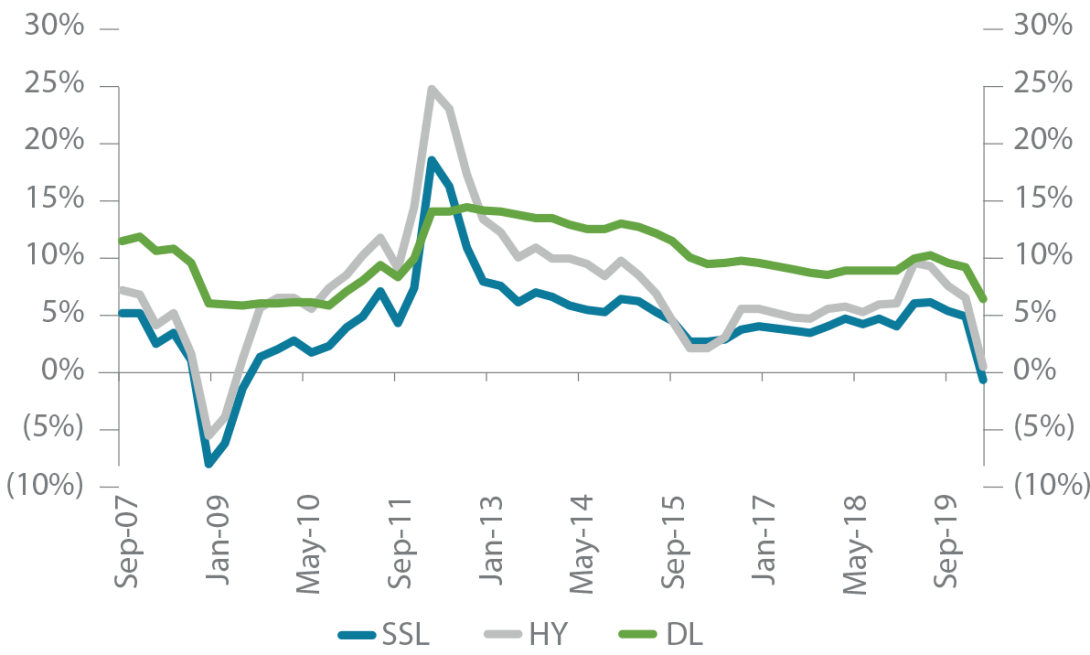
DL’s higher, less volatile return potential is even more apparent when looking at the 12- and 36-month rolling returns pre- and post-GFC (Figures 9 & 10).
» During periods of greater uncertainty, listed markets tend to overreact, leading to big swings in performance. The inherent illiquidity of DL, on the other hand, resulted in smoother, less volatile returns.
» During the recovery, returns for all three instruments stabilized; at times, DL outperformed by several percentage points.
» During the current crisis, valuations in listed debt markets did not recover until after central banks began buying assets on the primary and secondary markets. Without continued support, a correction in listed markets could happen again, making the appeal of SSL and HY questionable.
FIGURE 8 | CUMULATIVE PERFORMANCE

Source: Credit Suisse; Cliffwater, 2020.
FIGURE 9 | 12-MONTH ROLLING RETURNS
Source: Credit Suisse; Cliffwater, 2020.
FIGURE 10 | 36-MONTH ROLLING RETURNS
Source: Credit Suisse; Cliffwater, 2020.
Conclusion
Covid-19 has adversely affected the world’s economy more than any other recent phenomenon. Though it is still much too early to know how credit markets will be affected, by estimating the riskiness of each sector, we hope to provide an educated guess as to the outcome. Our two-part assessment allowed us to gauge the vulnerability of DL at the onset of Covid, as well as to get a feel for which sectors are most at risk. We find that ex ante risk, represented by credit ratings, is comparable between DL, SSL, and HY. While DL may be more vulnerable to Covid owing to sector exposure, our analysis shows that investors have been paid handsomely to bear this additional risk. Thanks to a higher cash coupon, more stable returns, an illiquidity premium, and greater rates of capital recovery, we believe DL will continue to outperform its counterparts on the listed markets.
Appendix
Exhibit 1 | Credit Ratings: Direct Lending
Source: StepStone Group, 2020.
Exhibit 2 | Credit Ratings Distributions: US

Source: StepStone Group; Credit Suisse, 2020.
Exhibit 3 | Credit Ratings Distributions: Europe
Source: StepStone Group; Credit Suisse, 2020.
Exhibit 4 | Sector Concentration by Credit Instrument: US
Source: StepStone Group; Credit Suisse, 2020.
Exhibit 5 | Sector Concentration by Credit Instrument: Europe
Source: StepStone Group; Credit Suisse, 2020.
Exhibit 6 | Industry/Credit Rating Matrices: US

Source: StepStone Group; Credit Suisse, 2020.
Exhibit 7 | Industry/Credit Rating Matrices: Europe
Source: StepStone Group; Credit Suisse, 2020.
1 SPI, our proprietary database, garners more than 1.7 million credit-specific data points across roughly 15,000 loans executed by 67 general partners. The data go back to 2000 but only become meaningful after 2004, when DL became a more established product and accepted method of financing.
2 The results of the risk study are unique to Covid-19; had this been a computer virus instead, the results would be very different.
3 The results presented in the body of paper apply solely to the US market. For details on Europe’s markets, refer to the appendix.
4 StepStone Group. 2019. "Private Debt: A Late Cycle Guide."
Read the full article here
This document is for information purposes only and has been compiled with publicly available information. StepStone makes no guarantees of the accuracy of the information provided. This information is for the use of StepStone’s clients and contacts only. This report is only provided for informational purposes. This report may include information that is based, in part or in full, on assumptions, models and/or other analysis (not all of which may be described herein). StepStone makes no representation or warranty as to the reasonableness of such assumptions, models or analysis or the conclusions drawn. Any opinions expressed herein are current opinions as of the date hereof and are subject to change at any time. StepStone is not intending to provide investment, tax or other advice to you or any other party, and no information in this document is to be relied upon for the purpose of making or communicating investments or other decisions. Neither the information nor any opinion expressed in this report constitutes a solicitation, an offer or a recommendation to buy, sell or dispose of any investment, to engage in any other transaction or to provide any investment advice or service.
Past performance is not a guarantee of future results. Actual results may vary.
Each of StepStone Group LP, StepStone Group Real Assets LP and StepStone Group Real Estate LP is an investment adviser registered with the Securities and Exchange Commission (“SEC”). StepStone Group Europe LLP is authorized and regulated by the Financial Conduct Authority, firm reference number 551580. Swiss Capital Invest Holding (Dublin) Ltd (“SCHIDL”) is an SEC Registered Investment Advisor and Swiss Capital Alternative Investments AG (“SCAI”) (together with SCHIDL, “SwissCap”) is registered as a Relying Advisor with the SEC. Such registrations do not imply a certain level of skill or training and no inference to the contrary should be made.
Manager references herein are for illustrative purposes only and do not constitute investment recommendations.