Water and waste as the next frontier in improving sustainability in factor credits
We impose water and waste constraints on our factor credit strategies. This further improves the sustainability profile of these strategies while our backtested performance analysis revealed only a limited impact on performance.
Speed read
Environmental footprints vary strongly between companies
Footprint constraints show little impact on backtested performance
Portfolios now tilt away from water- and waste-intensive companies
The next step in improving the sustainability of our factor credit strategies is to reduce the water and waste footprints of the portfolios, in line with the principles of the Paris Agreement.1 2. We believe that, going forward, companies with lower environmental footprints will be more successful in the future.
Importantly, we find that quantitative investment strategies lend themselves well to integrating secondary objectives, such as reducing environmental footprints, in addition to the primary objective of realizing attractive risk-adjusted returns. This is due to the large investment universe that the strategy is able to screen for the most attractive opportunities. If a company with a relatively high footprint issues a bond with attractive factor scores, the portfolio construction algorithm often is able to find a bond with similar factor scores, but with lower footprints. This efficiently tilts the portfolio towards bonds of more sustainable companies, without having to forego a great deal of factor exposure.
Our research shows that imposing water and waste constraints ensures that the weighted average water and waste footprints of the portfolio are, at most, as high as those of the benchmark. This leads to small adjustments in portfolio allocation to sectors and in issuer selection within sectors, and results in a limited reduction in performance in backtested analysis.
Water and waste as measures to achieve a sustainable economy
The European Commission’s Sustainable Finance Action Plan recognizes the need for decarbonization to achieve a better and more sustainable future for all. It looks beyond climate change, though, and includes resource depletion and environmental degradation as focus areas. This has encouraged a broader approach to measuring environmental footprint; in addition to carbon emissions, water consumption and waste disposal are now two widely used footprint measures.
We measure a company’s water consumption as the difference between freshwater withdrawn and freshwater discharged, denoted in cubic meters. Freshwater is withdrawn from municipal water supplies, fresh surface water (lakes, rivers, etc.) and fresh groundwater. Brackish water and seawater are not considered freshwater. Hence, the withdrawal of such waters is excluded from the calculations. Water discharged, or water returned to the source of extraction, needs to be at a similar (or higher) quality as raw water extracted. If the total water consumption is higher than the net withdrawal (e.g., due to the use of recycled water), then the net withdrawal amount is used.
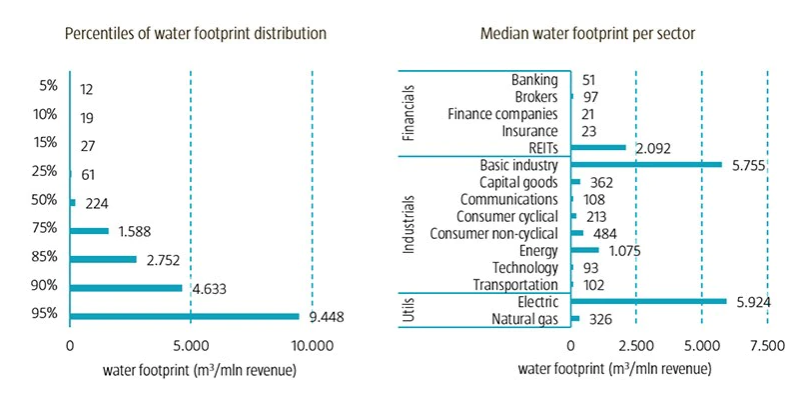
Figure 1 shows some summary statistics on the water footprint for a global universe of investment grade and high yield companies. The left chart shows that the median (50th percentile) company has a water footprint of 224 cubic meters per USD 1 million of revenues. The chart also shows that the distribution is heavily skewed: the 75th percentile is already more than six times larger than the median (1,588 vs. 224), and the 95th percentile, in turn, is six times larger than the 75th percentile (9,448 vs. 1,588). In fact, more than 75% of the total water footprint is related to only 10% of the companies.
The chart on the right shows the median water footprint per sector. Financials are less water intensive (with the exception of REITs), than technology and transportation companies. Utilities, on the other hand, have a higher water footprint, as have some of the industrial sectors, like basic industry and energy. The strong concentration of water use among only a few companies indicates that to efficiently reduce the water footprint of a portfolio it is best to avoid some of the most water-intensive companies.
Figure 1 | Water footprint for a global universe of investment grade and high yield companies
Source: Robeco, Bloomberg Barclays. Constituents of the Global Aggregate Corporates and Global High Yield Corporates ex. Financials indices, as of 14 June 2021.
Waste disposal
We measure a company’s waste disposal as the difference between total waste generated and total waste repurposed, denoted in metric tons. Total waste generated consists of hazardous and non-hazardous waste. Hazardous waste is waste that poses substantial or potential threats to public health or the environment. Non-hazardous waste does not pose a direct threat to human health or the environment, but could nevertheless pose a risk if it were dumped into a trash receptacle or a sewer line, for example. Waste stored temporarily counts towards waste generated. Total waste repurposed consists of recycled waste, (re-)used waste, sold waste and waste that has been incinerated for energy recovery.
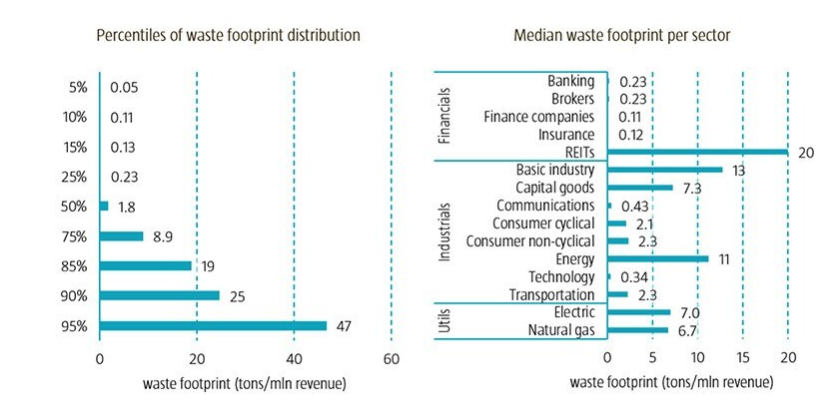
Figure 2 provides summary statistics on the waste footprint for the same global universe of investment grade and high yield companies. The left chart shows that the median company has a waste footprint of 1.8 tons per USD 1 million of revenues. The waste footprint distribution is also heavily right-skewed, with the 75th percentile being five times larger than the median (8.9 vs. 1.8), and the 95th percentile in turn being five times larger than the 75th percentile (46.6 vs. 8.9). In fact, more than 60% of the total waste footprint is related to only 10% of the companies. As is the case with the water footprint, there are large differences between sectors. Financials and communication & technology companies are among the sectors with the lowest waste disposal levels, while REITs, basic industry and energy are at the higher end of the scale. This finding illustrates that there generally is a positive correlation between the various measures of environmental footprints.
Figure 2 | Waste footprint for a global universe of investment grade and high yield companies
Source: Robeco, Bloomberg Barclays. Constituents of the Global Aggregate Corporates and Global High Yield Corporates ex. Financials indices, as of 14 June 2021.
We believe this approach to restricting the water and waste footprint helps to reduce transition risks in the portfolio, while still providing the potential for attractive risk-adjusted returns. As Robeco continues its active participation in the debate on sustainable investing, and on the role of the investment industry in this, our approach to reducing sustainability-related risks in the portfolio may evolve further.
1This article is based on a more detailed paper by the authors, entitled “Reducing the water and waste footprints of factor credit strategies”. 2See the article “Creating sustainable multi-factor bond portfolios”, which describes, among others, the sustainability approach in factor credits.