
T. Rowe Price -

2026 Midyear Market Outlook: Five Shifts Reshaping Markets

T. Rowe Price 2026 Midyear Market Outlook graphic representing five shifts reshaping markets, including geopolitics, inflation, energy, AI and market leadership.

What’s next for markets in 2026
Competing forces drive a broader, more complex opportunity set

Markets have been anything but stable in the first half of 2026. A sequence of geopolitically driven shocks has collided with surging artificial intelligence (AI) investment, robust corporate earnings, and solid U.S. economic growth. Risk assets have remained relatively strong amid these crosscurrents. But the danger for investors is mistaking resilience for calm.

Many of the themes we identified at the start of the year have broadly played out: AI-driven growth, broader equity market performance, and continued strength in credit, even with upward pressures on bond yields. Macro forces are now driving a new and more dispersed opportunity set as the AI trade moves into physical sectors and geopolitical fissures reshape the global economy. The market regime is changing.


Revisiting our 2026 expectations
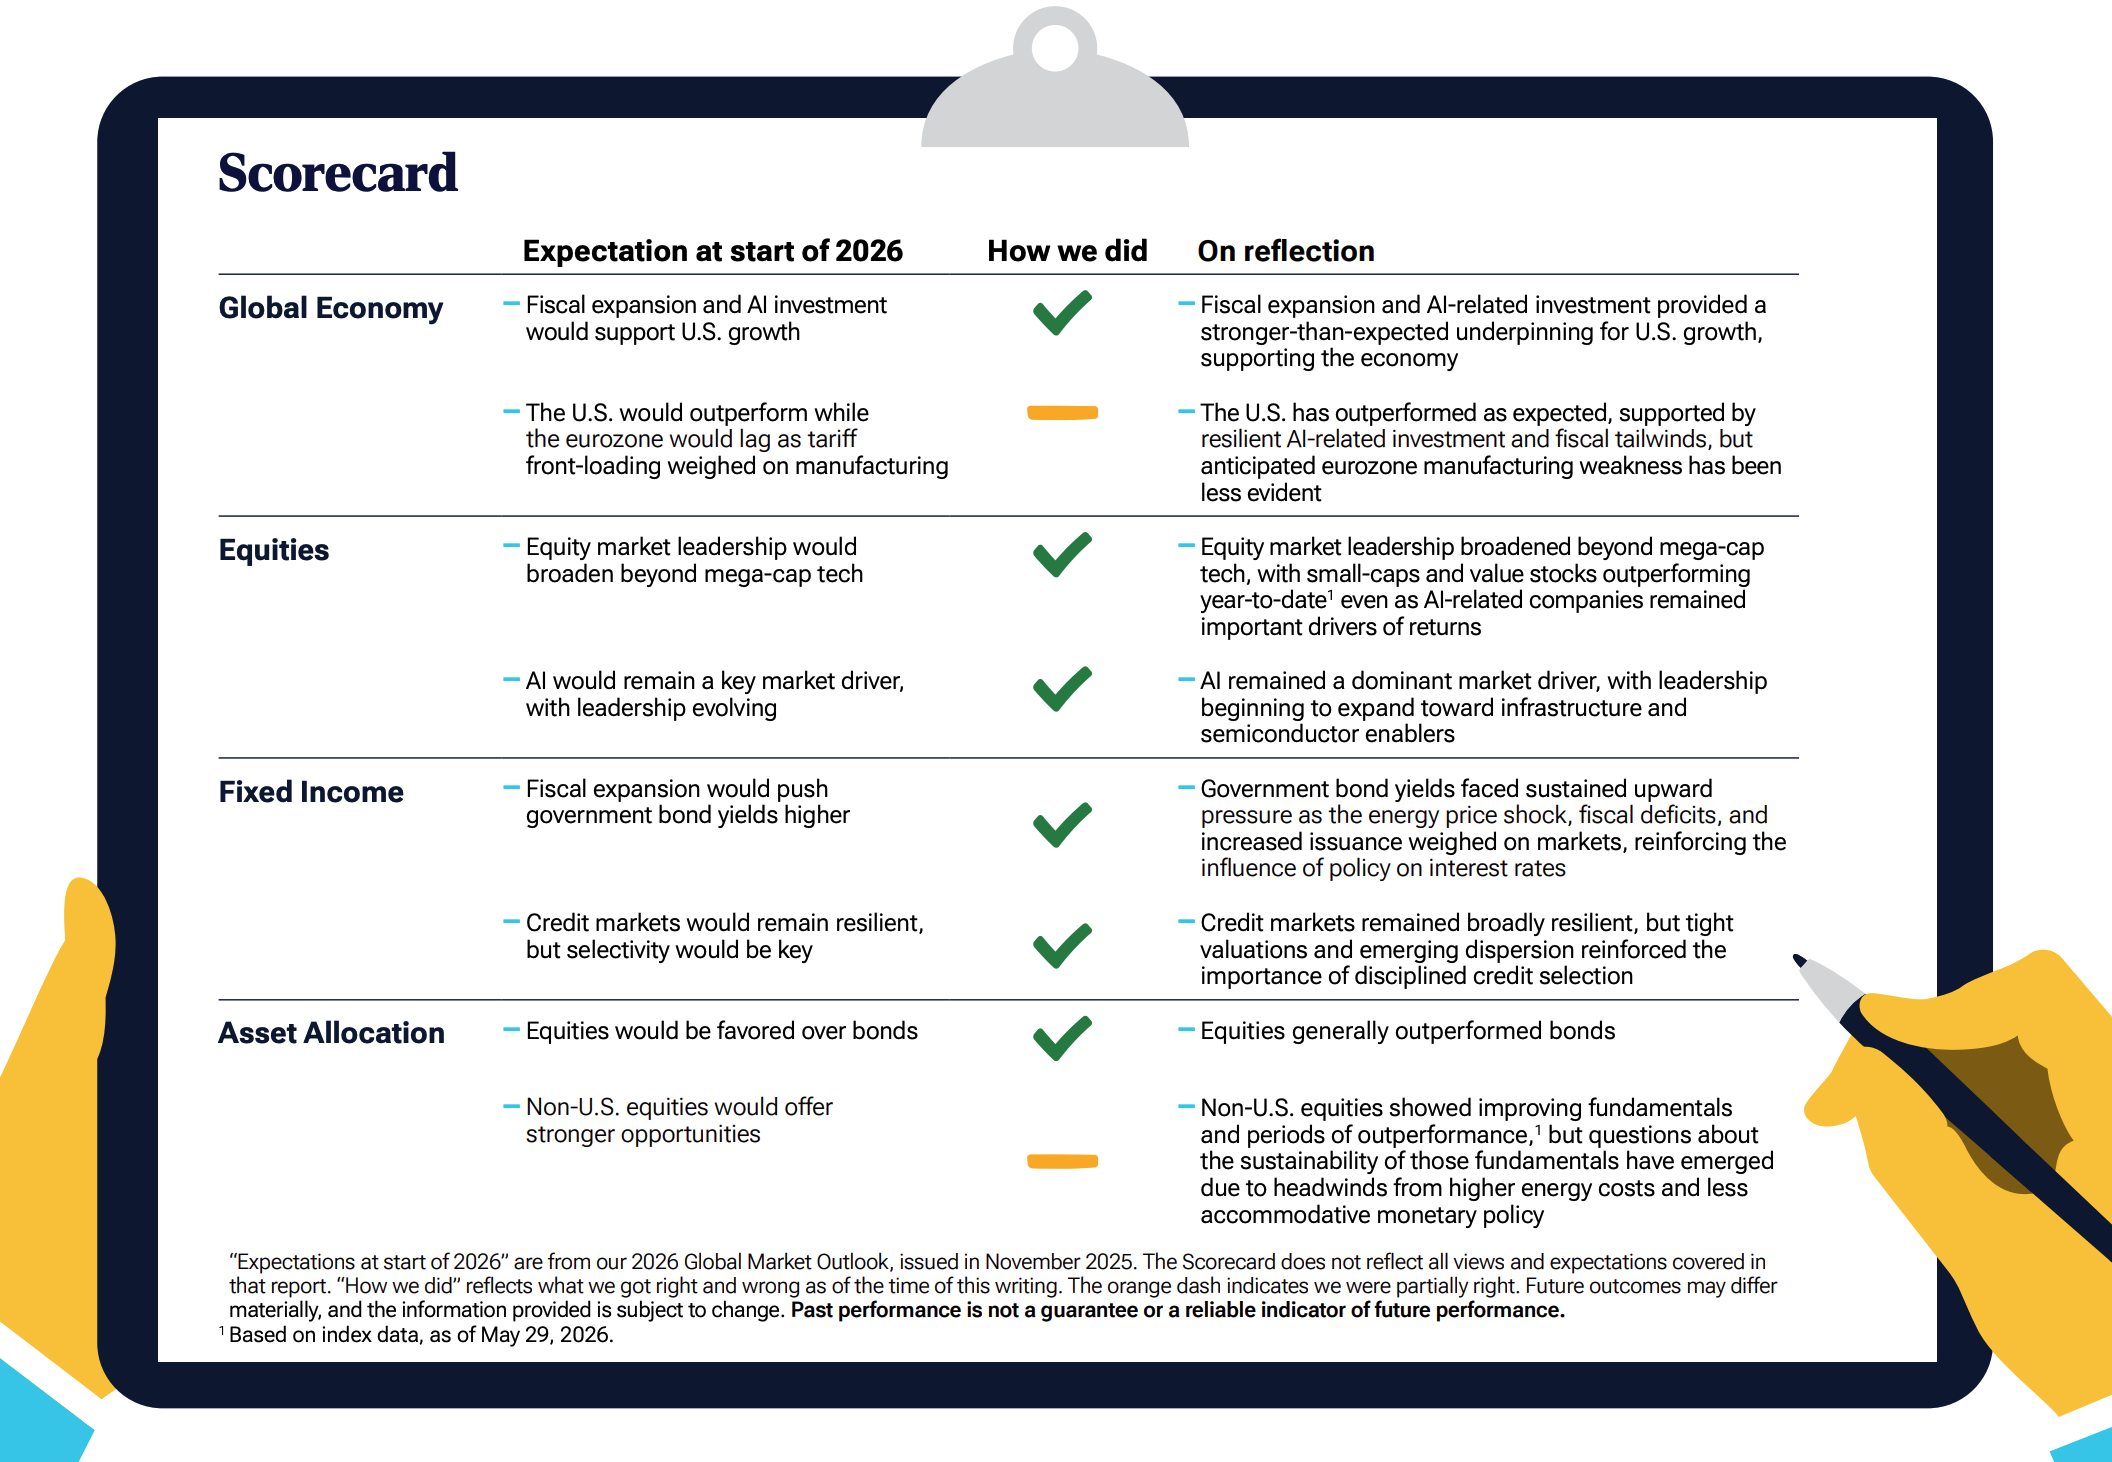
We were right that equity market leadership would broaden beyond mega-cap tech, but war-driven shocks have challenged our thesis on non-U.S. equities.

Nearly halfway through 2026, we looked back at the themes from our Global Market Outlook published last November. Many of the key trends we identified heading into this year, such as continued credit market resilience and broader equity market leadership, played out largely as anticipated.

Regional trends proved to be more mixed, however. While non-U.S. equities periodically outperformed, the bullish case for non-U.S. stock markets has weakened in the wake of the energy supply shock.

T. Rowe Price scorecard reviewing 2026 expectations for the global economy, equities, fixed income and asset allocation.


Geopolitical outlook
Rising global tensions are spurring reinvestment in domestic capacity and a broader shift toward economic fragmentation.

Policymakers worldwide are prioritizing energy security, domestic production, and supply chain leverage over efficiency and integration. This will likely widen regional divergences as globally exposed and trade-sensitive sectors face pressure. While markets have remained relatively strong this year, continued economic fragmentation is likely to drive a more differentiated and volatile environment.

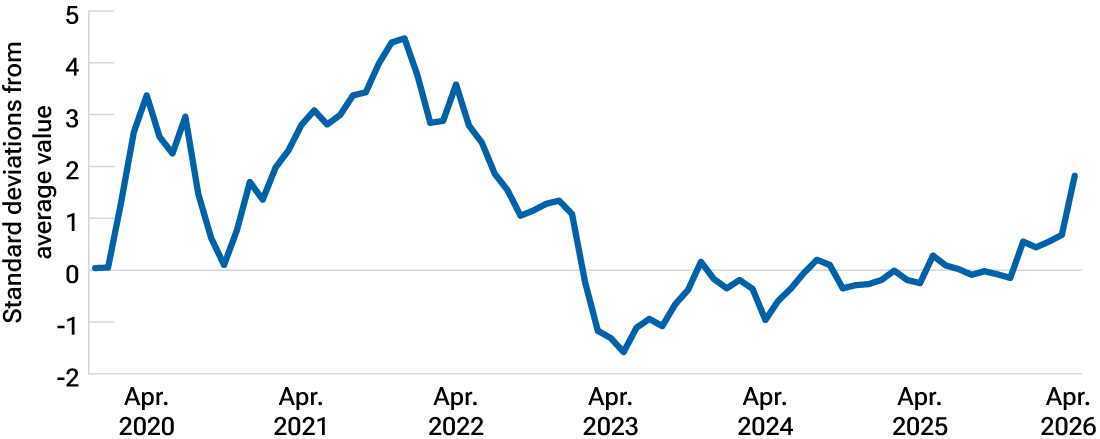
Global supply chain pressures have spiked this year
Energy shocks and AI demand are lengthening delivery times

Chart showing global supply chain pressures spiking in 2026 as energy shocks and AI demand lengthen delivery times.

As of April 30, 2026.
Source: Global Supply Chain Pressure Index (GSPI), Federal Reserve Bank of New York.
Notes: GSCPI readings for the most recent months can be revised as realized data become available, replacing the imputed values generated through principal component analysis. Further, for some series, mainly the BLS airfreight cost indices, each new release comes with revisions to up to twelve months of previous data. Thus, revisions can have an impact up to a year back in time.


Inflation outlook
The fight against inflation looks increasingly difficult as a manufacturing revival, fiscal expansion, and policy shifts introduce new risks.

Central banks are abandoning or reversing rate-cutting cycles amid the current energy shock, and the specter of stagflation further complicates monetary policy in some countries. At the same time, a global manufacturing recovery and rising industrial prices are adding to inflation pressures. Markets appear to be underestimating the longer-term inflation risks.

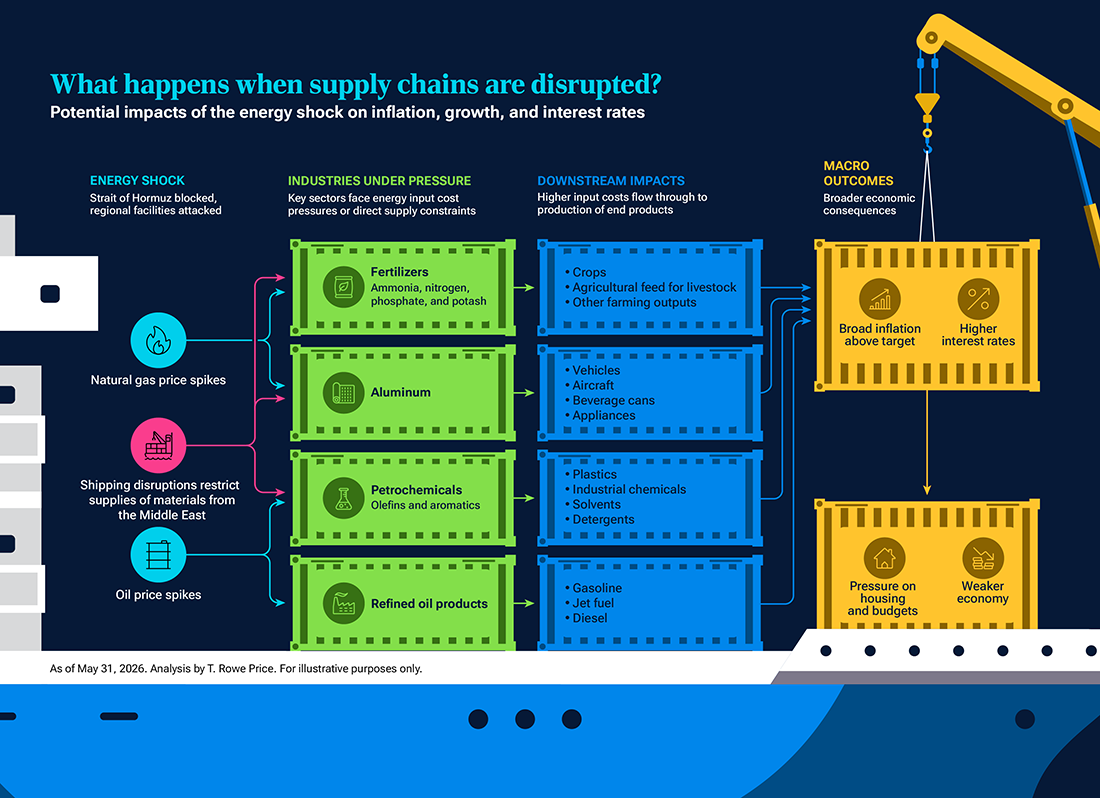
What happens when supply chains are disrupted?
Potential impacts of the energy shock on inflation, growth, and interest rates

T. Rowe Price diagram showing potential impacts of an energy shock on industries, downstream products, inflation, growth and interest rates.


Energy outlook
Energy scarcity is reshaping supply chains and opportunities in commodities-related sectors.

War-driven supply shocks have exposed fragile energy markets, resulting in structurally higher prices, regional shortages, and rising demand for different sources of energy. In this new environment, the themes of energy security and diversification—in addition to critical minerals production—lead to compelling investment opportunities.

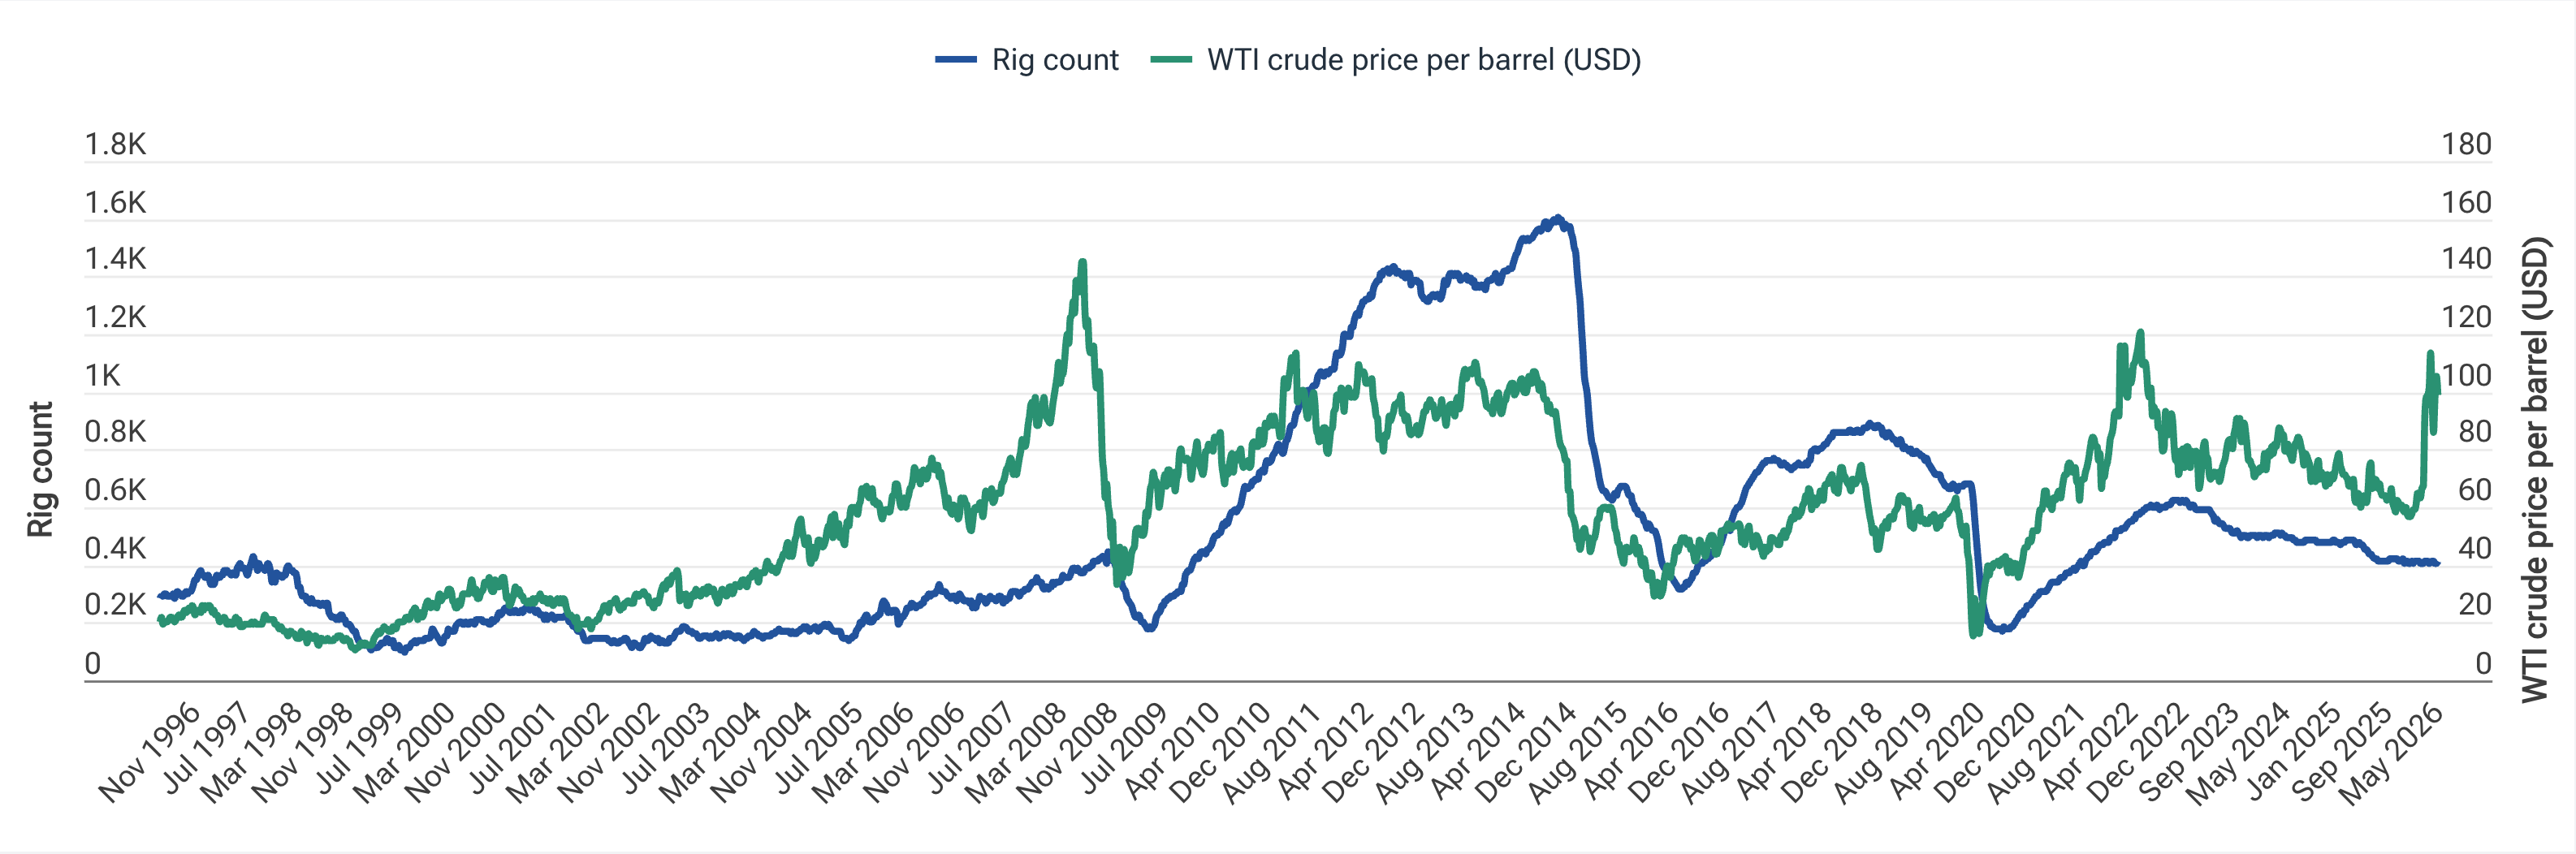
Oil markets were tightening before the Iran war
Rig count was falling despite elevated prices

Chart showing oil markets tightening before the Iran war, with rig count falling despite elevated prices.

As of April 30, 2026. Sources: Baker Hughes, West Texas Intermediate oil price.

AI outlook
AI is transitioning from a concentrated technology trade into a wider industrial and infrastructure investment cycle.

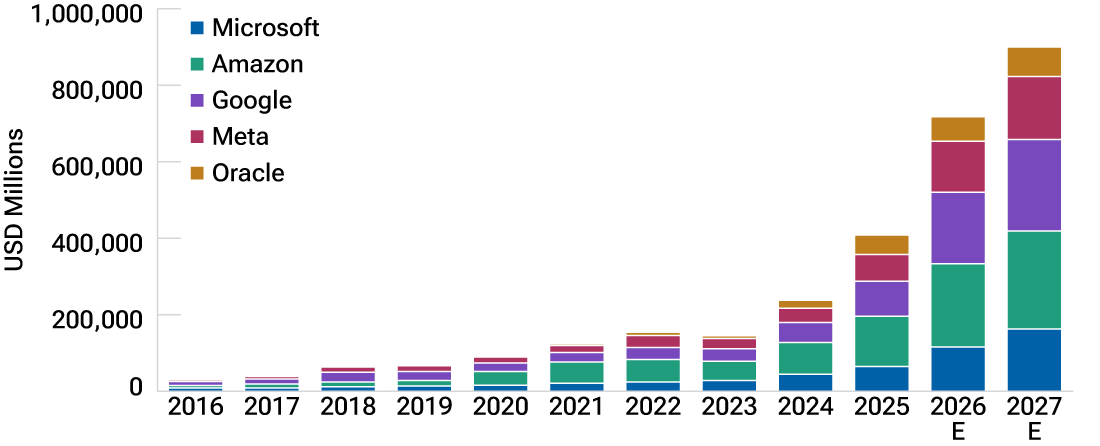
As hyperscaler spending on AI accelerates, investment opportunities are expanding beyond semiconductors into infrastructure and industrial beneficiaries poised to capitalize on rising power, connectivity, and operational demands. But selective approaches toward the AI trade—rather than simple participation—will likely prove beneficial.

AI capex continues to soar
Hyperscaler capex, trailing 4-quarter total

Chart showing hyperscaler AI capital expenditures continuing to rise across major technology companies.

As of May 15, 2026.
E=Estimates.
K=1000.
The specific securities identified and described are for informational purposes only and do not represent recommendations to buy or sell any security. For illustrative purposes only. Estimates are consensus estimates. Actual outcomes may differ materially from estimates. Estimates are subject to change. Hyperscalers are cloud-service providers that operate at an extremely large scale. This is a sample of U.S. hyperscalers and is not an all-inclusive list. Source: T. Rowe Price analysis using data from FactSet Research Systems Inc. All rights reserved.


Market leadership outlook
The conditions that supported market concentration are shifting, expanding the opportunity set beyond the past cycle’s winners.

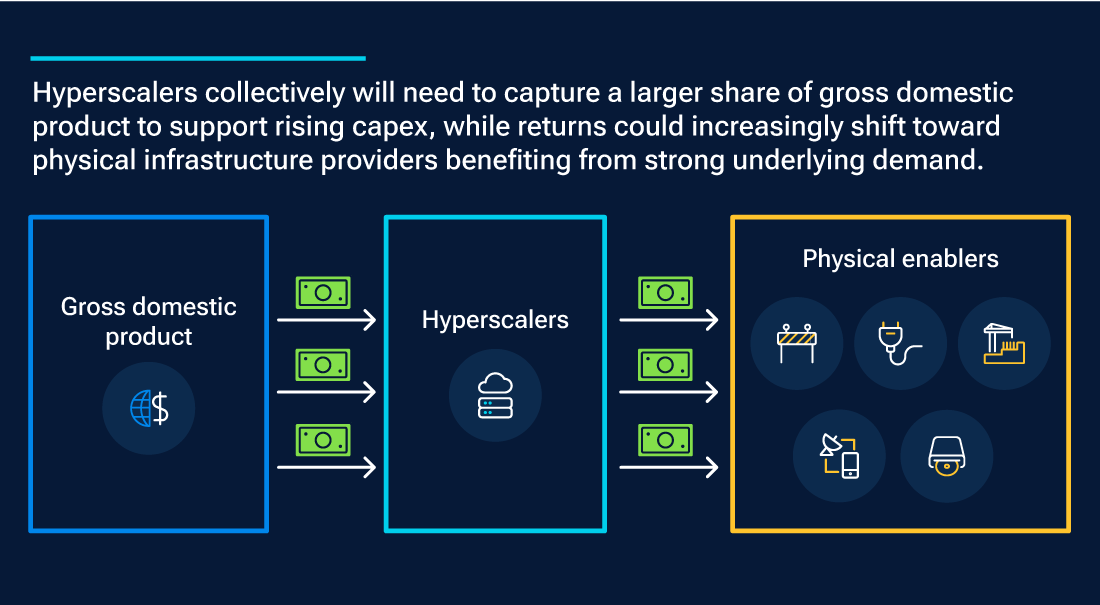
The era dominated by scale and asset-light business models is giving way to a new equilibrium. As AI infrastructure spending has rewired market dynamics, leadership has begun to broaden across sectors and geographies. Active investors who can distinguish between capital investment that enhances returns and spending that dilutes them should be well positioned to take advantage of this shift.

The great rotation
Returns may shift toward infrastructure providers

T. Rowe Price graphic showing the great rotation, with returns potentially shifting toward infrastructure providers.

Analysis by T. Rowe Price. For illustrative purposes only. Actual outcomes may differ materially.

READ MORE FROM T. ROWE PRICE


Investment Risks:

Active investing may have higher costs than passive investing and may underperform the broad market or passive peers with similar objectives. Each person’s investing situation and circumstances differ. Investors should take all considerations into account before investing.

International investments can be riskier than U.S. investments due to the adverse effects of currency exchange rates, differences in market structure and liquidity, as well as specific country, regional, and economic developments. The risks of international investing are heightened for investments in emerging market and frontier market countries. Emerging and frontier market countries tend to have economic structures that are less diverse and mature, and political systems that are less stable, than those of developed market countries.

Commodities are subject to increased risks such as higher price volatility, geopolitical, and other risks. Commodity prices can be subject to extreme volatility and significant price swings.

Inflation-linked bonds (Treasury inflation protected securities in the U.S.): In periods of no or low inflation, other types of bonds, such as US Treasury bonds, may perform better than Treasury inflation protected securities (TIPS).

Investing in technology stocks entails specific risks, including the potential for wide variations in performance and usually wide price swings, up and down. Technology companies can be affected by, among other things, intense competition, government regulation, earnings disappointments, dependency on patent protection, and rapid obsolescence of products and services due to technological innovations or changing consumer preferences.

Fixed income securities are subject to credit risk, liquidity risk, call risk, and interest rate risk. As interest rates rise, bond prices generally fall. Investments in high yield bonds involve greater risk of price volatility, illiquidity, and default than higher-rated debt securities. Investments in bank loans may at times become difficult.

Because of the cyclical nature of natural resource companies, their stock prices and rates of earnings growth may follow an irregular path.

The value approach to investing carries the risk that the market will not recognize a security’s intrinsic value for a long time or that a stock judged to be undervalued may actually be appropriately priced. Growth stocks are subject to the volatility inherent in common stock investing, and their share price may fluctuate more than that of income-oriented stocks.

All investments involve risk, including possible loss of principal. Diversification cannot assure a profit or protect against loss in a declining market. Index performance is for illustrative purposes only and is not indicative of any specific investment. Investors cannot invest directly in an index.

T. Rowe Price cautions that economic estimates and forward-looking statements are subject to numerous assumptions, risks, and uncertainties, which change over time. Actual outcomes could differ materially from those anticipated in estimates and forward-looking statements, and future results could differ materially from any historical performance. The information presented herein is shown for illustrative, informational purposes only. Any historical data used as a basis for this analysis are based on information gathered by T. Rowe Price and from third-party sources and have not been independently verified. Forward-looking statements speak only as of the date they are made, and T. Rowe Price assumes no duty to and does not undertake to update forward-looking statements.

Important Information

This material is being furnished for informational and/or marketing purposes only and does not constitute an offer, recommendation, advice, or solicitation to sell or buy any security.

Prospective investors should seek independent legal, financial and tax advice before making any investment decision. T. Rowe Price group of companies including T. Rowe Price Associates, Inc. and/or its affiliates receive revenue from T. Rowe Price investment products and services.

Past performance is not a guarantee or a reliable indicator of future results. All investments involve risk, including possible loss of principal.

Information presented has been obtained from sources believed to be reliable, however, we cannot guarantee the accuracy or completeness. The views contained herein are those of the author(s), are as of June 2026, are subject to change, and may differ from the views of other T. Rowe Price Group companies and/or associates. Under no circumstances should the material, in whole or in part, be copied or redistributed without consent from T. Rowe Price.

All charts and tables are shown for illustrative purposes only. Actual future outcomes may differ materially from any estimates or forward-looking statements provided.

The material is not intended for use by persons in jurisdictions which prohibit or restrict the distribution of the material and in certain countries the material is provided upon specific request.

USA—Issued in the USA by T. Rowe Price Investment Services, Inc., distributor and T. Rowe Price Associates, Inc., investment adviser, 1307 Point Street, Baltimore, MD 21231, which are regulated by the Financial Industry Regulatory Authority and the U.S. Securities and Exchange Commission, respectively.

© 2026 T. Rowe Price. All Rights Reserved. T. ROWE PRICE, INVEST WITH CONFIDENCE, the Bighorn Sheep design, and related indicators (troweprice.com/ip) are trademarks of T. Rowe Price Group, Inc. All other trademarks are the property of their respective owners. Use does not imply endorsement, sponsorship, or affiliation of T. Rowe Price with any of the trademark owners.

202605-5512997

Share this post

Sign Up Now for Full Access to Articles and Podcasts!

Unlock full access to our vast content library by registering as an institutional investor

Register

Contacts


T. Rowe Price

T. Rowe Price is a global asset management firm founded in 1937, with USD $1.8 trillion1 in assets under management and offices in 17 markets across four continents. Our investment philosophy is built on proprietary credit and equity research, disciplined risk management, and a collaborative, client-focused culture. We are dedicated to delivering investment excellence and tailored solutions for individuals, advisors, institutions, and retirement plan sponsors.

Since 1985, T. Rowe Price has managed insurance assets and currently oversees USD $35 billion1 in Insurance General Accounts for U.S. and international clients through T. Rowe Price and its subsidiaries.

Our deep fundamental expertise, combined with engaged and integrated relationship and investment management teams, enables us to provide insurance clients with thoughtful partnerships focused on compelling risk-adjusted outcomes. This highly interactive approach to client engagement is a key differentiator that reinforces T. Rowe Price’s service-oriented culture.

Ben Riley 
Head of Insurance 
benjamin.riley@troweprice.com
410-345-2223

Chase Uhlein, CFA
Senior Relationship Manager
chase.uhlein@troweprice.com
410-577-3077

Blayze Hanson, CFA
Senior Relationship Manager
blayze.hanson@troweprice.com

Taylor Davis 
Relationship Manager 
taylor.davis@troweprice.com
410-577-2054

1307 Point Street
Baltimore, MD 21231

 

View the contributor page

Image
trp_logo

Sign Up Now for Full Access to Articles and Podcasts!

Unlock full access to our vast content library by registering as an institutional investor .

Create an account

Already have an account ? Sign in

Ѐ Ё Ђ Ѓ Є Ѕ І Ї Ј Љ Њ Ћ Ќ Ѝ Ў Џ А Б В Г Д Е Ж З И Й К Л М Н О П Р С ΄ ΅ Ά · Έ Ή Ί Ό Ύ Ώ ΐ Α Β Γ Δ Ε Ζ Η Θ Ι Κ Λ Μ Ν Ξ Ο Π Ρ Ё Ђ Ѓ Є Ѕ І Ї Ј Љ Њ Ћ Ќ Ў Џ А Б В Г Д Е Ж З И Й К Л М Н О П Р С Т У Ф Х Ц Ч Ш Ā ā Ă ă Ą ą Ć ć Ĉ ĉ Ċ ċ Č č Ď ď Đ đ Ē ē Ĕ ĕ Ė fi fl œ æ ß