


Insight Investment -

Don't Sleep on Falling Angels

Darkened view of modern glass buildings representing systematic fixed income, fallen angel bonds and credit market opportunities.

Fallen angels have consistently outperformed comparable credit markets over most time periods. With the potential for rising downgrades, it could be time to consider a systematic approach to the asset class.

Fallen angels have performed consistently well against other credit markets

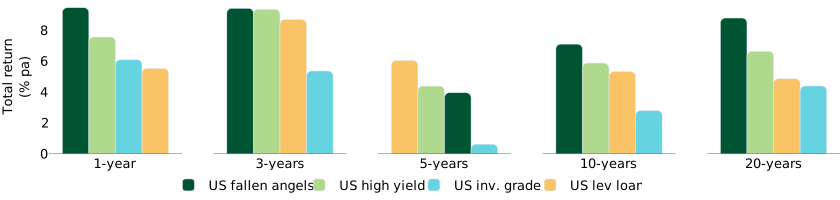
Fallen angels (bonds downgraded from investment grade to high yield) have quietly outperformed other comparable fixed income markets over most near and longer-term time periods (Figure 1). Their only notable weak spot versus US high yield was over five years, a result of 2022’s rising rate environment.

Figure 1: Fallen angel returns have been strong over most time periods1

Chart showing fallen angel returns versus comparable credit markets over different time periods.

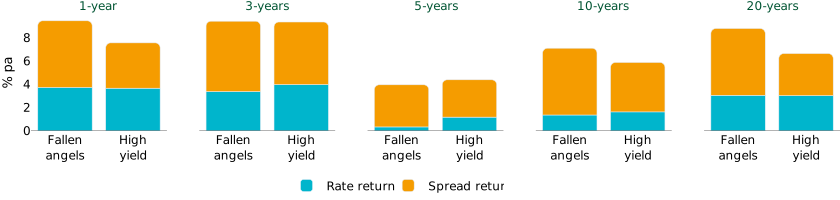
The main driver of this performance has been credit spread (or “excess”) returns (Figure 2). This may be surprising, as fallen angels are generally higher quality than high yield (~75% of fallen angel market is BB rated vs ~55% for high yield), and therefore generally have narrower credit spreads than other high yield bonds1.

This performance is partially explained by fallen angels having a higher “credit spread duration” than high yield bonds (which means their bond prices have a higher sensitivity to changes in credit spreads). As former investment grade companies, their bonds tend to have longer maturities than other high yield bonds, so in essence, they have historically enjoyed an amplified impact from credit spread tightening relative to high yield.

Figure 2: Credit spreads, not interest rates, have driven strong fallen angel performance versus high yield1

Chart showing credit spread returns as a driver of fallen angel performance versus high yield.

Can a wave of downgrades improve near-term fallen angel returns further?

Historically, waves of fallen angel downgrades have been an additional driver of fallen angel returns.

When bonds transition from investment grade to high yield indices, many passive (and some active) investment grade accounts become simultaneous “forced sellers”. This may lead to overselling, creating potentially compelling entry points for other investors.

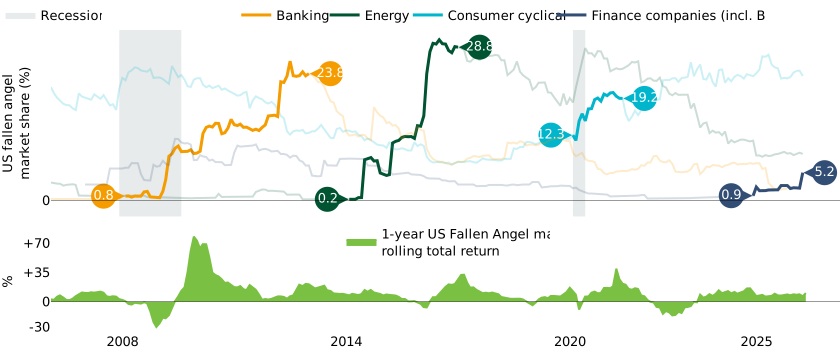
We recently noted that sector downgrade waves historically coincided with higher fallen angel returns, and flagged business development companies as a sector to watch for downgrade candidates (Figure 3).

Figure 3: Waves of sector downgrades have historically been good news for fallen angel investors2

Chart showing how waves of sector downgrades have historically affected fallen angel investors.

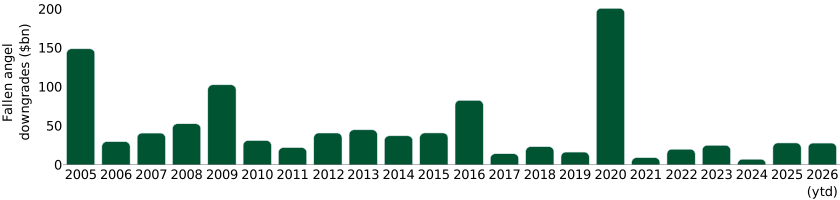
We see signs that downgrades may also pick up across other sectors. Fallen angel downgrades have been low since the pandemic, but $30bn has entered fallen angel indices year-to-date, already making it the highest level since 2020 (Figure 4).

Figure 4: Fallen angel downgrades have been muted, but is an uptick coming?3

Chart showing recent fallen angel downgrade activity and year-to-date additions to fallen angel indices.

Economic conditions may also indicate potential catalysts for downgrades

Consumers, particularly lower-income cohorts, are increasingly dipping into savings to support consumption, leaving the personal savings rate at its lowest level since 20224. We believe this may impact certain credits.

Trends are also moving toward higher M&A activity. Goldman Sachs forecast M&A volumes of $3.8trn in 20265, driven by factors like deregulation and AI-related disruption and consolidation.

We are watching fundamentals, rating agency outlooks and pricing within BBB names in particular. We expect to see downgrades return to more historically normal levels of $40bn to $50bn per year.

Getting ahead of future downgrade waves may be an optimal strategy

In our view, total returns over recent years offer potential evidence that the fallen angel market may offer value even absent a wave of downgrades. We believe the optimal time to invest may be now, before the next wave of downgrades arrives, even if the timing of downgrades is uncertain.

READ MORE FROM INSIGHT INVESTMENT


1 Bloomberg, Insight, May 31, 2026. US fallen angels: Bloomberg US Fallen Angel 3% Capped Index, US high yield: Bloomberg Corporate US High Yield Index, US investment grade: Bloomberg US Corporate Index, US leveraged loans: Morningstar LSTA US Levered Loan 100 Index. Past performance is not indicative of future results. Investment in any strategy involves a risk of loss which may partly be due to exchange rate fluctuations.

2 Bloomberg (Bloomberg US High Yield Fallen Angel Index), Insight, April 2026. Bloomberg US High Yield Fallen Angel Index. Past performance is not indicative of future results. Investment in any strategy involves a risk of loss which may partly be due to exchange rate fluctuations.

3 Bloomberg (Bloomberg US High Yield Fallen Angel Index), Insight. Year-to-date as at May 31, 2026.

4 Bureau of Economic Analysis, May 2026.

5 M&A Volume Expected to Surge This Year Despite Economic Uncertainty, April 2026, Goldman Sachs.

Past performance is not indicative of future results. Investment in any strategy involves a risk of loss which may partly be due to exchange rate fluctuations. The performance results shown are net and gross of investment management fees and reflect the reinvestment of dividends and/or income and other earnings. Gross of fees performance results do not reflect the deduction of investment advisory fees; as such, client’s returns will be reduced by the investment advisory fees and other expenses. The quoted benchmark does not reflect deductions for fees, expenses or taxes. The benchmark is unmanaged and does not reflect actual trading. There could be material factors relevant to any such comparison such as differences in the volatility, and regulatory and legal restrictions between the index shown and the strategy. Investors cannot invest directly in any index.

RISK DISCLOSURES

This document has been prepared by Insight North America LLC (INA), a registered investment adviser under the Investment Advisers Act of 1940 and regulated by the US Securities and Exchange Commission. INA is part of ‘Insight’ or ‘Insight Investment’, the corporate brand for certain asset management companies operated by Insight Investment Management Limited including, among others, Insight Investment Management (Global) Limited, Insight Investment International Limited and Insight Investment Management (Europe) Limited (IIMEL).

Opinions expressed herein are current opinions of Insight, and are subject to change without notice. Insight assumes no responsibility to update such information or to notify a client of any changes. Any outlooks, forecasts or portfolio weightings presented herein are as of the date appearing on this material only and are also subject to change without notice. Insight disclaims any responsibility to update such views. No forecasts can be guaranteed.

Nothing in this document is intended to constitute an offer or solicitation to sell or a solicitation of an offer to buy any product or service (nor shall any product or service be offered or sold to any person) in any jurisdiction in which either (a) INA is not licensed to conduct business, and/or (b) an offer, solicitation, purchase or sale would be unavailable or unlawful.

This document should not be duplicated, amended, or forwarded to a third party without consent from INA. This is a marketing document intended for institutional investors only and should not be made available to or relied upon by retail investors. This material is provided for general information only and should not be construed as investment advice or a recommendation. You should consult with your adviser to determine whether any particular investment strategy is appropriate.

Assets under management (AUM) represented by the value of the client’s assets and liabilities Insight is asked to manage. These will primarily be the mark-to-market value of securities managed on behalf of clients, including collateral if applicable. Where a client mandate requires Insight to manage some or all of a client’s liabilities (e.g. LDI strategies), AUM will be equal to the value of the client specific liability benchmark and/or the notional value of other risk exposure through the use of derivatives. Regulatory assets under management without exposures can be provided upon request. Unless otherwise specified, the performance shown herein is that of Insight Investment (for Global Investment Performance Standards (GIPS®), the ‘firm’) and not specifically of Insight North America. A copy of the GIPS composite disclosure page is available upon request.

Past performance is not a guide to future performance, which will vary. The value of investments and any income from them will fluctuate and is not guaranteed (this may partly be due to exchange rate changes). Future returns are not guaranteed and a loss of principal may occur.

Share this post

Sign Up Now for Full Access to Articles and Podcasts!

Unlock full access to our vast content library by registering as an institutional investor

Register

Contacts


Insight Investment

Insight is a global asset manager specializing in fixed income and risk management strategies with $839.3bn in AUM1. We have been working with insurers since 1934 and manage $32bn for over 80 insurers globally. Our investment philosophy offers clients innovative yet practical investment solutions. We manage custom fixed income strategies to help meet clients evolving needs, such as liquidity, principal preservation, earnings stability, tax minimization and total return.

Insight is subsidiary of BNY, which offers insurance clients additional services and access to boutique investment management teams. These services offer the potential for deeper collaboration across your portfolio.
 

As of June 30, 2026. Assets under management (AUM) are represented by the value of the client’s assets and liabilities Insight is asked to manage. These will primarily be the mark-to-market value of securities managed on behalf of clients, including collateral if applicable. Where a client mandate requires Insight to manage some or all of a client’s liabilities (e.g. LDI strategies), AUM will be equal to the value of the client specific liability benchmark and/or the notional value of other risk exposure through the use of derivatives. Where the methodology defines it, some asset reporting focuses on cash securities only. Insight North America (INA) is part of ‘Insight’ or ‘Insight Investment’, the corporate brand for certain asset management companies operated by Insight Investment Management Limited including, among others, Insight Investment Management (Global) Limited (IIMG), Insight Investment International Limited (IIIL) and Insight Investment Management (Europe) Limited (IIMEL). Advisory services referenced herein are available in the US only through INA. Legal entity Insight North America LLC’s AUM is $164.5bn as of March 31, 2026. Figures shown in USD. FX rates as per WM Reuters 4pm spot rates. 

1 Includes $32.1bn following the completed transition of BNY Wealth’s municipal bond and taxable fixed income team to Insight on October 1, 2025, assets stated as of December 31, 2025 and includes $3.8bn  attributable to certain accounts managed by Insight’s affiliate, BNY Mellon, National Association, for which certain Insight investment personnel act as dual officers. Such accounts pursue the same or similar investment strategies to those pursued by Insight clients. 2 Includes employees of Insight North America LLC and its affiliates, which provide asset management services as part of Insight, the corporate brand for certain companies operated by Insight Investment Management Limited (IIML).
 

Insight Investment
200 Park Avenue, New York
NY 10166 
www.insightinvestment.com
 

Jeffrey Berman, CFA
Head of North America Distribution 
Jeffrey.Berman@insightinvestment.com
+1 212 365 3341

Ryan McMurdie
Director, Insurance Solutions
Ryan.McMurdie@InsightInvestment.com 
+1 917 208 0115


View the contributor page

Sign Up Now for Full Access to Articles and Podcasts!

Unlock full access to our vast content library by registering as an institutional investor .

Create an account

Already have an account ? Sign in

Ѐ Ё Ђ Ѓ Є Ѕ І Ї Ј Љ Њ Ћ Ќ Ѝ Ў Џ А Б В Г Д Е Ж З И Й К Л М Н О П Р С ΄ ΅ Ά · Έ Ή Ί Ό Ύ Ώ ΐ Α Β Γ Δ Ε Ζ Η Θ Ι Κ Λ Μ Ν Ξ Ο Π Ρ Ё Ђ Ѓ Є Ѕ І Ї Ј Љ Њ Ћ Ќ Ў Џ А Б В Г Д Е Ж З И Й К Л М Н О П Р С Т У Ф Х Ц Ч Ш Ā ā Ă ă Ą ą Ć ć Ĉ ĉ Ċ ċ Č č Ď ď Đ đ Ē ē Ĕ ĕ Ė fi fl œ æ ß