

Ares Management Corporation -

Navigating Uncertainty: Does Volatility Create Better Vintages?

Reflections of surrounding buildings across a grid of glass windows.

Private-market investors often pull back when uncertainty rises. Research suggests that uncertain times may be precisely when the best vintages are formed.

Key Takeaways
  • Volatility is not just a risk signal. For private-market investors, volatility has historically been associated with stronger future vintage performance.
  • The effect is not confined to one market. Research demonstrates that the pro-volatility approach outperformed across private capital overall, across major asset classes, and across North America, Europe, and Asia Pacific.
  • Private Credit stands out. Our prior research found that weak fundraising environments offered only a modest timing benefit for private credit (in contrast to stronger benefits for other asset classes). Volatility appears to be a stronger signal for private credit.
 
Introduction

Most investors are trained to treat volatility as a warning sign. In private markets, that instinct may come at a cost.

In 2026, concerns about inflated valuations, macroeconomic risk, geopolitical conflict, and the possibility of an AI-driven market bubble have pushed uncertainty back to the center of asset-allocation decisions. The practical question is not whether investors feel more cautious. It is whether that caution should lead them to commit less capital.

Our analysis suggests the opposite. Across private-market vintages from 2000 through 2020, a strategy that increased commitments after periods of elevated volatility produced higher Net IRRs, higher TVPIs, and stronger Alpha relative to a fixed annual commitment strategy. The relationship held across major asset classes and across North America, Europe, and Asia Pacific1.

The implication is straightforward: we believe volatility should not automatically be treated as a reason to pause. For long-term private-market investors, it may be a signal to lean in.

 
Rationale and Literature Review

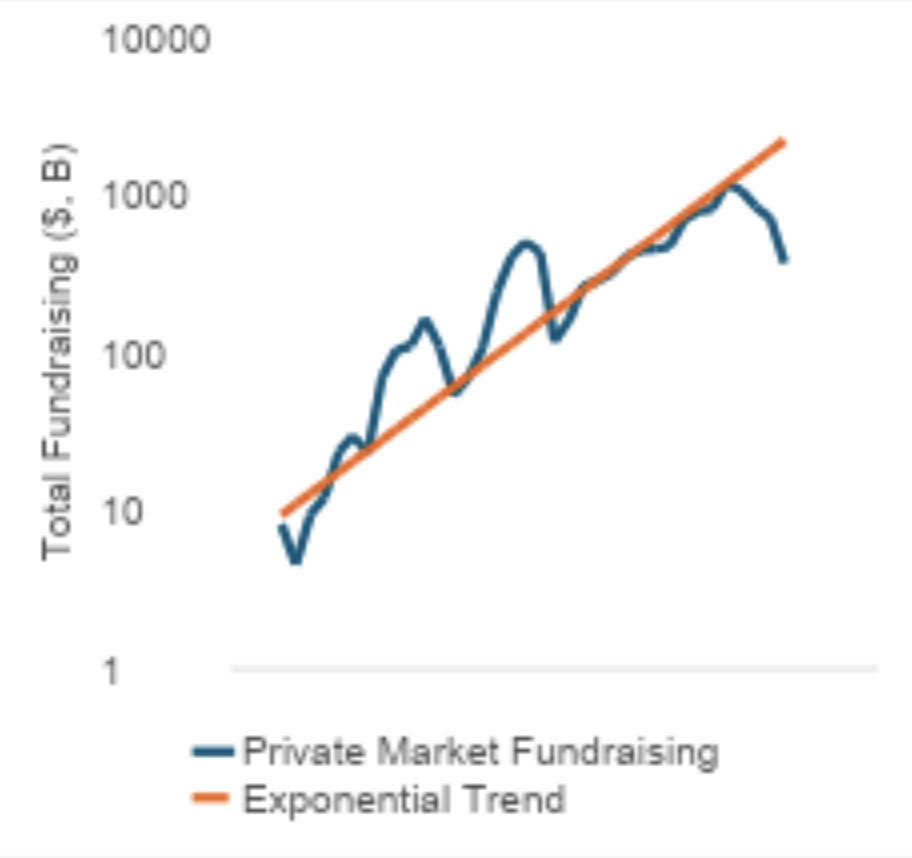
Private market performance is heavily shaped by entry conditions. Kaplan and Schoar’s 2005 study found that funds raised during periods of heavy fundraising tend to underperform funds raised in less crowded periods. These fundraising cycles are also procyclical, rising during stronger economic environments and falling when uncertainty increases.

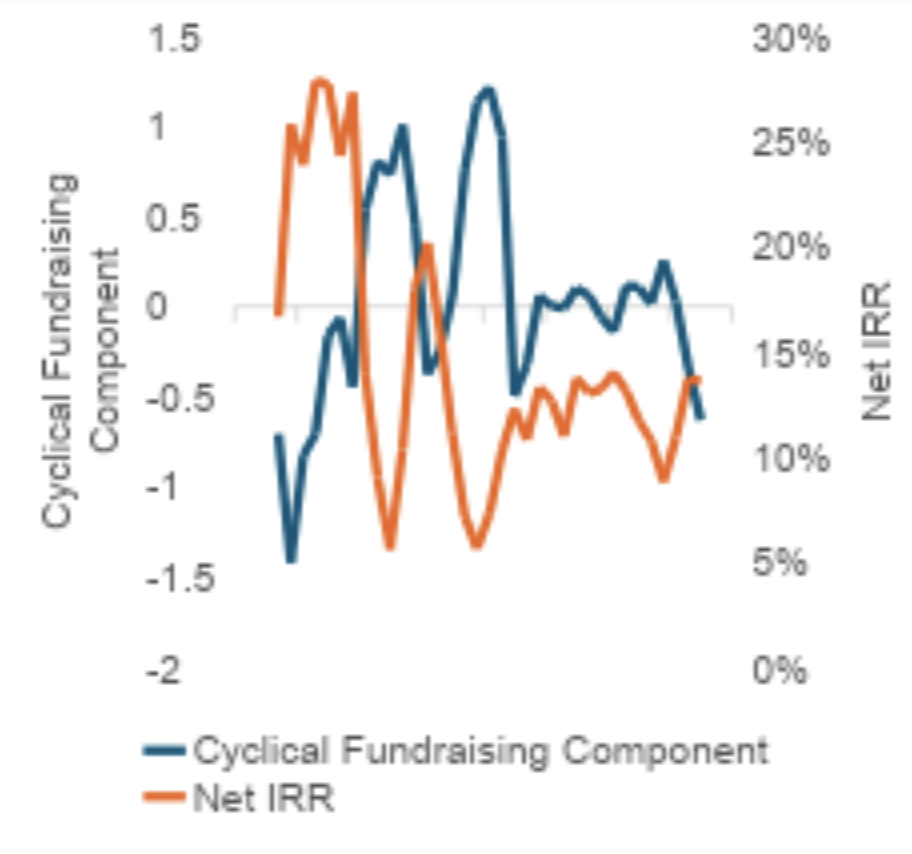
Our 2023 paper on commitment timing reached a similar conclusion: entry signals matter. In particular, deviations from long-term fundraising trends have historically been associated with future private-market returns, as shown in Figure 1.

Figure 1: Relationship Between Historical Fundraising and Future Fund IRR


IMAGE ALT TEXT

Chart comparing cyclical fundraising trends with private market net IRR

Sources: QRG Analysis and Burgiss (see disclosures for more information)

Notes

  1. IRRs are a pooled metric of the most current IRRs for funds at each vintage year

Kaplan and Schoar also observe that strong public-market performance and low volatility often precede higher fundraising. This paper tests the other side of that relationship: whether elevated volatility at entry can serve as a forward-looking signal for stronger private-market fund performance.

 
Defining the Commitment Strategy

To test this question, we use the VIX index2, the equity market’s expectation of near-term volatility, as a proxy for total volatility. For each vintage year, we take the prior year-end VIX level and rank it against the previous 10 years of monthly observations, or 120 data points. This ranking produces a rolling 10-year volatility percentile.

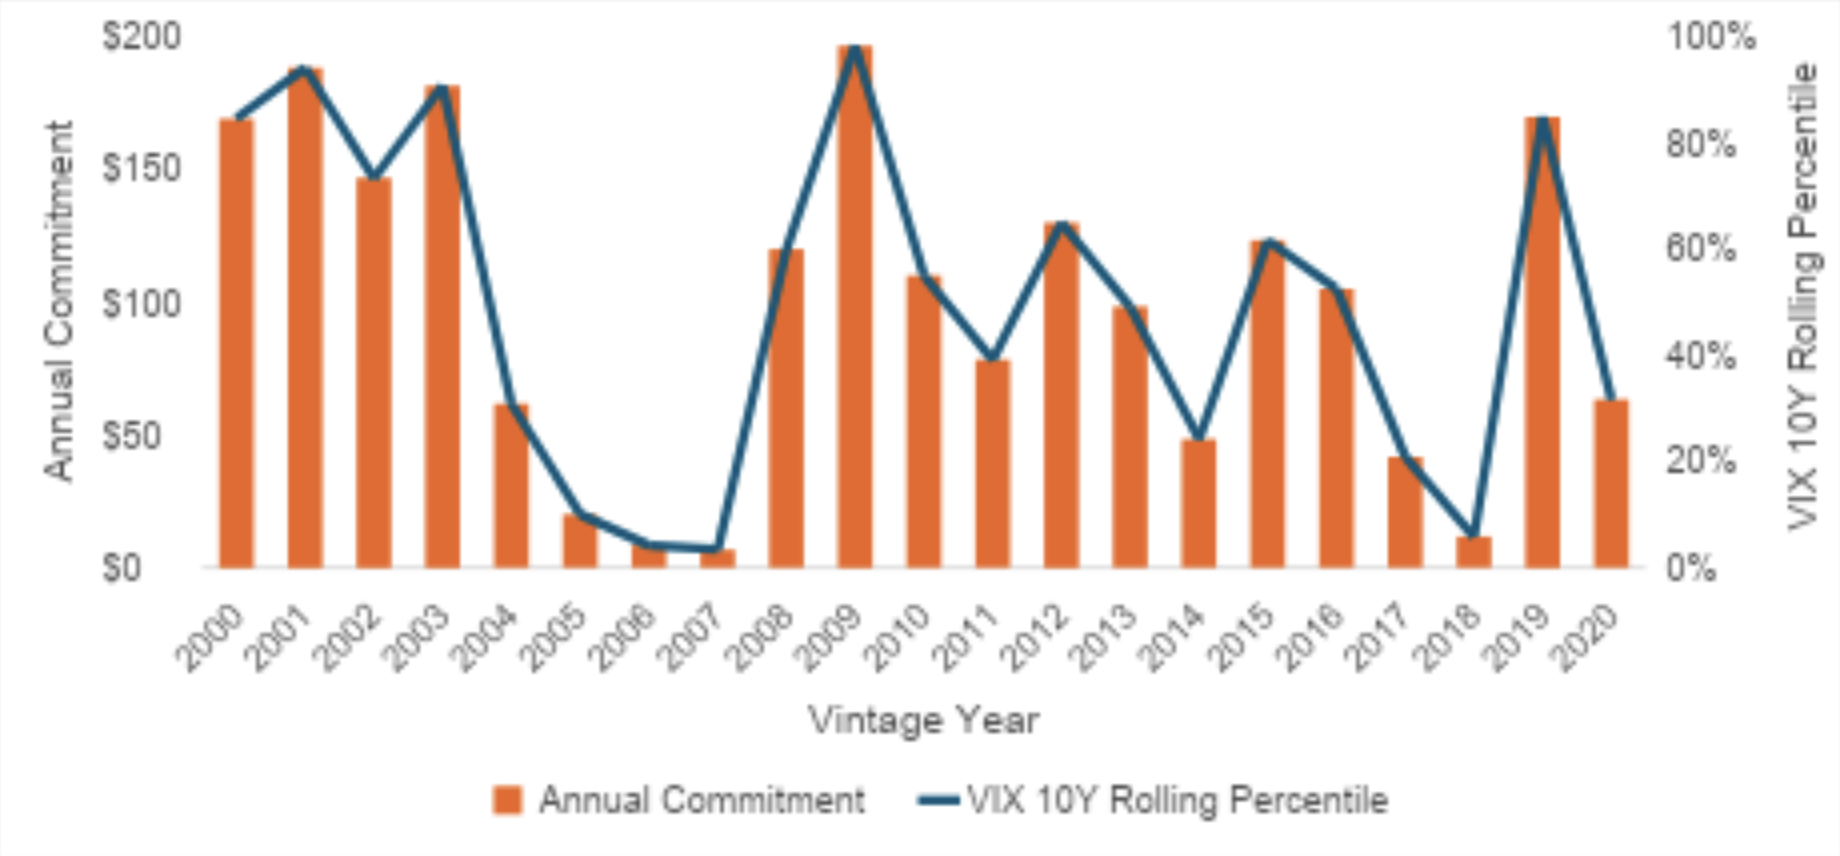
We then use the percentile to scale annual commitments. A fixed strategy commits $100 every year. A pro-volatility strategy commits more when the prior year-end VIX percentile is high and less when it is low, with annual commitments ranging up to $200. As shown in Figure 2, the pro-volatility strategy commits more capital after periods of elevated volatility, including the dot-com bust and the global financial crisis. An anti-volatility strategy does the reverse, reducing commitments when volatility is high and increasing them when volatility is low.

Figure 2: Capital Deployment Example for the Pro-Volatility Strategy

Chart showing annual commitments under the pro-volatility strategy alongside the rolling VIX percentile

Sources: QRG Analysis and FRED

Notes

  1. VIX 10Y Rolling Percentile corresponds to the previous year end value

This approach uses only information that would have been available to investors at the time of commitment. The test period runs from 2000 through 2020, excluding more recent3 vintages whose funds may still be too young to evaluate consistently. We compare the three approaches using Net IRR, TVPI, and Alpha.

 
Does Higher Volatility Produce Better Vintages?

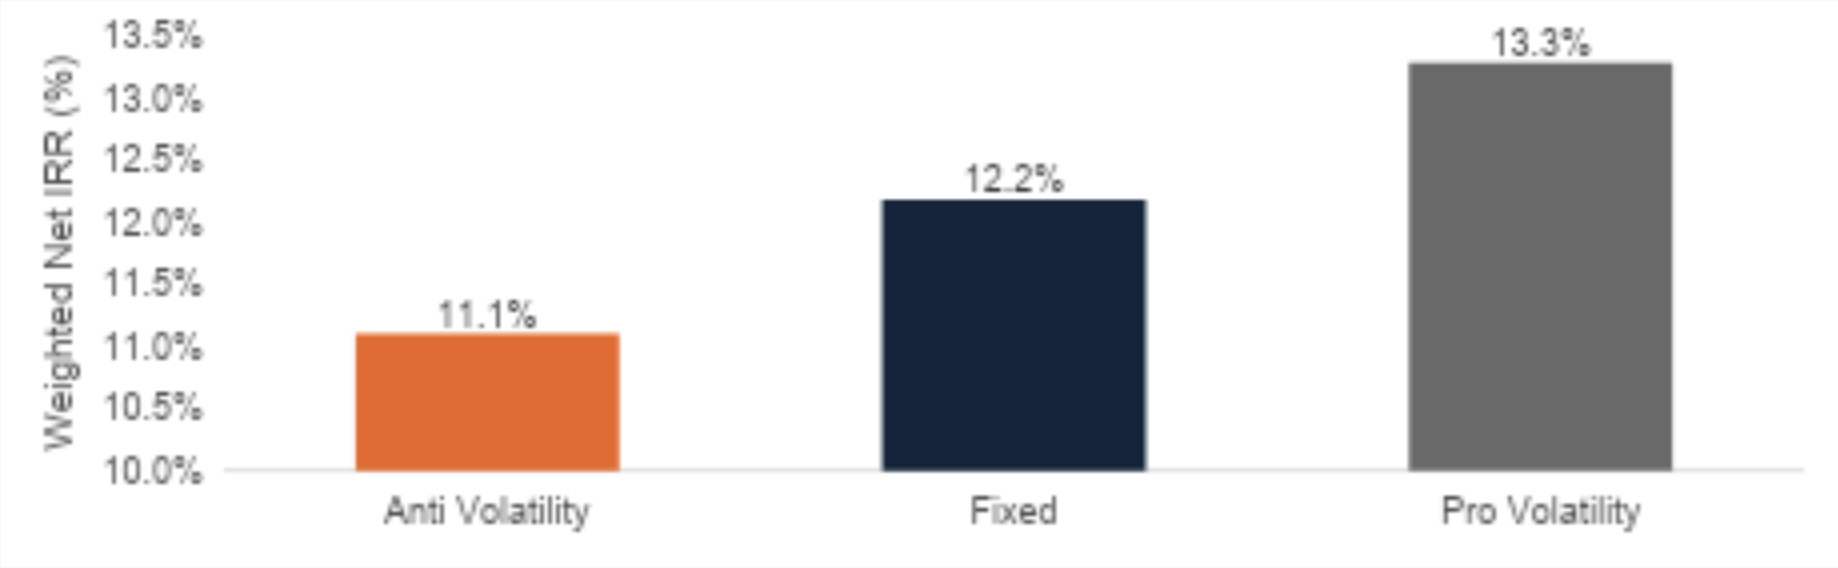
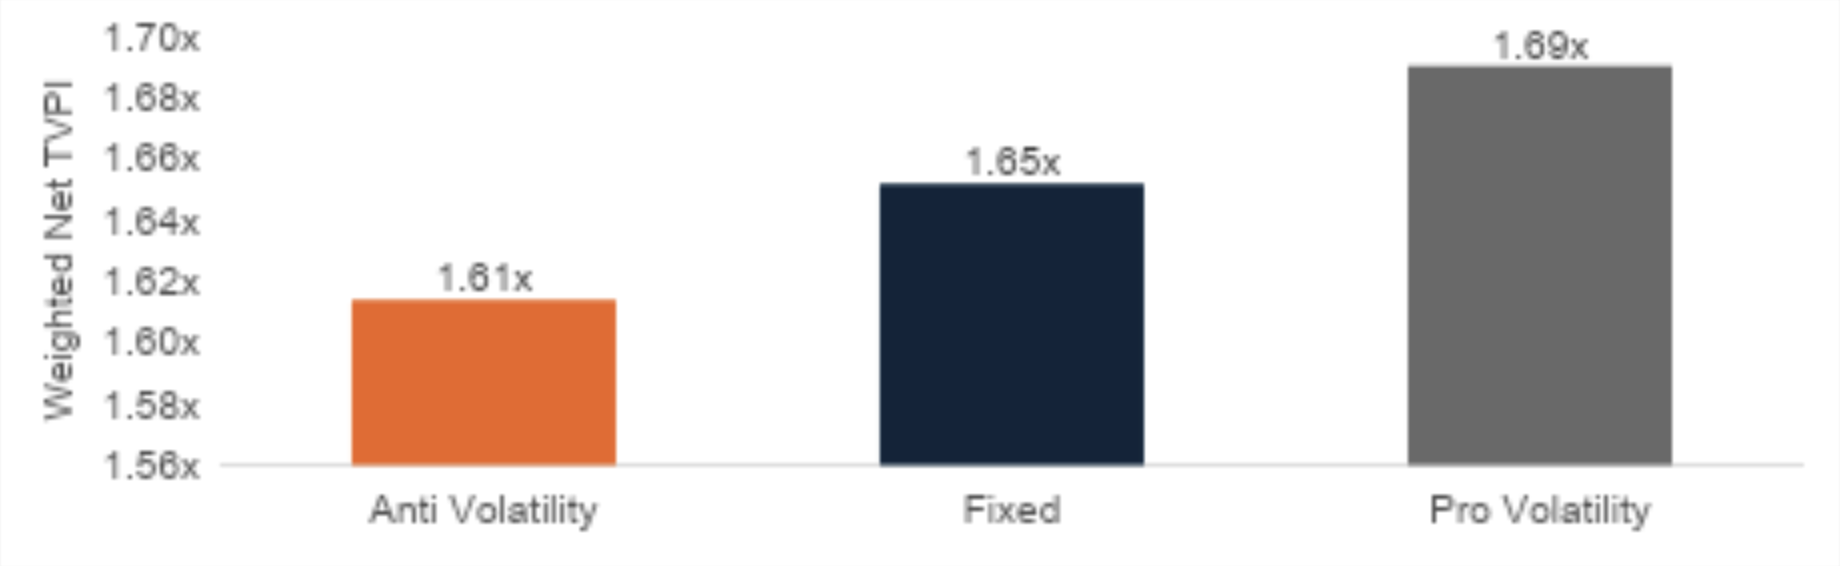
The research shows clear results across private capital. As shown in Figure 3, the pro-volatility strategy generates a capital-weighted Net IRR of 13.3%, compared with 12.2% for the fixed strategy and 11.1% for the anti-volatility strategy. TVPI follows the same pattern: 1.69x for the pro-volatility approach, 1.65x for the fixed approach, and 1.61x for the anti-volatility approach.

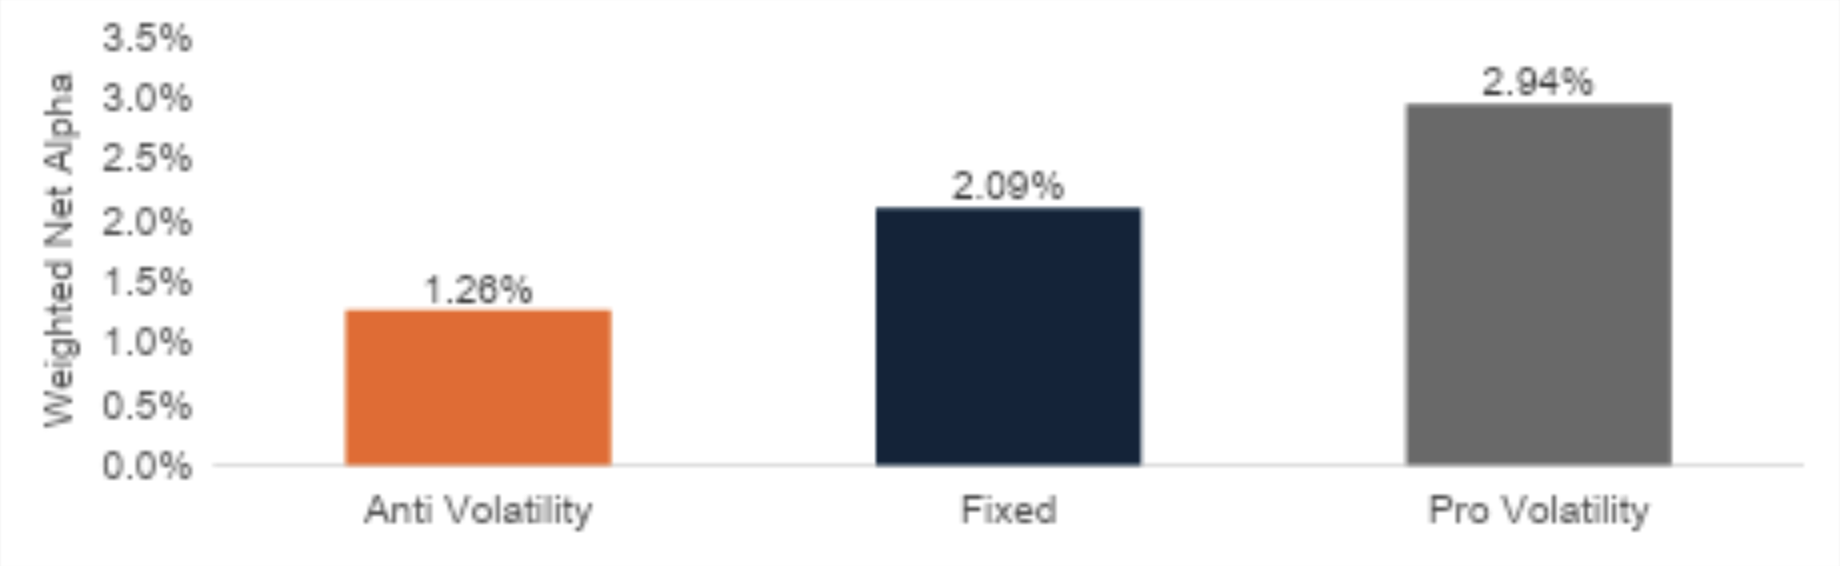
The Alpha results are also meaningful. Figure 3 also shows that the pro-volatility strategy produces an Alpha of 2.94%, compared with 2.09% for the fixed strategy and 1.26% for the anti-volatility strategy. In other words, increasing commitments during higher-volatility periods is not only associated with stronger absolute private-market performance, but also demonstrated improved performance relative to public markets4.

Figure 3: Capital-Weighted Net IRR, TVPI, and Alpha Across Private Capital

Chart comparing capital-weighted net IRR across anti-volatility, fixed and pro-volatility strategies

Chart comparing capital-weighted net TVPI across anti-volatility, fixed and pro-volatility strategies

Chart comparing capital-weighted net alpha across anti-volatility, fixed and pro-volatility strategies

Source: Burgiss

Notes:

  1. For the full definition of private capital, see the definitions section at the end
  2. Public Index used for direct alpha is the MSCI AWCI Index (see endnotes and disclosures for more information)
  3. Total capital deployed across these three strategies is close but not exact, due to volatility percentiles deviating slightly from 50%

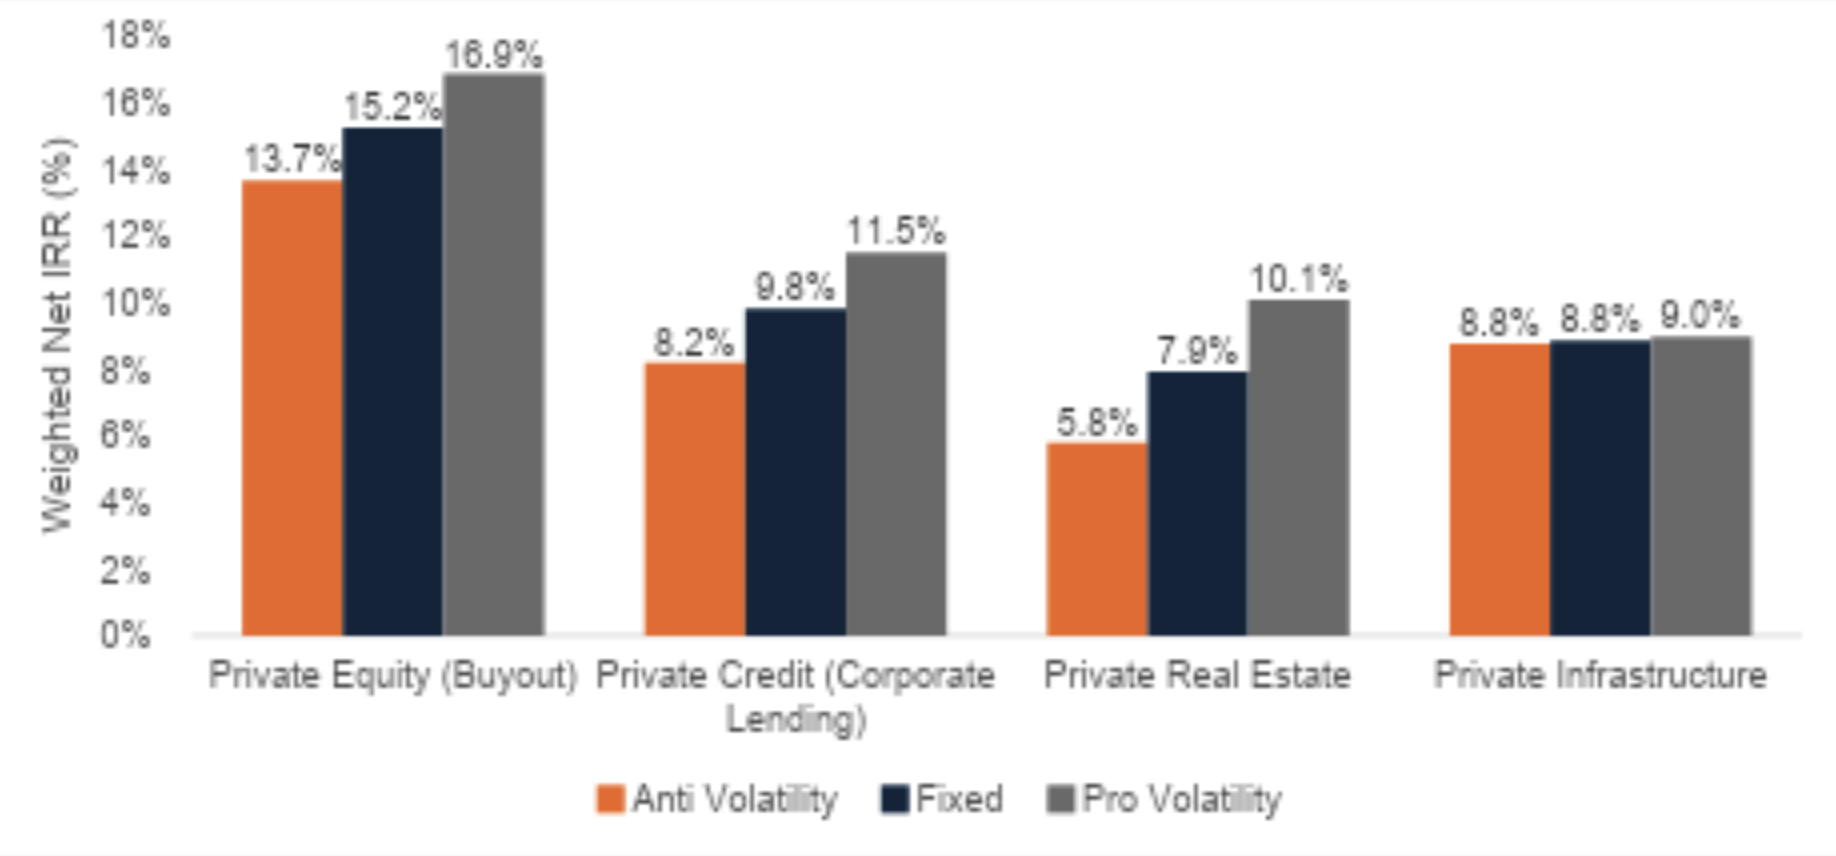
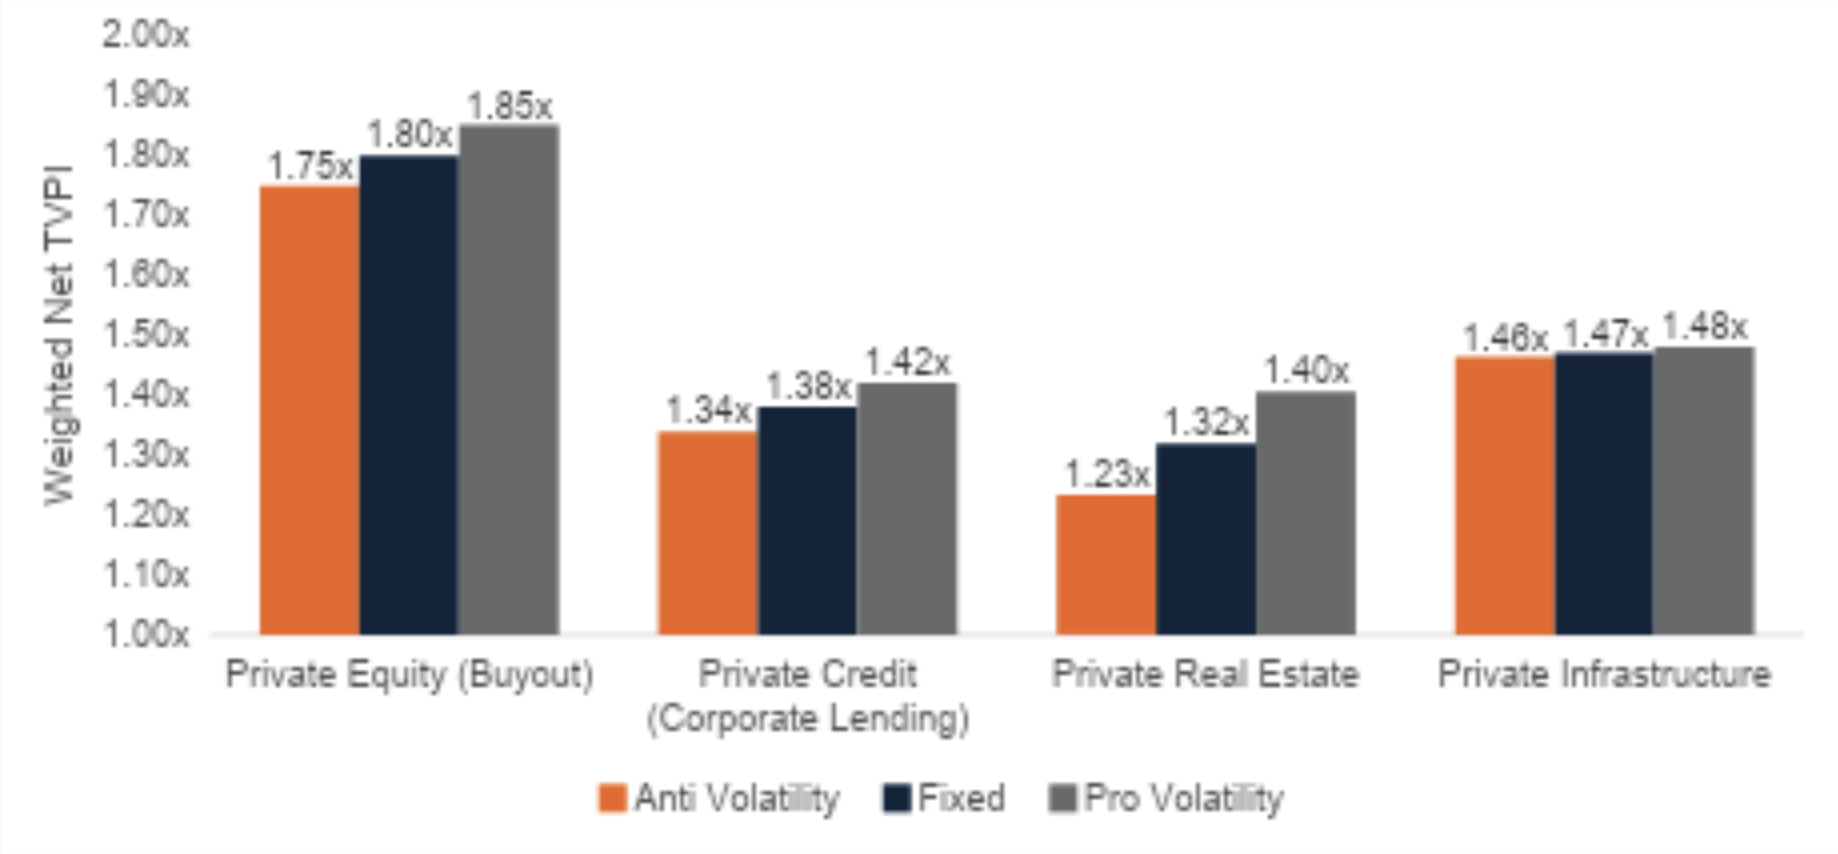
The pattern is not confined to private capital in the aggregate. Figure 4 breaks out the results across four major asset classes in our analysis: Private Equity Buyout, Private Credit Corporate Lending, Private Real Estate, and Private Infrastructure. Each category generates stronger performance under the pro-volatility approach.

The largest spread appears in Private Real Estate, where the pro-volatility strategy outperformed the anti-volatility strategy by 4.3 percentage points of Net IRR and 0.17x of TVPI. Private Equity Buyout also benefits, posting a 3.2 percentage-point Net IRR spread and a 0.10x TVPI spread.

Private Credit may be the most interesting case. The pro-volatility strategy outperformed the anti-volatility strategy by 3.3 percentage points of Net IRR and 0.18x of TVPI. Our 2023 work on commitment timing found that fundraising cycles offered only a modest edge in the asset class. Volatility appears to have been a more powerful signal.

Infrastructure is the exception in degree, though not in direction. The pro-volatility approach still outperformed, but only modestly. That relative stability may make infrastructure less sensitive to vintage-year volatility and more useful as a defensive allocation during uncertain periods.

Figure 4: Capital-Weighted Net IRR and TVPI Across Private Equity (Buyout), Private Credit (Corporate Lending), Private Real Estate, and Private Infrastructure

Chart comparing net IRR by private market asset class across volatility commitment strategies

Chart comparing net TVPI by private market asset class across volatility commitment strategies

Source: Burgiss

Notes:

  1. Region for asset classes shown above is global
  2. For more details on asset classes, see the definitions section at the end
  3. Infra data is unavailable pre-2004, so lower metrics might be the result of missing the high volatility periods of the dot com bubble
  4. Total capital deployed across these four strategies is close but not exact, due to volatility percentiles deviating slightly from 50%

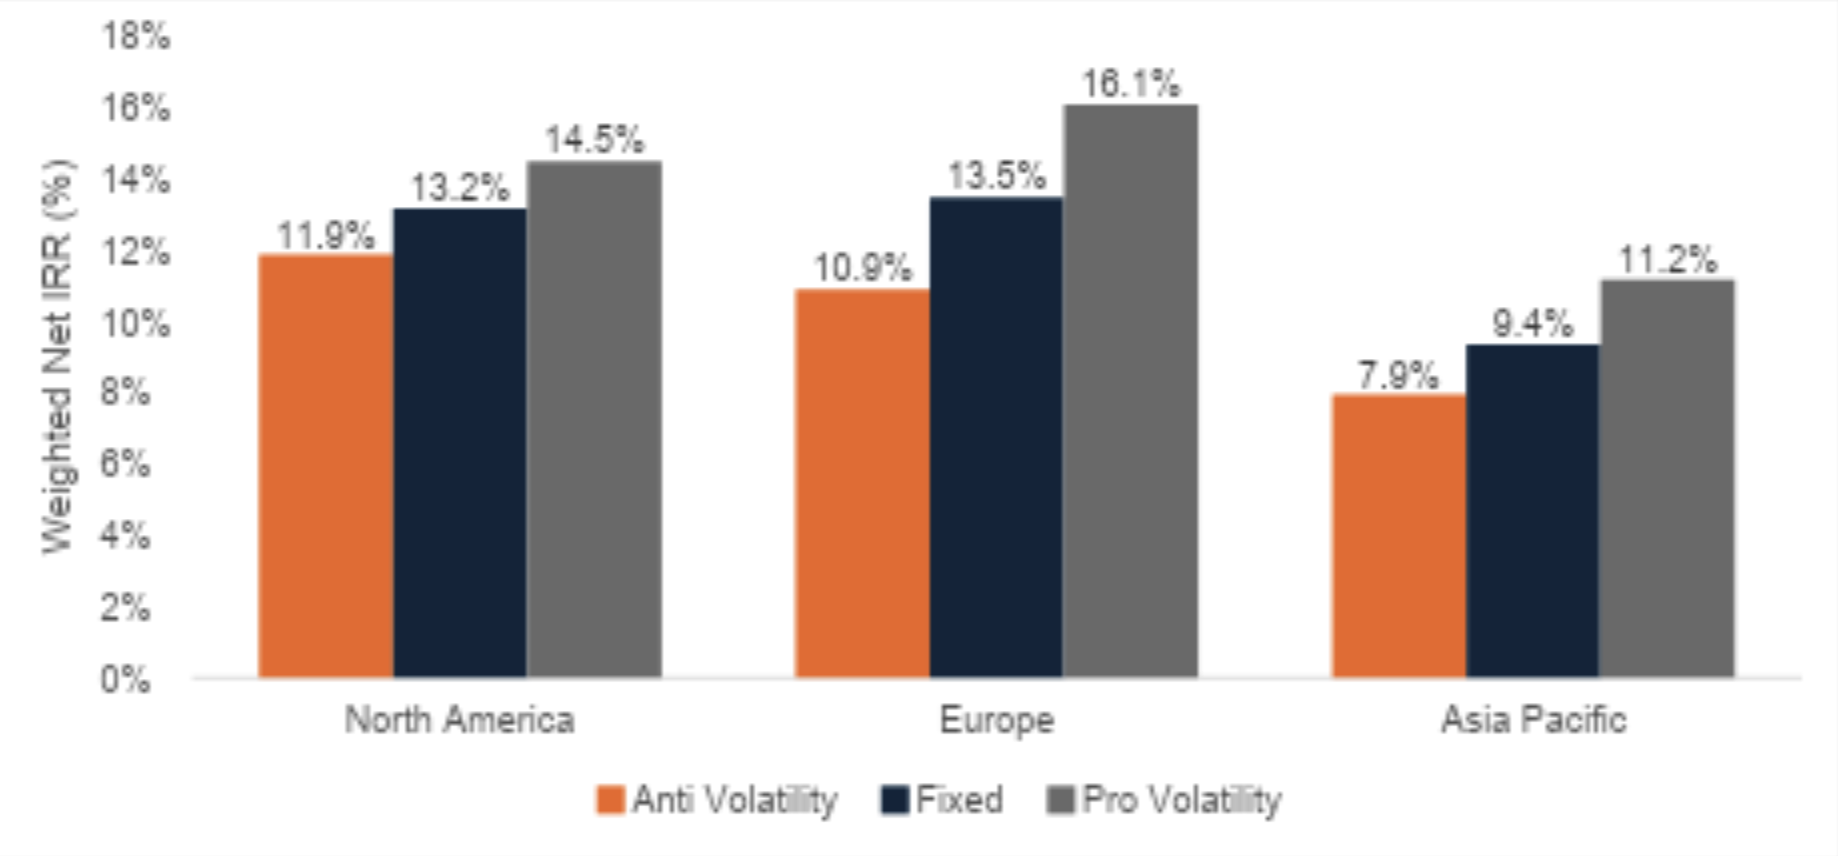
The regional results tell a similar story. Across North America, Europe, and Asia Pacific, higher volatility commitment periods were associated with stronger subsequent fund performance. Europe shows the largest pro-versus-anti volatility spread, at more than 5 percentage points of Net IRR. North America and Asia Pacific also benefit, with spreads of roughly 2.6 and 3.3 percentage points, respectively.

Figure 5: Capital-Weighted Net IRR by Region, Aggregated Across Private Equity (Buyout), Private Credit (Corporate Lending), Private Real Estate, and Private Infrastructure

Chart comparing capital-weighted net IRR across North America, Europe and Asia Pacific

Source: Burgiss

Notes:

  1. Due to Venture funds being a large part of North American and APAC Private Capital, we calculate metrics for only PE Buyout, PC Corporate Lending, Real Estate, and Infra for the cross regional comparison
  2. North America contains the US and Canada. Burgiss classifies Mexico as part of Latin America
  3. Total capital deployed across these three strategies is close but not exact, due to volatility percentiles deviating slightly from 50%

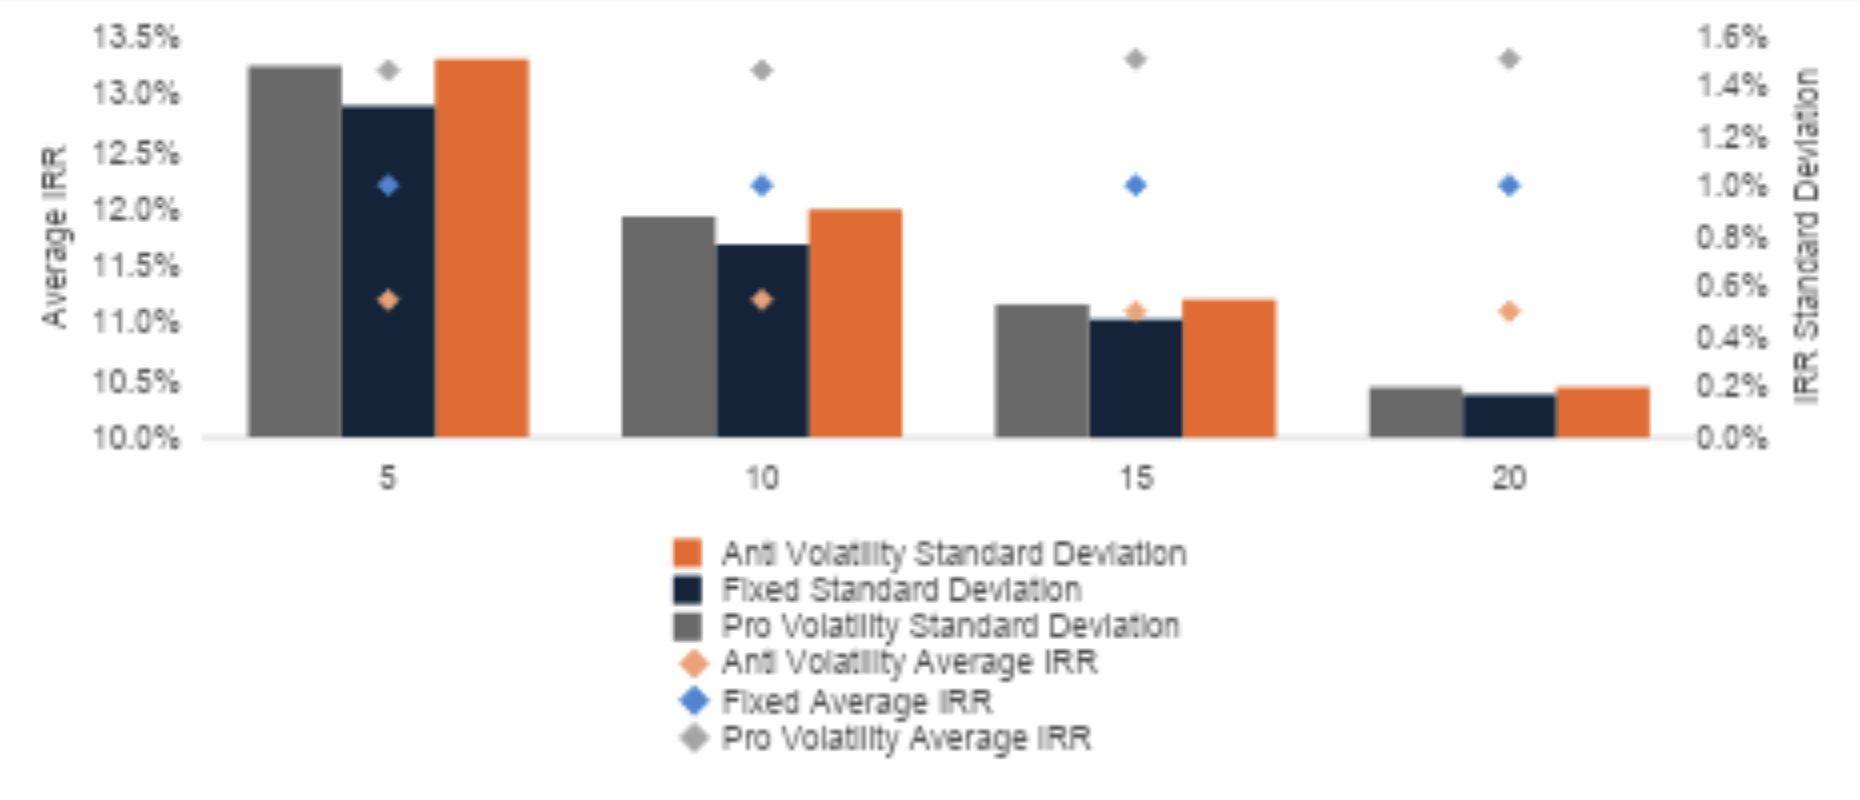
The volatility signal not only held across the entire testing period, but also for smaller portfolios of vintages. By simulating 10,000 portfolios at various sizes, we see in Figure 6 that on average, smaller portfolios that lean into volatility still outperformed the base strategy by an extra 1.1 percentage points of Net IRR.

Leaning into volatility may increase risk, but not by any considerable margin, as shown in Figure 6. The pro-volatility strategy does add 0.1 – 0.2 percentage points of standard deviation relative to the fixed strategy, but avoiding volatility drives a similar increase in risk. As vintage exposure scales, that gap narrowed even further.

We believe the implication is clear: avoiding volatility does not make portfolios safer—it simply lowers returns while demonstrating no meaningful risk relief. While risk inverse investors may be deterred by the potential increased risk by leaning into volatility, our research demonstrates that staying committed is beneficial.

Figure 6: Average and Standard Deviation of IRRs by Number of Vintages in a Portfolio for Private Capital and Geographies, Across 10,000 Simulated Portfolios for Each Size

Chart showing average IRR and standard deviation across simulated private capital portfolios by number of vintages

Source: Burgiss

Notes:

  1. Total capital deployed across portfolios may vary due to differing volatility percentiles
  2. Average IRRs and Standard Deviations are calculated across different portfolios of vintages
 
Conclusion

Volatility is usually treated as a risk to manage. In private markets, we believe it may also be an opportunity to underwrite.

The historical record suggests that funds raised during higher-volatility periods tended to deliver stronger long-term performance. This pattern appears across private capital overall, across most major asset classes, and across the three major geographic regions in this analysis. The intuition is straightforward: volatile periods often bring lower entry multiples, reduced competition for assets, and greater discipline around underwriting and operations.

This does not make volatility a free lunch. Periods of market stress often coincide with public-market drawdowns, liquidity constraints, and pressure on portfolio allocations. Investors who increase private-market commitments during those periods may give up some ability to rebalance into recovering public markets. Commitment pacing also matters; over-allocating to any single vintage can create its own risks.

Still, the research points to an important conclusion. Investors should not reflexively reduce private-market commitments when volatility rises. For those with long-term capital, sufficient liquidity, and disciplined pacing, volatility may be less a reason to retreat than a reason to stay active.


READ MORE FROM ARES MANAGEMENT


Endnotes:

  1. All private fund performance data shown in this analysis is sourced from Burgiss, and VIX index data is sourced from FRED. Both are as of Q1 2026. See definitions for more details on Burgiss
  2. Recent excluded vintages include 2021-2025
  3. Public benchmark used to compare Private Capital Direct Alpha is the MSCI AWCI Index. See disclosures for more details on index comparisons
  4. The VIXCLS index refers to the daily closing value of the Cboe Volatility Index (VIX), famously known as Wall Street's "fear gauge". Tracked and disseminated by the Federal Reserve Bank of St. Louis (FRED), it measures the market's expectation of near-term, 30-day volatility for the S&P 500 Index.

Burgiss Related Definitions:

Burgiss Data: Burgiss is a data, decision-support and benchmarking service for the private capital markets. Private iQ is a statistical product for private equity performance analysis that is maintained by The Burgiss Group, LLC. Private iQ currently contains data on over 13,000 funds and funds of funds, with total capitalization of $12.2 trillion (as of July 2026). Burgiss obtains fund data through clients of its private equity portfolio management service and as a result Private iQ is thought to be relatively complete and unbiased

Private Capital: A collection of metrics based on the full available universe of private funds in the Burgiss database in vintage years 2000—2020.

Private Equity (Buyout): A collection of metrics based on the available universe of private funds in the Burgiss database under the Buyout asset class, in vintage years 2000-2020.

Private Credit (Corporate Lending): A collection of metrics based on the available universe of private funds in the Burgiss database under the Corporate Lending asset class, in vintage years 2000-2020.

Private Real Estate: A collection of metrics based on the available universe of private funds in the Burgiss database under the Real Estate asset class, in vintage years 2000-2020.

Private Infrastructure: A collection of metrics based on the available universe of private funds in the Burgiss database under the Infrastructure asset class, in vintage years 2000-2020.

Legal Notice and Disclaimers

The indices presented herein are provided for illustrative purposes only and are not intended to represent the performance of any investment, portfolio, strategy, or product. The indices have not been selected as benchmarks or performance targets and are provided solely as examples of well-known and widely recognized market indices.

Comparisons to indices have significant limitations. Indices generally have different investment objectives, characteristics, asset compositions, risk profiles, liquidity characteristics, and levels of volatility than private market investments and may employ investment guidelines and criteria that differ materially from those applicable to private market strategies. As a result, the performance of private market investments may differ significantly from the performance of the indices presented.

The indices do not reflect the deduction of management fees, carried interest, transaction costs, expenses, or other charges and may not reflect the reinvestment of income or distributions. Indices are unmanaged and investors cannot invest directly in an index.

No representation is being made that any private market investment, portfolio, or strategy will achieve returns comparable to any index presented. The indices are included solely as general market reference points and should not be viewed as an indication of the performance, risk profile, or characteristics of any investment opportunity.

Past performance is not indicative of future results. There can be no assurance that any investment, strategy, or product will achieve its objectives, generate profits, avoid losses, or produce results comparable to any historical index performance.

These materials may contain “forward-looking” information that is not purely historical in nature, and such information may include, among other things, projections, forecasts or estimates of cashflows, yields or returns, scenario analyses and proposed or expected portfolio composition. The forward-looking information contained herein is based upon certain assumptions about future events or conditions and is intended only to illustrate hypothetical results under those assumptions (not all of which will be specified herein). Not all relevant events or conditions may have been considered in developing such assumptions. The success or achievement of various results and objectives is dependent upon a multitude of factors, many of which are beyond the control of Ares. No representations are made as to the accuracy of such estimates or projections or that such projections will be realized. Actual events or conditions are unlikely to be consistent with and may differ materially from, those assumed. Prospective investors should not view the past performance of Ares as indicative of future results. Ares does not undertake any obligation to publicly update or review any forward-looking information, whether because of new information, future developments or otherwise.

Share this post

Sign Up Now for Full Access to Articles and Podcasts!

Unlock full access to our vast content library by registering as an institutional investor

Register

Contacts


Image
ARES Logo

Ares Management Corporation (NYSE: ARES) is a leading global alternative investment manager offering clients complementary primary and secondary investment solutions across the credit, real estate, private equity and infrastructure asset classes. We seek to advance our stakeholders’ long-term goals by providing flexible capital that supports businesses and creates value for our investors and within our communities. By collaborating across our investment groups, we aim to generate consistent and attractive investment returns throughout market cycles.

Ares manages over $62 billion on behalf of 282 third-party insurance companies globally (as of March 31, 2026). For more information, please visit www.ares.com.

Robert Torretti  
Partner, Co-Head of Insurance, Americas Relationship Management  
rtorretti@aresmgmt.com
212-515-3385

Amanda Healy   
Partner, Co-Head of Insurance, Americas Relationship Management   
ahealy@aresmgmt.com
212-515-3351

Ares Management
245 Park Avenue, 44th Floor,
New York, NY 10167

View the contributor page

Sign Up Now for Full Access to Articles and Podcasts!

Unlock full access to our vast content library by registering as an institutional investor .

Create an account

Already have an account ? Sign in

Ѐ Ё Ђ Ѓ Є Ѕ І Ї Ј Љ Њ Ћ Ќ Ѝ Ў Џ А Б В Г Д Е Ж З И Й К Л М Н О П Р С ΄ ΅ Ά · Έ Ή Ί Ό Ύ Ώ ΐ Α Β Γ Δ Ε Ζ Η Θ Ι Κ Λ Μ Ν Ξ Ο Π Ρ Ё Ђ Ѓ Є Ѕ І Ї Ј Љ Њ Ћ Ќ Ў Џ А Б В Г Д Е Ж З И Й К Л М Н О П Р С Т У Ф Х Ц Ч Ш Ā ā Ă ă Ą ą Ć ć Ĉ ĉ Ċ ċ Č č Ď ď Đ đ Ē ē Ĕ ĕ Ė fi fl œ æ ß