

Barings -

The Evolution of the CLO Market

Cascading waterfalls surrounded by lush green forest.

Steve Page, CFA
Managing Director, Structured Credit


Welcome to this month's edition of Where Credit Is Due, a newsletter from Barings recognizing value across the people and portfolios shaping credit markets today.

Collateralized loan obligations (CLOs) were once a relatively small and specialized corner of the credit market. Today, the market totals nearly $1.5 trillion, including more than $1 trillion in U.S. broadly syndicated CLOs, nearly $200 billion in U.S. private credit CLOs and approximately $300 billion in European CLOs.1 Along the way, the asset class has become a critical source of financing for corporate borrowers and an increasingly important tool for investors.

But the story is no longer just about growth. Investor access is expanding through ETFs, while the CLO structure is being applied across new areas of the credit market, including direct lending and infrastructure debt.

This month, with the help of Steve Page, CFA, Portfolio Manager in Barings’ Structured Credit group, we explore what a CLO is, why investor interest continues to grow and what the future may hold for the market.

The Speed Read
  • CLOs have evolved from a niche strategy into a global market approaching $1.5 trillion.
  • Strong performance and floating-rate coupons have helped drive investor adoption.
  • Investor access continues to broaden through multi-credit strategies and CLO ETFs.
  • The opportunity set now extends beyond broadly syndicated loans into private credit and infrastructure CLOs.
  • As the market evolves, manager selection and credit underwriting remain critical.
What is a CLO?

A CLO is an actively managed securitized product backed by a highly diversified pool of leveraged loans. CLOs provide an efficient, scalable way to invest in floating-rate loans while offering structural protections designed to absorb losses and withstand periods of market volatility.

These features have helped support strong performance through multiple credit cycles.

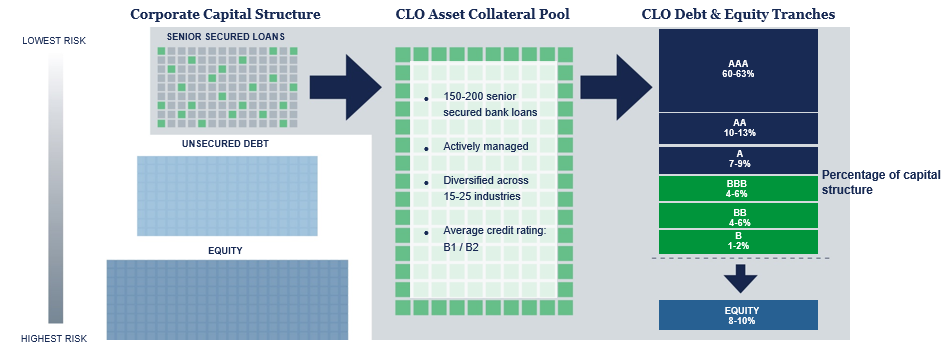
Typical CLO Structure

Barings diagram illustrating a typical CLO structure

Source: Barings

Here's how it works:

  • A CLO raises capital from debt and equity investors and uses the proceeds to purchase a diversified pool of senior secured corporate loans.
  • The cash flows generated by those loans are distributed across different tranches of the capital structure, ranging from AAA securities at the top to equity at the bottom.
  • Each tranche offers a different balance of risk and return, allowing investors to choose the exposure that best aligns with their objectives.

The result? A single pool of loans becomes a range of investment opportunities with distinct risk and return characteristics.

  • Higher-rated tranches appeal to investors seeking capital preservation and lower risk.
  • Lower-rated tranches offer the potential for higher income in exchange for greater risk.
  • Equity investors receive the residual cash flows after debt investors are paid.


In short: CLOs transform a diversified pool of loans into securities with different risk and return profiles, allowing a broad range of investors to access the underlying asset class.

Why Have CLOs Attracted Investors?
1. Performance

One of the biggest drivers of investor adoption has been performance.

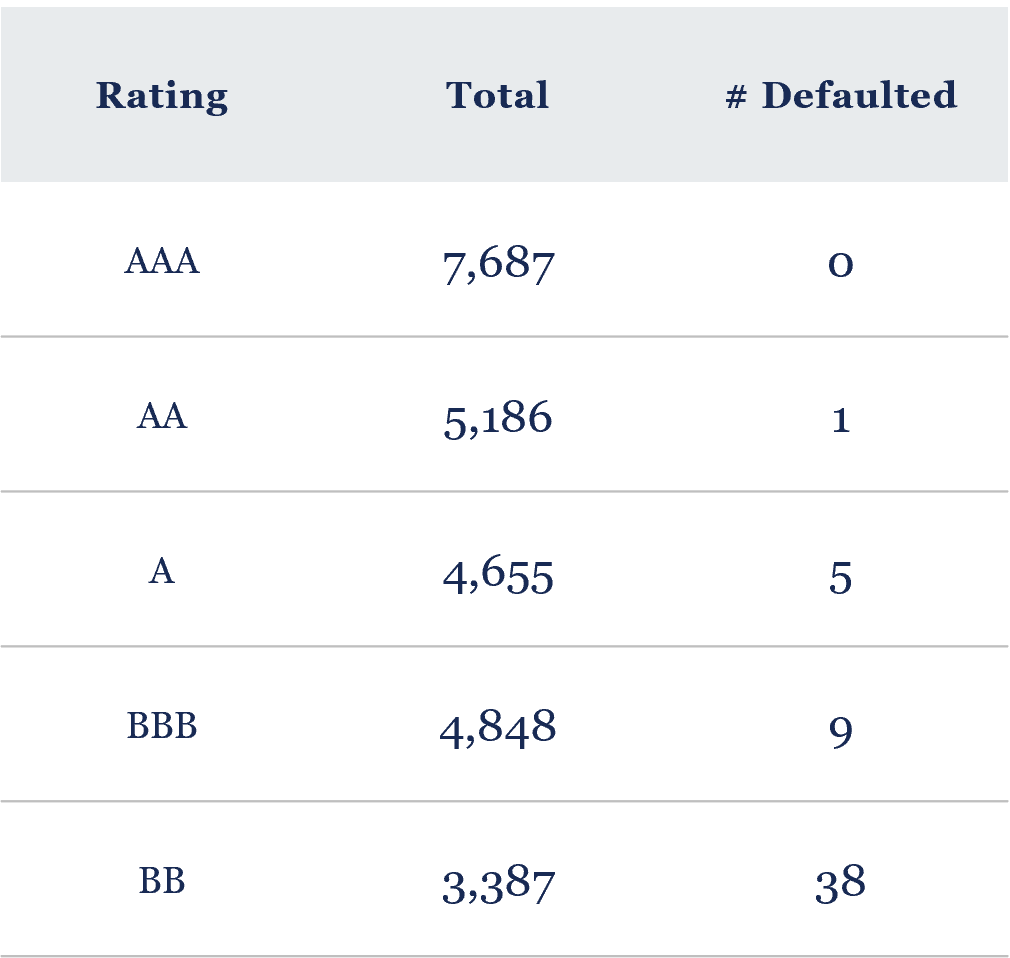
  • No AAA CLO tranche has ever defaulted.2
  • No AAA U.S. CLO tranche has been downgraded since 2012.3
  • Over the last 30 years, cumulative defaults among BB CLO tranches have remained just above 1%, comparing favorably with similarly rated corporate credit.4
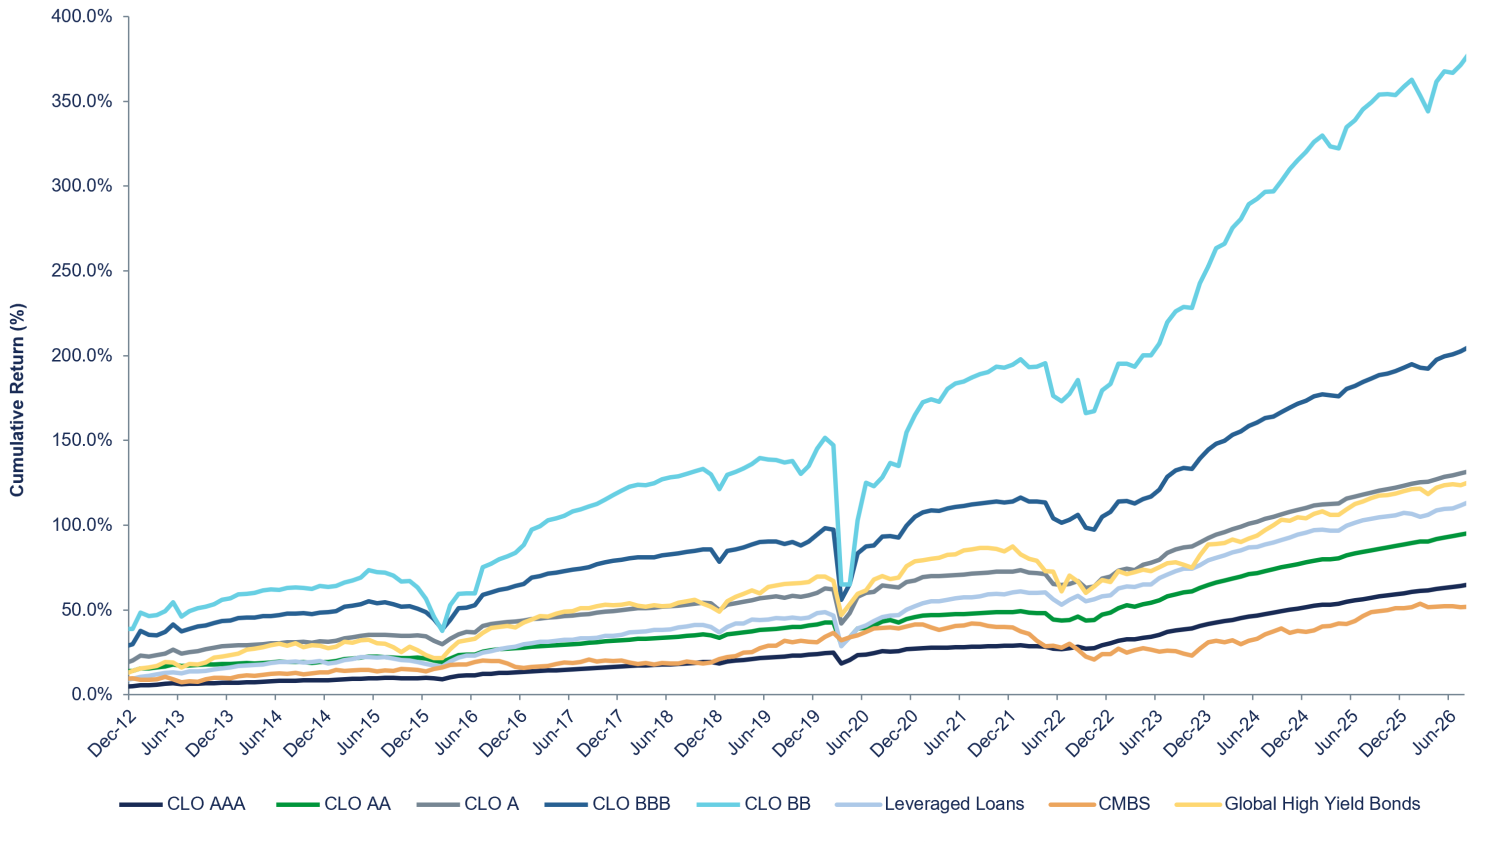
  • Over the last decade-plus, CLO tranches have generated strong cumulative returns across the capital structure.
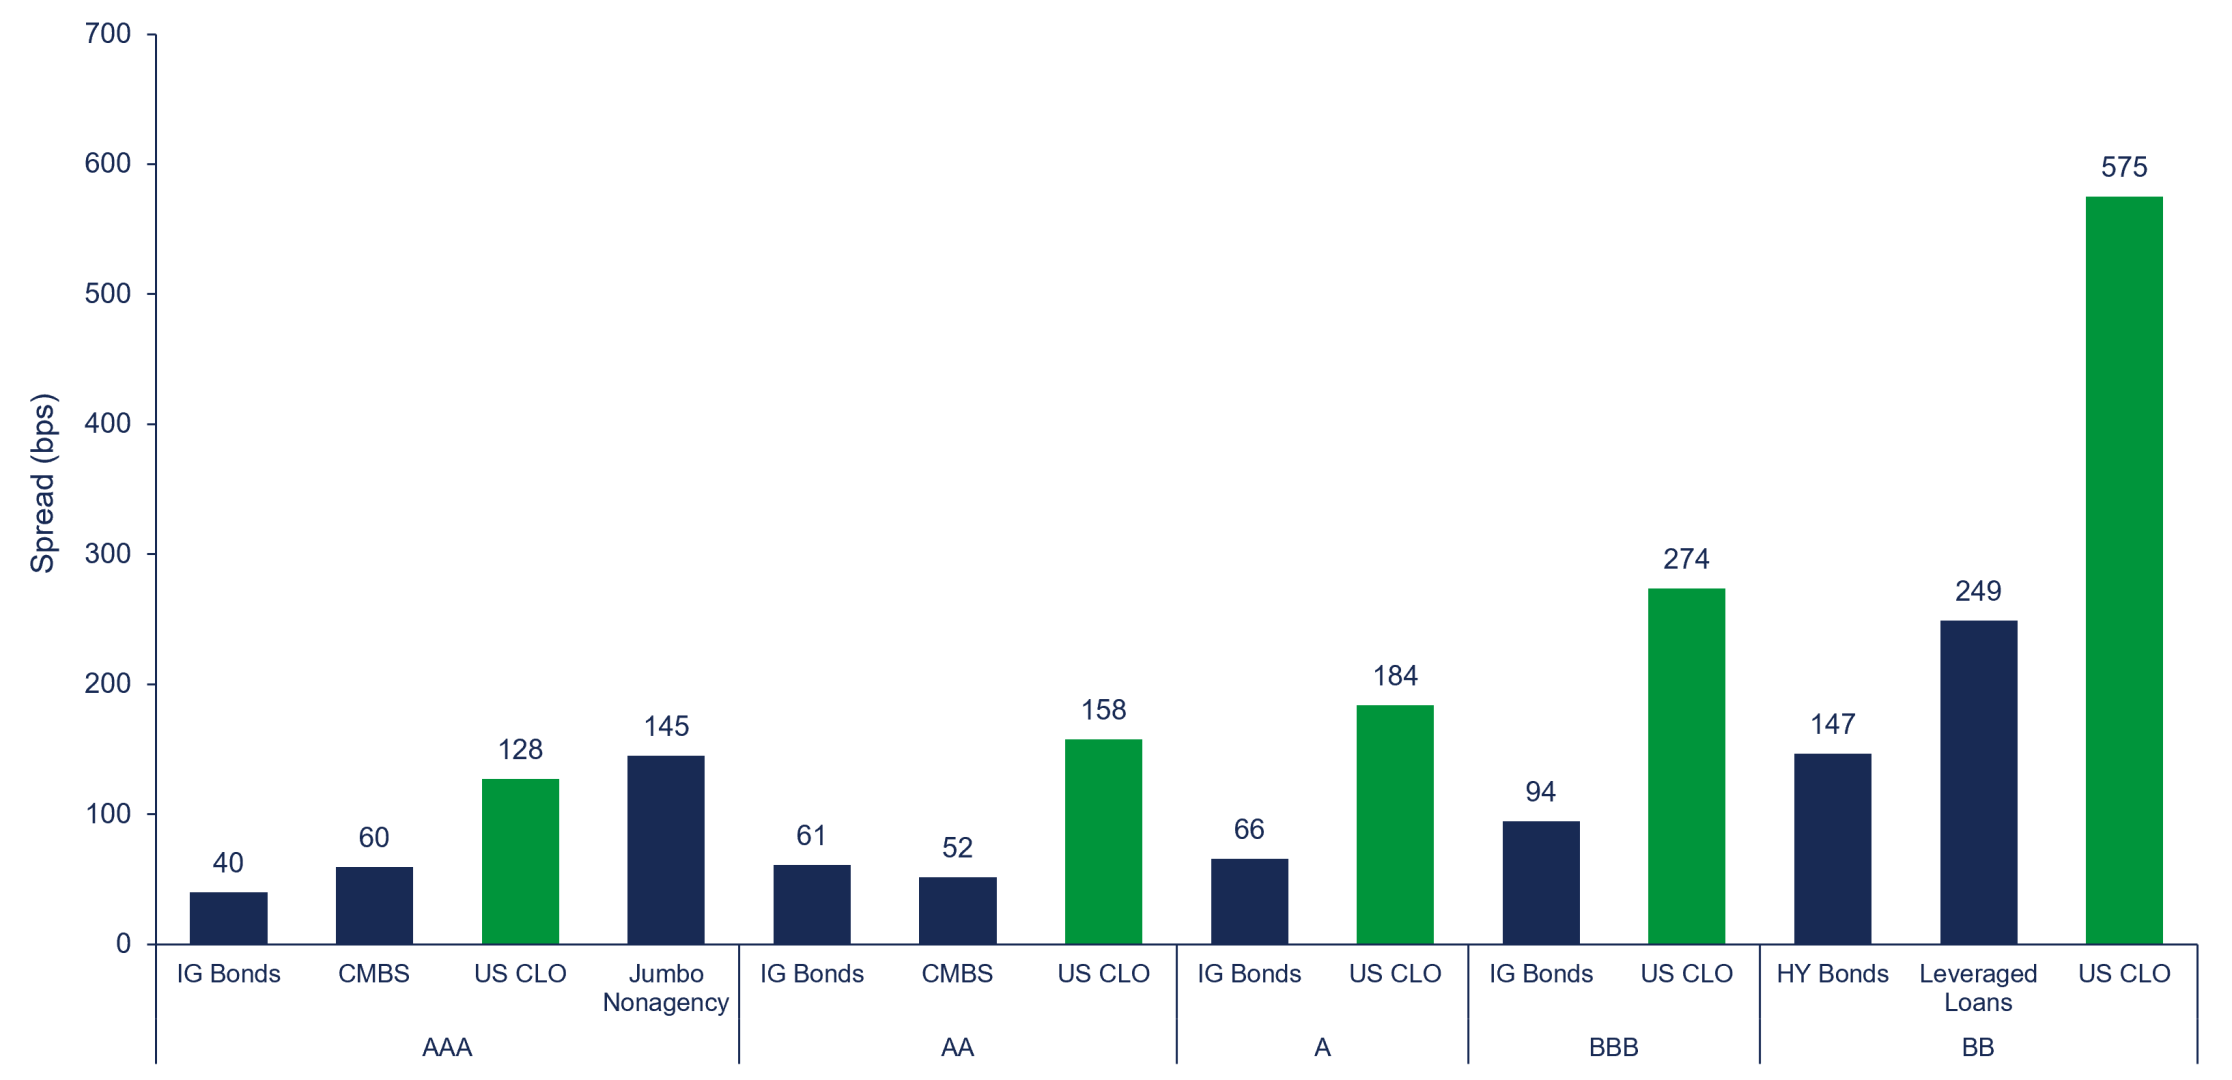
  • CLOs have also historically offered a notable spread advantage relative to many public fixed income alternatives, including investment grade corporates and high yield.
CLO Cumulative Returns (%)

Barings chart showing cumulative returns across CLO tranches and other credit markets

Source: JP Morgan, S&P UBS Leveraged Loan Index, Bloomberg Global Aggregate Index - CMBS, ICE BofA Developed Markets High Yield Constrained Index (HYDC). As of August 31, 2026. PAST PERFORMANCE IS NOT NECESSARILY INDICATIVE OF FUTURE RESULTS.

S&P U.S. CLO Default History (1994-1H 2026)

S&P U.S. CLO default history from 1994 through the first half of 2026

Source: S&P. As of March 31, 2026

Attractive Spread Pick Up

Barings chart comparing CLO spreads with other fixed income markets

Sources: J.P. Morgan US CLO Spreads; BofA Global Research Jumbo Nonagency Spreads; Bloomberg US Aggregate Index – CMBS & Corporate IG; Bloomberg US Corporate High Yield Index; S&P UBS Leveraged Loan Index as of Aug 31, 2026.

2. Less Interest Rate Sensitivity

One characteristic that has become increasingly important in recent years is the floating-rate nature of CLOs.

  • Because the underlying loans pay floating-rate interest, CLO coupons typically adjust as interest rates move higher.
  • This can reduce interest-rate sensitivity relative to many fixed-rate credit investments.
  • As rates rose sharply in 2022 and 2023, many fixed-rate assets came under pressure. By contrast, floating-rate CLOs offered investors the ability to earn higher income while limiting duration risk.
3. Transparency and Active Management

Transparency is another defining characteristic of the asset class.

  • Active management allows CLO issuers to reposition portfolios as market conditions change and CLO investors can monitor the issuer’s credit underwriting and trading over time.
  • Regular trustee and manager reporting provides visibility into portfolio composition, key CLO test results, concentrations and overall portfolio credit characteristics.
  • Asset level transparency and cashflow modelling tools allow CLO investors to stress test tranche investments at a granular (sector, or even individual loan) level.

In short: Long-term performance, the floating-rate nature of the asset class and greater transparency have helped move CLOs from a niche credit strategy into a mainstream asset class.

More Markets, More Investors

Historically, CLOs were primarily the domain of institutional investors, including banks, insurance companies, pensions and asset managers. Today, that investor base continues to broaden.

One of the biggest developments has been the rise of CLO ETFs.

  • CLO ETFs have grown into a roughly $58 billion market.5
  • Assets have expanded by $48 billion over the last year including $17 billion year to date.6
  • Access is widening beyond institutions and into the wealth channel.


At the same time, the use of CLO structures is expanding beyond the broadly syndicated loan market.

Private credit CLOs have already become a meaningful segment of the market, and infrastructure CLOs are beginning to gain traction as well. Rather than being backed by traditional corporate loans, these structures can provide exposure to assets such as middle market loans, renewable energy projects, digital infrastructure and transportation systems.

The underlying concept is similar: creating different risk and return profiles from diversified pools of income-generating assets. As investors seek new sources of diversification and income, the range of markets using CLO structures continues to expand.

In short: As investor interest and access broaden, and CLO structures expand into new areas of credit, the asset class is evolving well beyond its roots in broadly syndicated loans.

The Next Challenge: Separating Winners from Losers

As the CLO market grows, the opportunity set is expanding. But so is the need for selectivity.

One area drawing particular attention is software. The sector represents roughly 12-15% of the broadly syndicated loan market, making it a meaningful component of many CLO portfolios.7

As artificial intelligence reshapes industries, investors are increasingly focused on understanding which companies stand to benefit and which may face disruption.

The issue isn't necessarily software exposure itself. It's the quality of the individual credits within that exposure.


Some borrowers have successfully extended maturities and maintained market access. Others have faced increasing refinancing pressure as investors question how AI could affect future earnings power. With roughly 25-30% of the software sector’s debt scheduled to mature between now and the end of 2028, the ability of individual borrowers to refinance may become an important test.8

New broadly syndicated CLOs are generally coming to market with less software exposure, although approaches vary considerably by issuer. Private credit CLOs tend to have somewhat higher exposure, reflecting the composition of the underlying private credit market.

For CLO investors, that reinforces an important point: the dispersion between winners and losers will likely continue to widen, with performance heavily dependent on manager selection and underwriting discipline. Evaluating not only the underlying loan portfolio, but also the quality of the collateral manager and the specific tranche being purchased, could become an increasingly important differentiator going forward.

In short: The next phase of CLO investing may be less about gaining exposure to the asset class and more about identifying managers, sectors and credits best positioned to navigate a wider range of outcomes.

Looking Ahead

The outlook remains cautiously constructive. Yields continue to look attractive, floating-rate coupons can help reduce interest-rate sensitivity and the structural protections embedded within CLOs have historically helped the asset class navigate challenging market environments.

At the same time, as the market grows and opportunity sets become more diverse, manager selection and underwriting discipline are becoming increasingly important.

The key question is no longer whether CLOs belong in portfolios. Increasingly, the focus is on where the most compelling opportunities exist and which managers are best positioned to capture them.


READ MORE FROM BARINGS

Citations:

1) Source J.P. Morgan as of August 31, 2026.

2) Source: S&P. As of March 31, 2026. CLO default rates represent 10-year cumulative default estimates derived from long-term observed tranche default history (1994-1H 2026).

3) Source: S&P Global Ratings Credit Research & Insights and S&P Global Market Intelligence’s CreditPro. As of June 30, 2026.

4) Source: S&P. As of March 31, 2026. CLO default rates represent 10-year cumulative default estimates derived from long-term observed tranche default history (1994-1H 2026).

5) Source: Bank of America. As of September 2026.

6) Source: Bank of America. As of September 2026.

7) Source: Pitchbook LCD. As of September 2026.

8) Source: Morgan Stanley Research. As of September 2026.

Barings is a $502 billion* global alternative asset manager that partners with institutional, insurance and wealth clients and supports leading businesses with flexible financing solutions. The firm, a subsidiary of MassMutual with a minority investment from MS&AD, seeks to deliver excess returns by leveraging its global scale and capabilities across credit, real assets, capital solutions and emerging markets.

*As of June 30, 2026

Compliance Code: 26-5949677

This commentary is for informational purposes only and does not constitute an offer or solicitation to purchase or sell any financial instrument or service in any jurisdiction. It was prepared without consideration of the investment objectives, financial situation, or particular needs of any recipient. This commentary is not, and must not be treated as, investment advice, an investment recommendation, investment research, or a recommendation regarding the suitability or appropriateness of any security, investment, or investment strategy. It must not be construed as a projection or prediction.

Share this post

Sign Up Now for Full Access to Articles and Podcasts!

Unlock full access to our vast content library by registering as an institutional investor

Register

Contacts


Image
Logo

Barings is a $502 billion* global alternative asset manager that partners with institutional, insurance and wealth clients and supports leading businesses with flexible financing solutions. The firm, a subsidiary of MassMutual with a minority investment from MS&AD, seeks to deliver excess returns by leveraging its global scale and capabilities across credit, real assets, capital solutions and emerging markets.

*As of June 30, 2026
 

Ilena Coyle
Head of North American Insurance and Intermediary  
ilena.coyle@barings.com
973-271-2400

www.barings.com
 
300 South Tryon St, Suite 2500,
Charlotte, NC 28202


View the contributor page

Sign Up Now for Full Access to Articles and Podcasts!

Unlock full access to our vast content library by registering as an institutional investor .

Create an account

Already have an account ? Sign in

Ѐ Ё Ђ Ѓ Є Ѕ І Ї Ј Љ Њ Ћ Ќ Ѝ Ў Џ А Б В Г Д Е Ж З И Й К Л М Н О П Р С ΄ ΅ Ά · Έ Ή Ί Ό Ύ Ώ ΐ Α Β Γ Δ Ε Ζ Η Θ Ι Κ Λ Μ Ν Ξ Ο Π Ρ Ё Ђ Ѓ Є Ѕ І Ї Ј Љ Њ Ћ Ќ Ў Џ А Б В Г Д Е Ж З И Й К Л М Н О П Р С Т У Ф Х Ц Ч Ш Ā ā Ă ă Ą ą Ć ć Ĉ ĉ Ċ ċ Č č Ď ď Đ đ Ē ē Ĕ ĕ Ė fi fl œ æ ß