
T. Rowe Price -

The Quantamental Advantage in Fixed Income Investing

Abstract pattern of blue and white dots forming intersecting horizontal and vertical lines.

Robert M. Larkins, CFA
Head, Fixed Income Quantitative Portfolio Management

Jeffrey S. DeVack, CFA
Portfolio Specialist


A powerful blend of quantitative techniques and fundamental research.

 
Key Insights
  • Quantamental investing has grown in popularity, but how asset managers combine quantitative techniques with fundamental research can vary considerably.
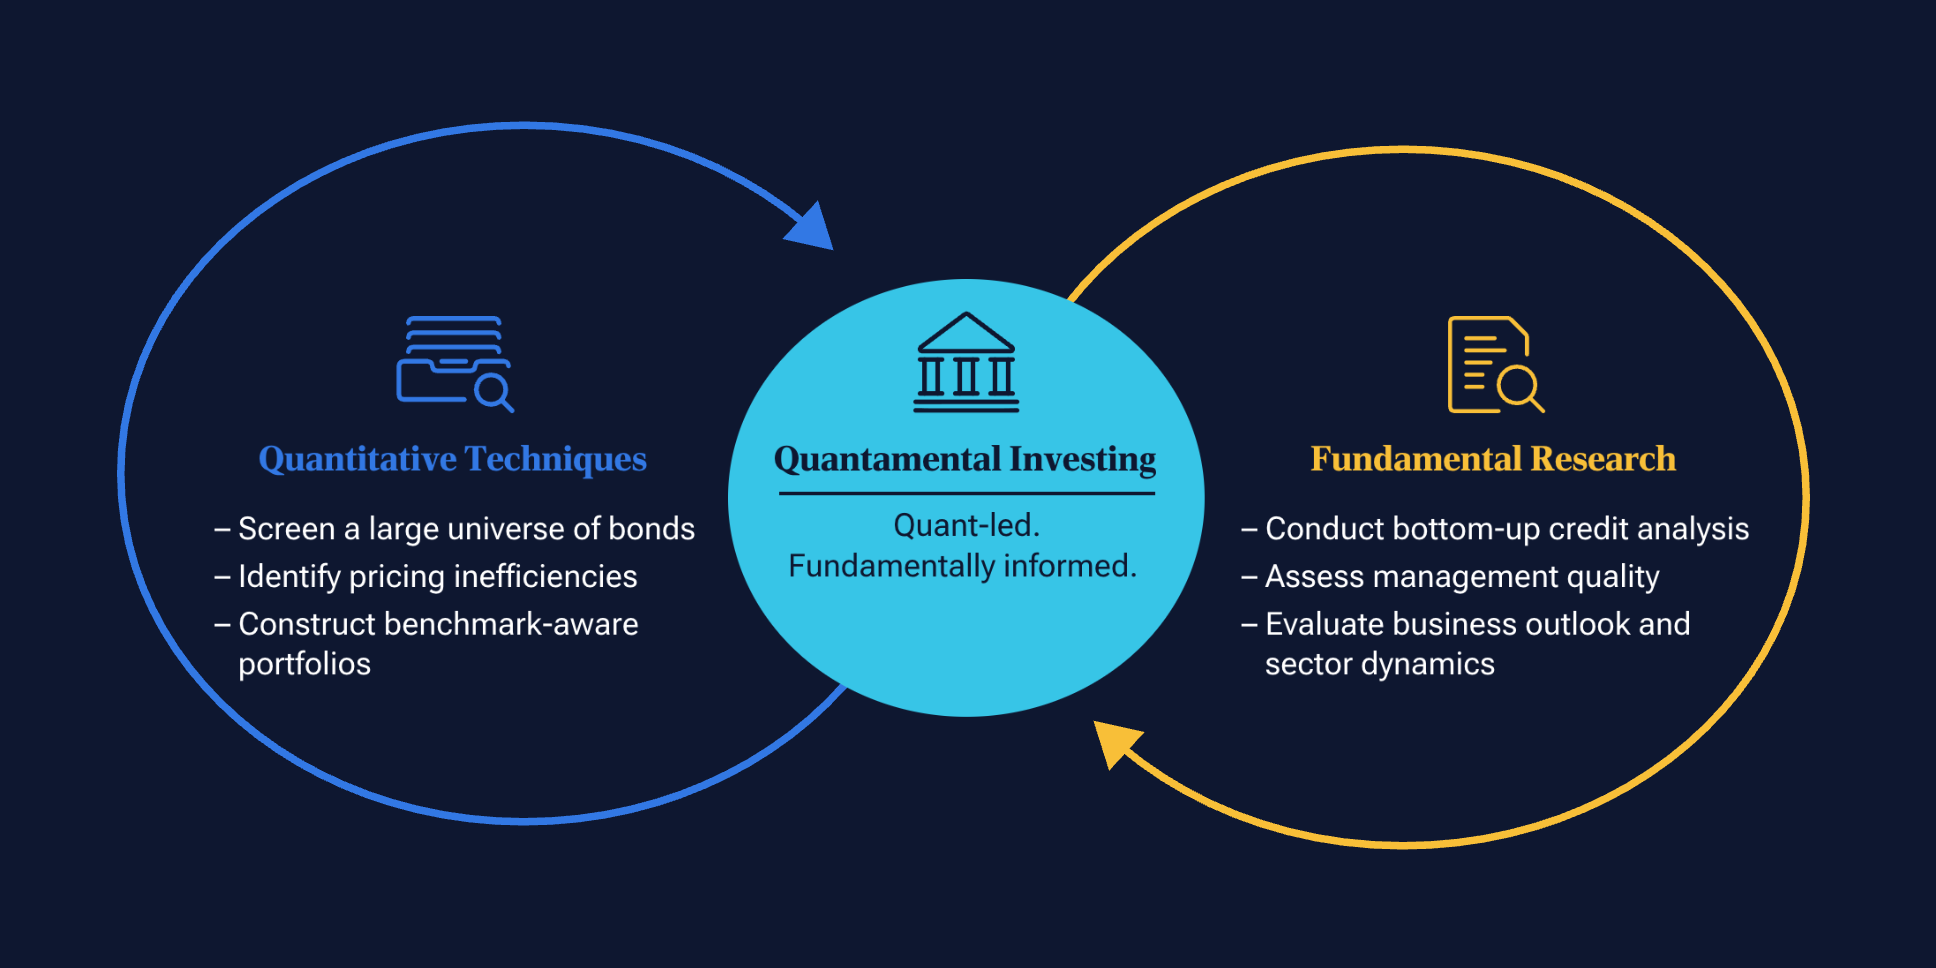
  • Our approach utilizes quantitative tools to identify persistent bond market inefficiencies and construct benchmark-aware, while our fundamental component validates investment opportunities and helps manage credit risk.
  • We believe this integrated approach provides an efficient framework for navigating high-quality bonds, while seeking modest excess returns and maintaining low tracking error.

What is quantamental investing, and how does it work? Although quantamental investing has grown in popularity, asset managers vary considerably in how they combine quantitative techniques with fundamental research. Our approach is quant-led and fundamentally informed, with a particular focus on identifying and exploiting persistent inefficiencies in the multi-trillion-dollar fixed income market.

For us, the quantitative element is not about black-box trading1 or pure statistical models driving investment decisions. Rather, it involves using quantitative techniques to construct a bond portfolio designed to capitalize on structural market inefficiencies.

We complement this with fundamental research and credit analysis, which helps validate the ideas identified through quantitative analysis while providing deeper insights into issuer-specific risks and opportunities that quantitative models alone may not capture. Together, we believe these disciplines provide a robust framework for navigating high-quality bond markets.

 
The quantitative component: Identifying inefficiencies and constructing portfolios

With tens of thousands of securities, bond indexes are significantly larger and viewed as more complex than their equity counterparts. For example, the Bloomberg U.S. Aggregate Bond Index (U.S. Agg)—a benchmark behemoth—contains more than 14,000 securities. We use quantitative tools to screen this vast universe, identify persistent inefficiencies, and construct a portfolio designed to capitalize on them while maintaining key benchmark characteristics, such as duration and yield curve exposures.

Bonds are purchased for a variety of different reasons. Insurance companies often seek yield, pension funds focus on matching long-term liabilities, and other investors pursue income or relative value opportunities. These differing objectives create pricing distortions that become embedded in bond indexes, creating opportunities to position portfolios to capitalize on resulting market inefficiencies. A good example is the market for long-dated U.S. investment-grade corporate bonds, where strong demand from investors focused on yield or liability matching can result in valuations that are expensive relative to other areas of the market.

Quantitative techniques help us identify these persistent pricing distortions and structure portfolios that tilt away from richly valued segments and toward areas offering more attractive relative value that have historically been more efficient at generating risk-adjusted returns.

 
The fundamental component: Validating ideas through bottom-up research

Quantitative techniques are highly effective at screening a large investment universe, but they often rely primarily on historical data and may miss forward-looking changes in a sector or in an issuer’s credit profile. This is where fundamental research plays a critical role. Through research, we validate the opportunities identified through quantitative analysis while assessing risks that quantitative models alone may not capture.

Bottom-up research helps assess factors such as a company’s management quality, business outlook, and sector dynamics, seeking to identify risks and opportunities that may not yet be reflected in credit ratings, market prices, or quant signals.

This is particularly important in fixed income markets because bonds exhibit asymmetric risk characteristics. While the upside is generally limited, the downside can be significant if a company’s credit quality deteriorates, or, in the worst case, the issuer defaults. By identifying potential credit deterioration early through robust, independent underwriting, we can underweight or avoid securities where our fundamental analysis suggests risks are increasing.

Our quantamental investing approach in fixed income
(Fig. 1) Combining quantitative techniques with fundamental research

Diagram illustrating T. Rowe Price's quantamental fixed income investment approach

As of July 2026.
For illustrative purposes only.
This is not to be construed to be investment advice or a recommendation to take any particular investment action. Investments involve risks, including possible loss of principal.
Source: T. Rowe Price.

 
The value of quantamental in fixed income markets

We believe our quantamental approach is particularly valuable in fixed income, where replicating bond indexes presents inherent challenges. Because bond indexes contain thousands of securities and evolve constantly as bonds mature and new issues come to market, passive replication inevitably results in some degree of tracking error.

Our quantamental approach seeks to turn that unavoidable tracking error into a modest amount of excess return. We do this by emphasizing structural tilts toward market segments—such as shorter-maturity corporate bonds and high-quality securitized credit—that have historically delivered more excess return per unit of volatility than other areas of the fixed income market. The aim is to build a yield advantage over the index, while maintaining benchmark-like risk.

To help moderate tracking error, we generally maintain neutral duration and yield curve exposures because active positioning in these has historically produced low Sharpe ratios. Importantly, our approach is designed to deliver these benefits in a cost-efficient manner.

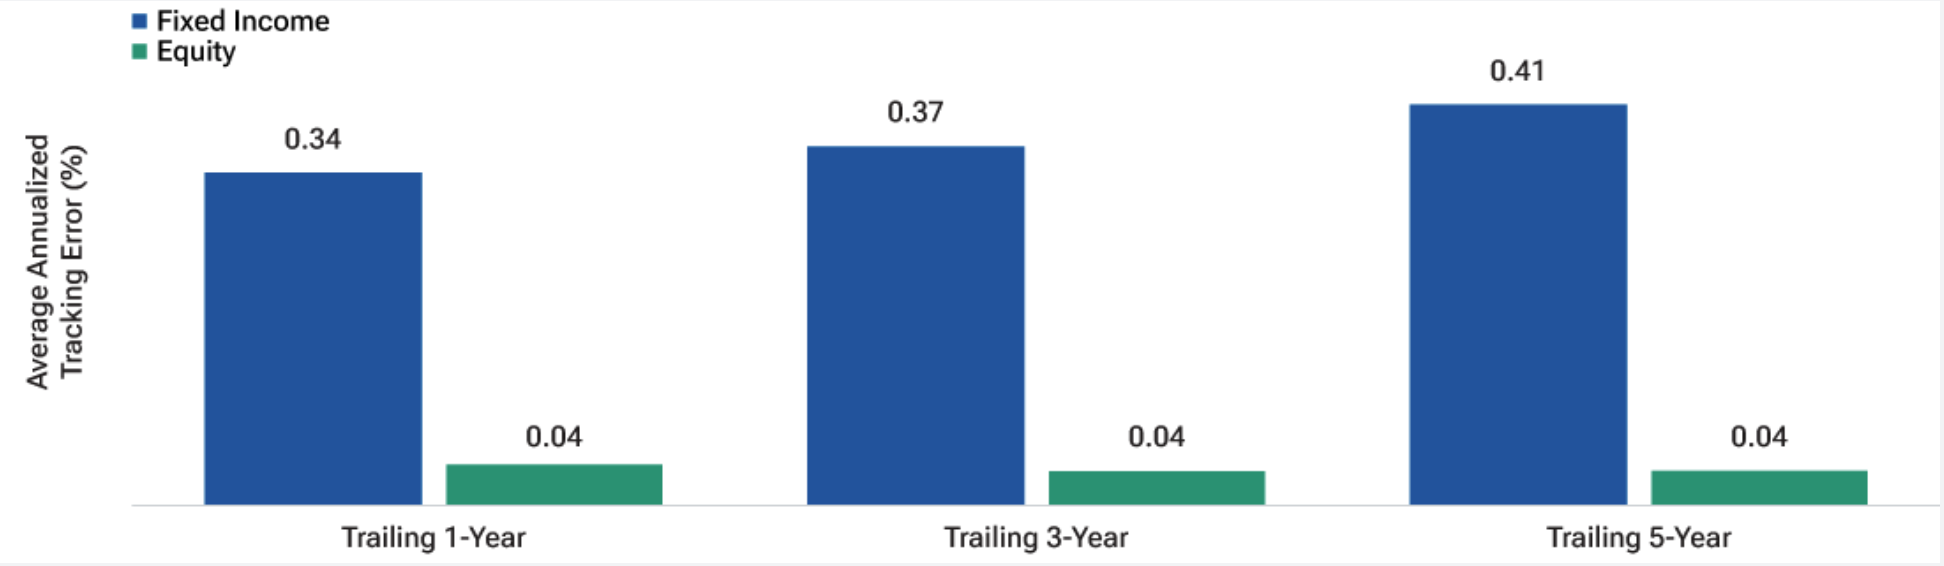
Tracking error is inevitable in fixed income
(Fig. 2) Average annualized tracking error for the five largest passive funds in fixed income and equity categories with the most passive assets

Chart comparing average annualized tracking error for large passive fixed income and equity funds

As of December 31, 2025.
Past performance is not a guarantee or a reliable indicator of future results.
We define a passive fund as one identified as an “index fund” in the Morningstar Direct database.
Tracking error calculations are relative to the prospectus benchmark for each passive fund.

As of December 31, 2025, Morningstar’s large blend category had the highest level of passive assets, amounting to about 51% of all passive equity assets. The five biggest large blend index funds by market capitalization made up 72% of passive assets in the category. Morningstar’s intermediate core bond category had the highest level of passive assets, amounting to about 37% of all passive fixed income assets. The five largest intermediate core bond index funds made up 89% of passive assets in the category.

Source: Morningstar. All data analysis by T. Rowe Price. See Additional Disclosures.

 
Why today’s environment may favor a quantamental approach

With rising inflation risks, elevated government deficits, and heightened geopolitical tensions, investors face an increasingly complex market environment. The combination of quantitative techniques with fundamental research can help identify opportunities, while simultaneously remaining responsive to changing market dynamics.

The conditions also reinforce the importance of core fixed income within a diversified portfolio, particularly given elevated equity valuations. With bond yields remaining well above the levels that prevailed through much of the post-global financial crisis era, core fixed income offers investors a compelling source of income. Combined with bonds’ historically lower volatility relative to equities, that income can help support portfolio diversification and resilience.

Fixed income markets are large, complex, and uniquely inefficient. We believe our quantamental approach—which blends elements of active and passive investing—is well suited to exploiting these characteristics. It combines quantitative techniques to identify market inefficiencies and construct a benchmark-aware portfolio with fundamental, bottom-up research to validate investment opportunities and manage risk. This is particularly important in credit markets where spreads remain historically tight and there is little room for error, underscoring the importance of security selection. Overall, we believe our approach provides an efficient framework for navigating bonds, while seeking modest excess returns, maintaining low tracking error and the cost advantages of index investing.


READ MORE FROM T. ROWE PRICE


1 Black-box trading is the use of automated computer models or algorithms to buy and sell securities.

Risks:

Fixed-income securities are subject to credit risk, liquidity risk, call risk, and interest-rate risk. As interest rates rise, bond prices generally fall. Relying on quantitative models entails the risk that the models themselves may be limited or incorrect, that the data the models rely on may be incorrect or incomplete, and that the adviser may not be successful in selecting securities for investment or determining the weighting of securities. Active investing may have higher costs than passive investing and may underperform the broad market or passive peers with similar objectives. Passive investing may lag the performance of actively managed peers as holdings are not reallocated based on changes in market conditions or outlooks on specific securities.

Additional Disclosures

For U.S. investors, visit troweprice.com/glossary for definitions of financial terms.

Please see vendor indices for more information, including definitions and source data: troweprice.com/marketdata.

Important Information

This material is provided for informational purposes only and is not intended to be investment advice or a recommendation to take any particular investment action.

The views contained herein are those of the authors as of July 2026 and are subject to change without notice; these views may differ from those of other T. Rowe Price associates.

This information is not intended to reflect a current or past recommendation concerning investments, investment strategies, or account types, advice of any kind, or a solicitation of an offer to buy or sell any securities or investment services. The opinions and commentary provided do not take into account the investment objectives or financial situation of any particular investor or class of investor. Please consider your own circumstances before making an investment decision.

Information contained herein is based upon sources we consider to be reliable; we do not, however, guarantee its accuracy. Actual future outcomes may differ materially from any estimates or forward-looking statements provided.

Past performance is not a guarantee or a reliable indicator of future results. All investments are subject to market risk, including the possible loss of principal. All charts and tables are shown for illustrative purposes only.

T. Rowe Price Investment Services, Inc., distributor. T. Rowe Price Associates, Inc., investment adviser. T. Rowe Price Investment Services, Inc., and T. Rowe Price Associates, Inc., are affiliated companies.

© 2026 T. Rowe Price. All Rights Reserved. T. ROWE PRICE, INVEST WITH CONFIDENCE, the Bighorn Sheep design, and related indicators (see troweprice.com/ip) are trademarks of T. Rowe Price Group, Inc. All other trademarks are the property of their respective owners. Use does not imply endorsement, sponsorship, or affiliation of T. Rowe Price with any of the trademark owners.

202607-5793575

Share this post

Sign Up Now for Full Access to Articles and Podcasts!

Unlock full access to our vast content library by registering as an institutional investor

Register

Contacts


T. Rowe Price

T. Rowe Price is a global asset management firm founded in 1937, with USD $1.8 trillion1 in assets under management and offices in 17 markets across four continents. Our investment philosophy is built on proprietary credit and equity research, disciplined risk management, and a collaborative, client-focused culture. We are dedicated to delivering investment excellence and tailored solutions for individuals, advisors, institutions, and retirement plan sponsors.

Since 1985, T. Rowe Price has managed insurance assets and currently oversees USD $35 billion1 in Insurance General Accounts for U.S. and international clients through T. Rowe Price and its subsidiaries.

Our deep fundamental expertise, combined with engaged and integrated relationship and investment management teams, enables us to provide insurance clients with thoughtful partnerships focused on compelling risk-adjusted outcomes. This highly interactive approach to client engagement is a key differentiator that reinforces T. Rowe Price’s service-oriented culture.

Ben Riley 
Head of Insurance 
benjamin.riley@troweprice.com
410-345-2223

Chase Uhlein, CFA
Senior Relationship Manager
chase.uhlein@troweprice.com
410-577-3077

Blayze Hanson, CFA
Senior Relationship Manager
blayze.hanson@troweprice.com

Taylor Davis 
Relationship Manager 
taylor.davis@troweprice.com
410-577-2054

1307 Point Street
Baltimore, MD 21231

 

View the contributor page

Image
trp_logo

Sign Up Now for Full Access to Articles and Podcasts!

Unlock full access to our vast content library by registering as an institutional investor .

Create an account

Already have an account ? Sign in

Ѐ Ё Ђ Ѓ Є Ѕ І Ї Ј Љ Њ Ћ Ќ Ѝ Ў Џ А Б В Г Д Е Ж З И Й К Л М Н О П Р С ΄ ΅ Ά · Έ Ή Ί Ό Ύ Ώ ΐ Α Β Γ Δ Ε Ζ Η Θ Ι Κ Λ Μ Ν Ξ Ο Π Ρ Ё Ђ Ѓ Є Ѕ І Ї Ј Љ Њ Ћ Ќ Ў Џ А Б В Г Д Е Ж З И Й К Л М Н О П Р С Т У Ф Х Ц Ч Ш Ā ā Ă ă Ą ą Ć ć Ĉ ĉ Ċ ċ Č č Ď ď Đ đ Ē ē Ĕ ĕ Ė fi fl œ æ ß