

Invesco -

U.S. Loan Market Snapshot – September 2026 Update

Downtown Chicago street lined with high-rise buildings at sunset.
Monthly US loan market update: September 2026

Loans returned 0.26% during the month, bringing year-to-date returns to 3.42%.1 The monthly return was comprised of 0.60% coupon income and -0.34% principal movements.1

In September, leveraged loans outperformed high yield by the widest margin since August 2022 as higher rates favored floating-rate assets.4 Despite strong loan issuance, fund inflows and resilient investor demand helped absorb new supply.4 However, the percentage of loans trading above par decreased from 42% at the end of August to 28% at the end of September, reflecting both refinancing activity and a more cautious market tone at the end of the month.2 Within loans, Bs (0.41%) led the way, followed by BBs (0.18%), while CCCs returned -1.70%.1 The average price in the loan market ended the month at 94.41, 23bps lower than the prior month’s average price of 94.64.1 At their current average price, senior secured loans provide a 9.62% yield inclusive of the forward curve.1

During the month, high yield returned -2.52%, underperforming loans, while investment grade returned -2.72%, also underperforming loans.3

Fundamentals
  • The Federal Reserve increased the federal funds rate by 25 basis points in September, citing persistent inflation and a stronger-than-expected economy. Treasury yields rose to multi-year highs as markets reassessed the outlook for inflation, economic growth, and monetary policy.
  • Geopolitical tensions in the Middle East intensified during September, contributing to higher oil prices and public market volatility. Escalating US-Iran tensions and concerns regarding the security of key energy transportation routes, including the Strait of Hormuz, supported a higher geopolitical risk premium in energy markets. Investors remained focused on the potential impact of further disruptions on energy costs, inflation, and broader economic activity.
  • The trailing 12-month par-weighted default rate declined to 0.55% from 0.87% in the month prior.2 The pocket of distress in the market (i.e., the percentage of performing loans trading below $80) increased to 7.05% versus 6.50% in the month prior.2 When aggregating out-of-court liability management exercises with payment defaults, the combined default rate by issuer count increased to 2.97% from 2.88% in the month prior.2
Technicals
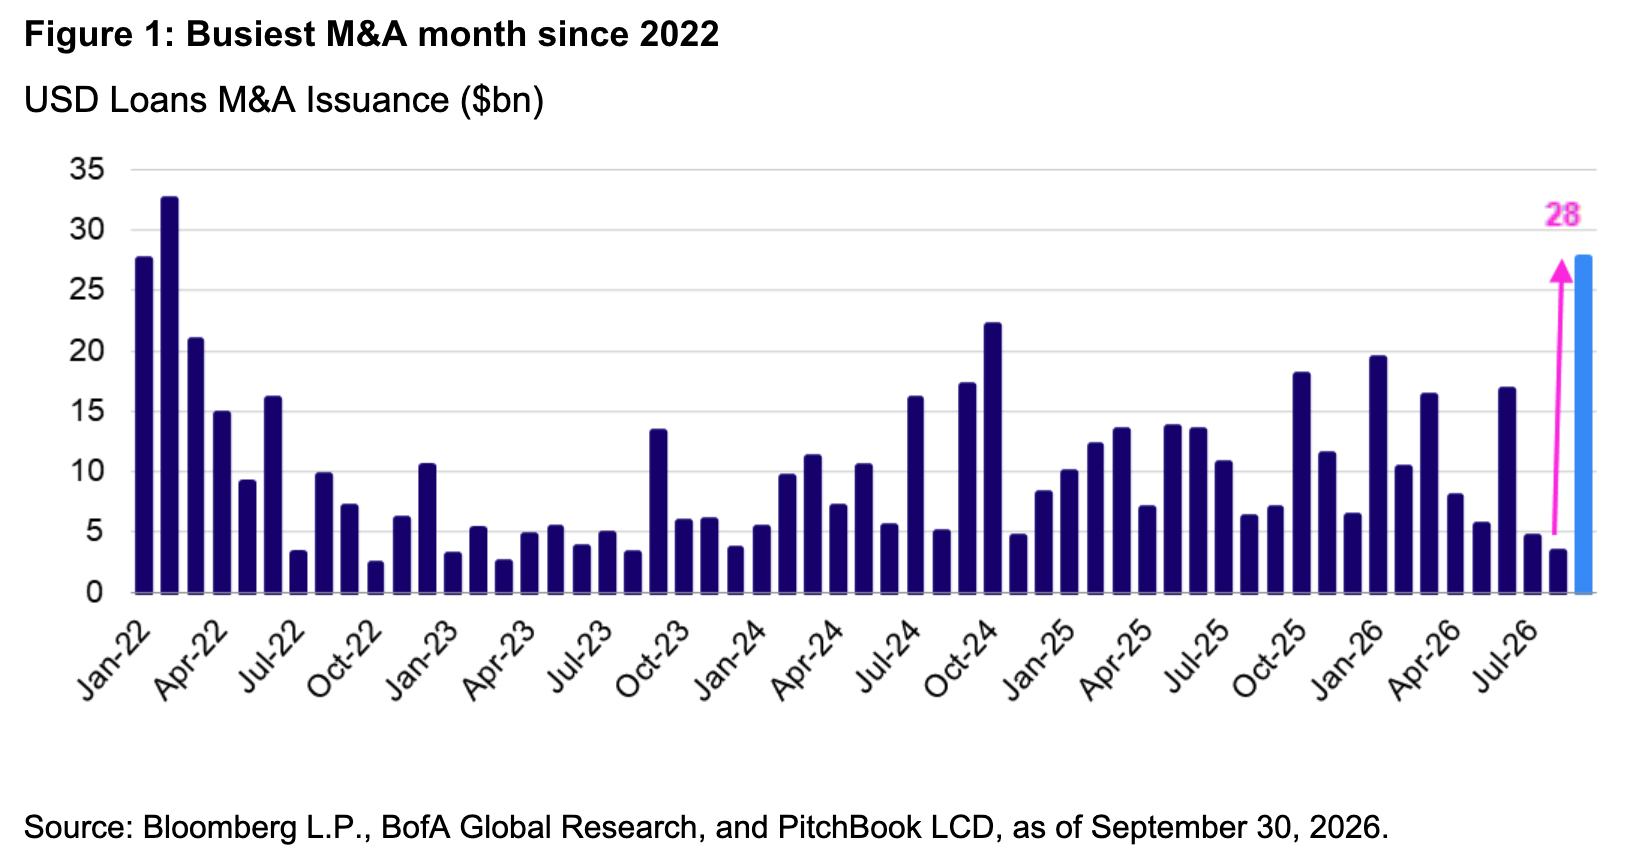
  • M&A financing activity accelerated in September, contributing to the strongest month for net new institutional loan issuance (excluding refinancing and repricing activity) since February 2022.4
  • CLO volume in September decreased 7% versus August, with gross issuance of $41.6bn across 91 deals, including $27.2bn of refinancings and resets, versus $44.6bn across 98 deals in the prior month. August ranked seventh in terms of average monthly volume and has averaged $19.5bn since 2012.4
  • Retail mutual funds and ETFs reported $4.7bn of inflows in the month, with ETFs recording inflows of $3.3bn and active managers experiencing inflows of $1.4bn.4 This compared to $2.7bn of inflows in August.
  • Loan primary activity increased 178% month-over-month in September.4 Volumes in September totaled $83.6bn versus $30.1bn in August. This compares to a historical September average of $43.8bn in volume since 2010.4 Issuance was comprised of $28.6bn of acquisition financing, $25.6bn of refinancing activity, $25.4bn of repricing activity, $2.8bn for dividend financing, and $1.0bn for general corporate purposes.4


Past performance is not a guarantee of future results.

This document is intended only for Professional Clients in Continental Europe only (as defined under important information); Dubai, Guernsey, Ireland, the Isle of Man, Jersey and the UK; in Hong Kong for Professional Investors, in Japan for Qualified Institutional Investors; in the Philippines for Qualified Buyers for informational purposes only; in Taiwan for certain specific Qualified Institutions and/or Sophisticated Investors; in Korea for Qualified Professional Investors; in Singapore for Institutional Investors, in New Zealand for wholesale investors (as defined in the Financial Markets Conduct Act), in Australia for Sophisticated or Professional Investors, in the USA for Institutional Investors, and in Israel for Qualified Clients/Sophisticated Investors. In Canada, this document is intended only for 1) accredited investors and ii) permitted clients as defined under National Instrument 45-106 and 31-103 respectively. In Chile, Panama and Peru, the document is for one-to-one institutional investors only. It is not intended for and should not be distributed to, or relied upon, by the public.


Market opportunity

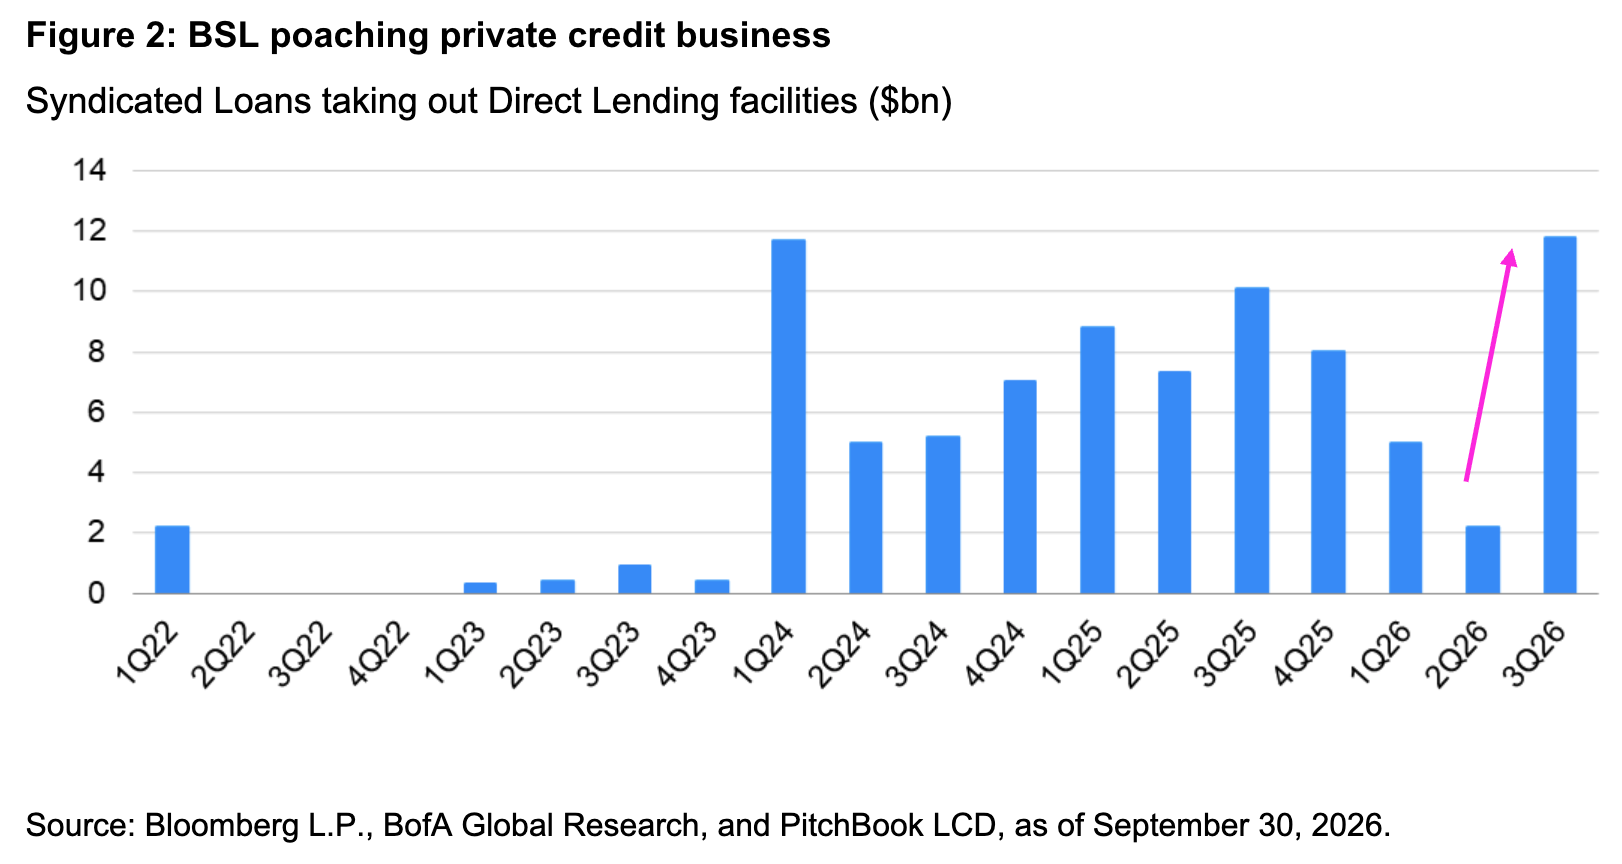
September recorded the busiest month for M&A-related loan issuance since 2022, while the syndicated loan market also continued to win share from the private credit market. As shown in Figure 1, acquisition financing activity accelerated sharply during the month. Figure 2 illustrates the growing volume of direct lending facilities being refinanced through the syndicated loan market. These trends may create attractive opportunities for fundamental credit selection as the investable universe expands.

Invesco chart showing U.S. dollar loan M&A issuance

Invesco chart showing syndicated loans taking out direct lending facilities


Relative yield
 $ PriceYield to worstSpreadDuration (years)
Bloomberg US Treasury Index89.485.13—5.47
Bloomberg US Aggregate Bond Index88.965.560.315.70
Bloomberg US Corporate Bond Index89.376.040.806.34
Bloomberg US Corporate High Yield Index93.828.353.133.10
S&P UBS Leveraged Loan Index94.419.623220.25
Morningstar LSTA US Leveraged Loan Index95.32N/A4810.25
Morningstar LSTA US Leveraged Loan 100 Index97.56N/A3700.25

Source: Barclays, S&P UBS, Morningstar, PitchBook Data, Inc., and Bloomberg L.P. as of September 30, 2026. Loan “yield to worst” incorporates the SOFR forward curve. Options adjusted spread provided for the Bloomberg US Aggregate and Corporate Bond Indices and spread to worst provided for loans and high yield.


READ MORE FROM INVESCO


1 S&P UBS Leveraged Loan Index as of September 30, 2026.

2 PitchBook Data, Inc. as of September 30, 2026.

3 Bloomberg as of September 30, 2026. High yield represented by Bloomberg US Corporate High Yield Index; investment grade represented by the Bloomberg US Corporate Bond Index.

4 JP Morgan as of September 30, 2026.

About risk

The value of investments and any income will fluctuate (this may partly be the result of exchange rate fluctuations) and investors may not get back the full amount invested.

Many senior loans are illiquid, meaning that the investors may not be able to sell them quickly at a fair price and/or that the redemptions may be delayed due to illiquidity of the senior loans. The market for illiquid securities is more volatile than the market for liquid securities. The market for senior loans could be disrupted in the event of an economic downturn or a substantial increase or decrease in interest rates. Senior loans, like most other debt obligations, are subject to the risk of default.

Important information

This document is intended only for Institutional Investors in the USA. It is not intended for and should not be distributed to, or relied upon, by the public.

All data provided by Invesco unless otherwise noted. All data is in US dollars and as of September 30, 2026, unless otherwise noted. By accepting this document, you consent to communicate with us in English, unless you inform us otherwise.

This document is written, unless otherwise stated, by Invesco professionals. The opinions expressed herein are based upon current market conditions and are subject to change without notice. This document does not form part of any prospectus. This document contains general information only and does not take into account individual objectives, taxation position or financial needs. Nor does this constitute a recommendation of the suitability of any investment strategy for a particular investor. Neither Invesco Ltd. nor any of its member companies guarantee the return of capital, distribution of income or the performance of any fund or strategy. Past performance is not a guide to future returns. This document is not an invitation to subscribe for shares in a fund nor is it to be construed as an offer to buy or sell any financial instruments.

As with all investments, there are associated inherent risks. This document is by way of information only. Asset management services are provided by Invesco in accordance with appropriate local legislation and regulations.

This document is marketing material and is not intended as a recommendation to invest in any particular asset class, security or strategy. Regulatory requirements that require impartiality of investment/investment strategy recommendations are therefore not applicable nor are any prohibitions to trade before publication. The information provided is for illustrative purposes only, it should not be relied upon as recommendations to buy or sell financial instruments.

This article is issued:

  • in the US by Invesco Senior Secured Management, Inc., 225 Liberty Street, New York, NY 10281.

BLMU-FLY-1-E | NA6044483

Share this post

Sign Up Now for Full Access to Articles and Podcasts!

Unlock full access to our vast content library by registering as an institutional investor

Register

Contacts


Image
Invesco_logo_blue_pos_rgb-NEW-2021.png

Invesco is a leading independent global investment management firm, dedicated to helping insurance investors achieve their financial objectives. We understand insurers have unique investment needs, from optimizing capital efficiency and yield, to managing reserves and reporting. That’s why we offer specialized solutions across a broad set of asset classes and vehicles. With $2.2 trillion in total assets under management,[1] and $95.6 billion on behalf of insurance clients,[2] we strive to understand your distinct capital requirements, accounting tax treatment, and risk factors.

Invesco Advisers, Inc. and Invesco Senior Secured Management, Inc. are investment advisers that provide investment advisory services to Institutional Investors and do not sell securities. Invesco Distributors, Inc. is the distributor for Invesco's retail products. Invesco Advisers, Inc., Invesco Senior Secured Management, Inc. and Invesco Distributors, Inc. are indirect wholly owned subsidiaries of Invesco Ltd.

1 Invesco Ltd. AUM of $2,169.9 billion as of Dec. 31, 2025
2 As of December 31, 2025


Invesco
1331 Spring Street NW, Suite 2500
Atlanta, GA 30309


View the contributor page

Sign Up Now for Full Access to Articles and Podcasts!

Unlock full access to our vast content library by registering as an institutional investor .

Create an account

Already have an account ? Sign in

Ѐ Ё Ђ Ѓ Є Ѕ І Ї Ј Љ Њ Ћ Ќ Ѝ Ў Џ А Б В Г Д Е Ж З И Й К Л М Н О П Р С ΄ ΅ Ά · Έ Ή Ί Ό Ύ Ώ ΐ Α Β Γ Δ Ε Ζ Η Θ Ι Κ Λ Μ Ν Ξ Ο Π Ρ Ё Ђ Ѓ Є Ѕ І Ї Ј Љ Њ Ћ Ќ Ў Џ А Б В Г Д Е Ж З И Й К Л М Н О П Р С Т У Ф Х Ц Ч Ш Ā ā Ă ă Ą ą Ć ć Ĉ ĉ Ċ ċ Č č Ď ď Đ đ Ē ē Ĕ ĕ Ė fi fl œ æ ß