


Pioneer Investments -

Agency Mortgage-Backed Securities (MBS) Market

PioneerFeatured

Tyler Patla -  Managing Director, Deputy Director of Core Fixed Income, Director of Agency Mortgages
Portfolio Manager


Agency MBS Modestly Widened in June Amid Hawkish Shift

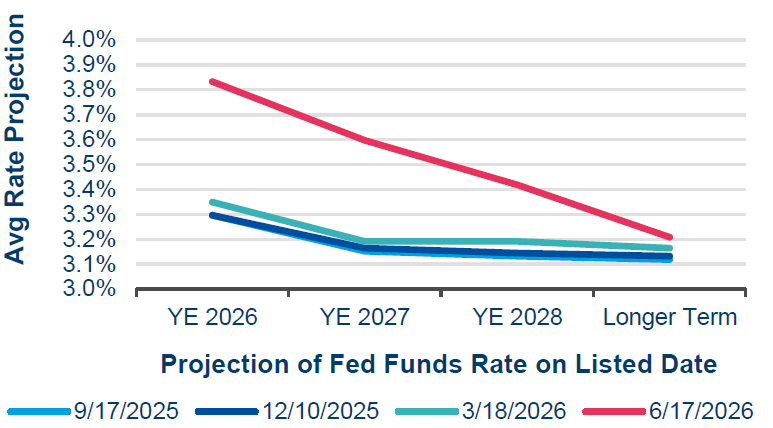
June was shaped by two pivotal developments: the signing of a US-Iran Memorandum of Understanding and the first Federal Reserve meeting under Chair Kevin Warsh, both of which  repriced geopolitical risk and the monetary policy outlook. The memorandum, which included a commitment to reopen the Strait of Hormuz, reversed the war premium built into oil prices and created a tailwind. On the Fed side, the committee held rates at 3.50–3.75% as expected, but Chair Warsh used his inaugural meeting to signal a decisive break from prior communication norms. His policy statement ran just 130 words, less than half of recent statements, with a blunt central message: "This committee will deliver price stability." The dot plot reinforced this hawkish shift: nine of eighteen participants projected higher rates by year-end, with the median 2026 dot rising to 3.875% and the 2027 median jumping 50 basis points to 3.625%. Notably, Warsh declined to submit his own projection, consistent with his preference that markets react to data rather than Fed guidance. 

Equities were mixed, with broader cyclical strength offset by weakness in mega-cap tech companies, which were weighed down by Alphabet’s issuance, SpaceX’s IPO, and concerns over AI capital expenditure sustainability. In fixed income, the Treasury yield curve bore the brunt of the repricing by bear-flattening: 2-year yields rose 15 bps to 4.15%, while 10-year yields were essentially unchanged at 4.44%.

In an environment of tightening monetary policy expectations, it’s not surprising that agency MBS underperformed relative to other risk and spread assets. The Bloomberg US MBS Index returned 0.22% on the month, reflecting a -0.07% excess return to Treasuries as sector option-adjusted spread (OAS) widened by 2bp to +24bp. Performance was weaker in lower coupons than in higher coupons, with some investors not incorporating a flattening yield curve into model dynamics.
 

Dot Plot Shifted Higher in June
Image
Chart showing decrease in average rate projection over a long term

Source: Federal Reserve, Pioneer Investments, as of June 30, 2026
 

Outlook: Technicals Shift Toward Neutral, while Fundamentals Improve

Consistent with prior months, we still believe agency MBS spreads will remain range-bound, with movement within the range influenced by exogenous headlines and short-term dynamics. This regime held again in June, as agency MBS spreads moved with high correlation to broader risk sentiment, implied rate volatility, and Fed expectations. The passthrough to MBS spreads with implicit guardrails is a function of balanced valuations, technicals, and fundamentals, with the medium-term outlook for these dynamics shifting.
 

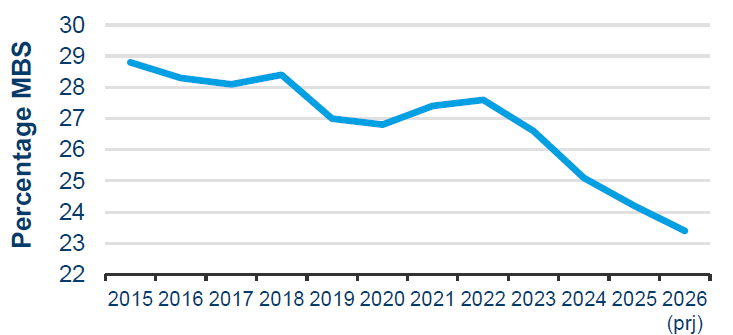
MBS Weight in Bloomberg US Aggregate Index
Image
Line graph showing decrease in percentage MBS over the past decade

Source: Bloomberg, Pioneer Investments, as of June 30, 2026
 

Valuations: Mortgage OAS to Treasuries remained toward the tight end of their 5-year and 10-year ranges, though the Bloomberg US Corporate Index looks similarly tight compared to its respective spread history, with significant geopolitical and supply-chain risks that could impact the sector more than MBS. Mortgage relative outperformance YTD relative to corporate bonds has influenced some asset managers to reduce their overweight to MBS to participate in record levels of corporate bond issuance, particularly as the weight of MBS in fixed income indices has declined. Meanwhile, thanks to negative swap spreads, OAS to swaps is at 65bp, above its average over the past decade, and many potential marginal buyers of MBS tend to hedge with swaps. 
 

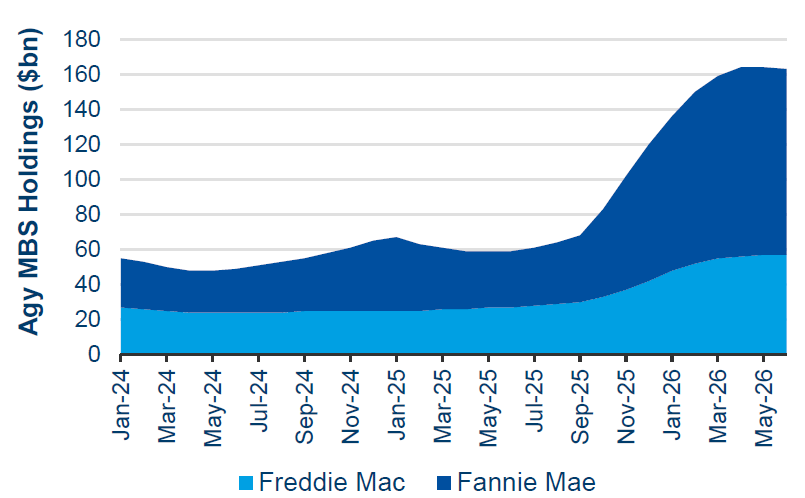
Agency Portfolios Have Plateaued
Image
Graph showing that agency portfolios have plateaued

Source: Fannie Mae, Freddie Mac, Pioneer Investments, as of June 30, 2026
 

Technicals: The updated Basel III Endgame proposal could inspire banks to make up for a lack of purchases in recent years, but while current carry relative to interest on reserve balances (IORB) is at recent highs, a flatter yield curve generates forward curves, which project banks’ net interest margin on MBS to contract amid more hawkish Fed expectations. Similarly, while currency-hedged carry for overseas investors is relatively strong, it is not projected to rise more if forward expectations are realized. Fannie Mae and Freddie Mac added MBS aggressively in Q1 as directed by the Trump administration, but have curiously stopped growing their portfolios in the past few months, with no official communication whether we should expect purchases to resume to meet 2026 demand targets. Mortgage Real Estate Investment Trusts (mREITs) have traded above book value and are positioned with relatively low leverage, which may facilitate further MBS purchases. 
 

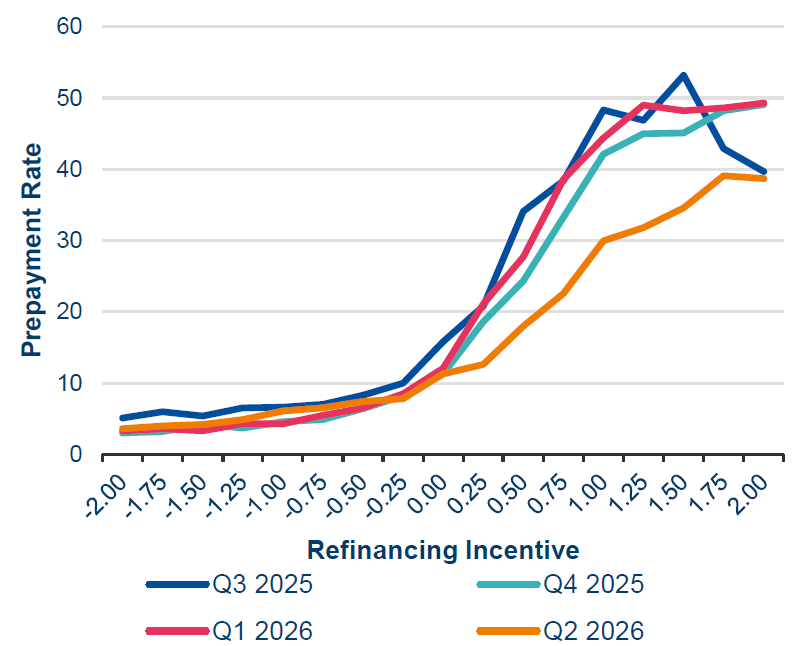
Prepayment Speeds Slowed in Q2
Image
Line graph showing that prepayment speeds slowed in Q2

Source: Riskspan, Pioneer Investments, as of June 30, 2026
 

Fundamentals: AI advancements and isolated prepayment data suggest more efficient refinancing the next time mortgage rates fall, with the potential for streamline refinancing in conventional loans that could meaningfully accelerate cheapest-to-deliver prepayments. However, current data continues to support more benign prepayment outlooks, with any spike in recent years short-lived and explainable by loan closing timeline adjustments. As illustrated in the graph to the right, prepayments have slowed significantly over the past quarter as media focus on mortgage rates has waned, suggesting many borrowers may be less reactive to a potential sustained drop in rates. Additionally, faster prepayments increase the potential for security selection opportunities, as do potential dislocations from changing government policies.

The balanced considerations above and price-sensitivity of marginal investors has influenced us to trade around in modest size as headlines moved markets. Broadly, the willingness of asset managers to sell at tighter spreads, with banks, overseas investors, mREITs, and agencies willing to buy at wider spreads, can provide both the resistance and support to maintain the range as macro factors oscillate. While net issuance of MBS is quite low, demand from banks, overseas investors, and the agencies could weaken or disappear in 2027, reducing (but not extinguishing) our optimism over a longer timeline. Dedicated MBS portfolios are positioned more closely to the index than the long-term average, but we view agency MBS more favorably as a positive contributor to aggregate, multi-sector, or multi-asset portfolios. We prefer MBS relative to swaps rather than to Treasuries, particularly because current marginal sources of demand hedge this way. Additionally, we are optimistic that prepayment uncertainty and headline-induced dislocations may provide dynamic allocation and security selection opportunities.


Read More from Pioneer Investments


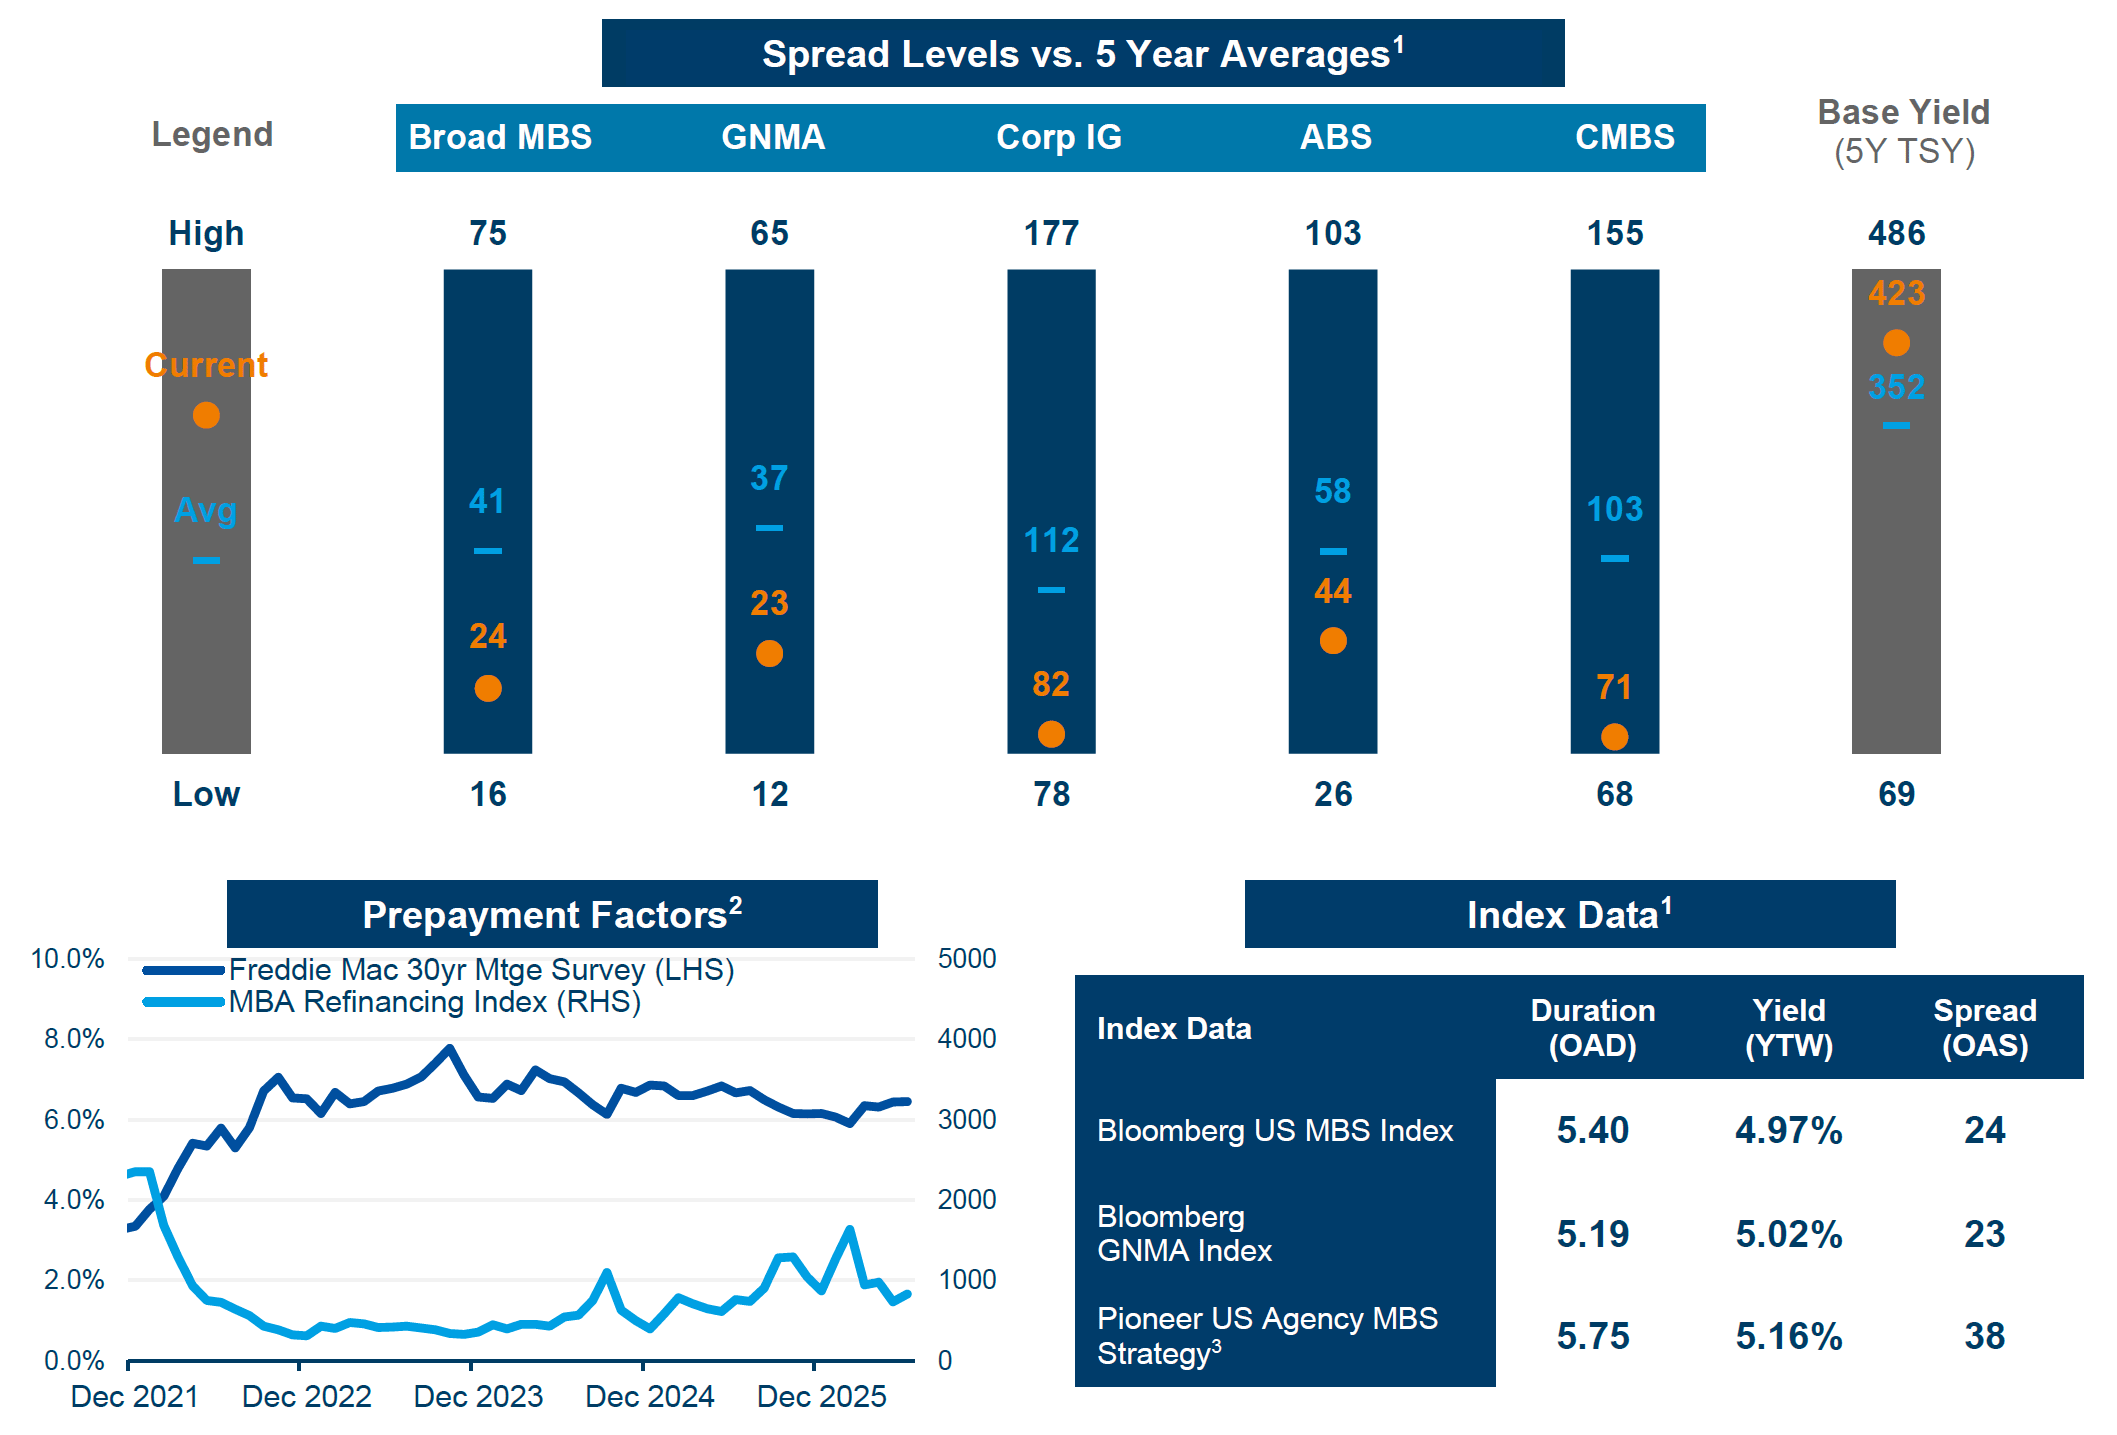
Securitized Market Dashboard

Image
Various graphs

Source: Bloomberg, as of June 30, 2026
1 Index Data: Bloomberg US MBS Index, Bloomberg GNMA Index, Bloomberg US Aggregate Corporate Average OAS, Bloomberg US Investment Grade ABS Index, Bloomberg US Investment Grade CMBS Index. 
2 S&P/Experian First Mortgage Default Index, MBA Refinance Index. 
3 The characteristics are of the representative account (gross, USD) in the US Agency MBS composite. Gross-of-fees returns are presented before management and custodial fees but after any transaction costs.

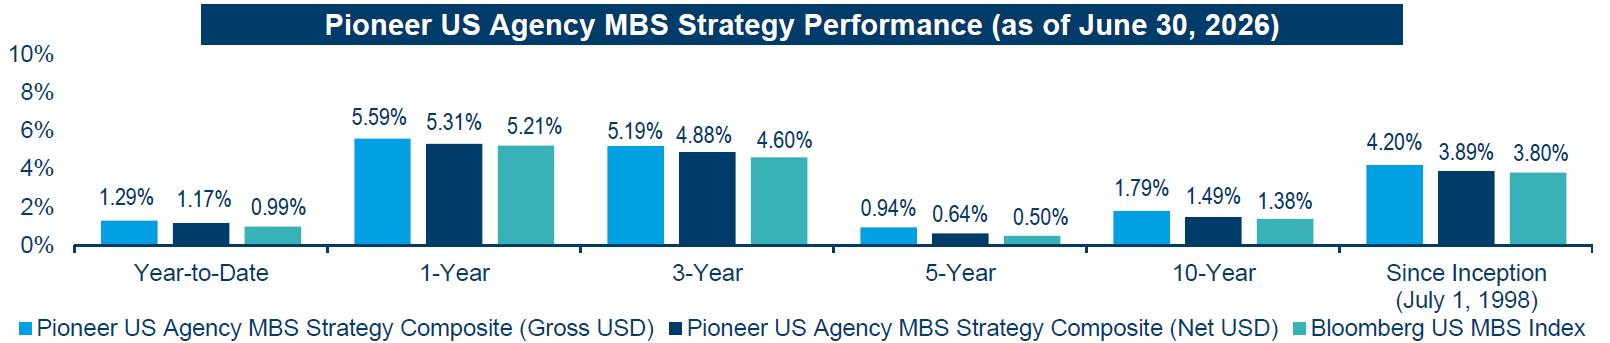
Image
Pioneed US Agency MBS Strategy Performance

Source: Pioneer Investments, as of June 30, 2026
Performance prior to April 1, 2025, occurred while the portfolio management team was affiliated with a prior firm. Such members of the portfolio management team were responsible for investment decisions at the prior firm and the decision-making process has remained intact. 
Returns greater than one year are annualized. Returns are expressed in US dollars and reflect the reinvestment of dividends and other earnings.
Gross-of-fees returns are presented before management and custodial fees but after any transaction costs. The composite net-of-fees returns reflect net of model fees and are calculated in the same manner as gross of fee returns using the Time Weighted Rate of Return method. Actual fees may vary depending on, among other things, the applicable fee schedule and portfolio size.
Please refer to the GIPS® Report for additional information.
Past performance is no guarantee of future results.

All investing involves risk, including the possible loss of principal. An investment should be made with an understanding of the risks involved with owning a particular security or asset class.

Unless otherwise stated, all information contained in this document is from Pioneer Investments, a Victory Capital® Investment Franchise. The views expressed in this presentation are those of Pioneer Investments as of the date noted, and are subject to change at any time. These views should not be relied upon as investment advice, as securities recommendations, or as an indication of trading intent on behalf of any of portfolio. 

The services and any securities described in this document may not be registered for sale with the relevant authority in your jurisdiction and may not be regulated or supervised by any governmental or similar authority in your jurisdiction. Where unregistered, they may not be sold or offered except in the circumstances permitted by law. Pioneer Investments is not making any representation nor does this document constitute a representation with respect to (i) the eligibility of any recipients of this document to acquire any securities or any services described herein in any jurisdiction or (ii) the eligibility of any recipients of this document to receive this document in any jurisdiction. If you are in doubt about the content of this document or your eligibility, you should obtain independent professional advice.

Each portfolio is actively managed. Sector allocations are subject to change. Holdings are subject to change and should not be construed as investment advice or a recommendation to buy, sell, or hold any security. Information relating to portfolio holdings is based on the representative account in the composite and may vary for other accounts in the strategy due to asset size, client guidelines and other factors.

Indexes are unmanaged; their returns include reinvestment of dividends and other income but do not reflect management fees, transaction costs or expenses. It is not possible to invest directly in an index. Past performance does not guarantee future results.

Advisory Services offered by Victory Capital Management Inc.

©2026 Victory Capital Management Inc.


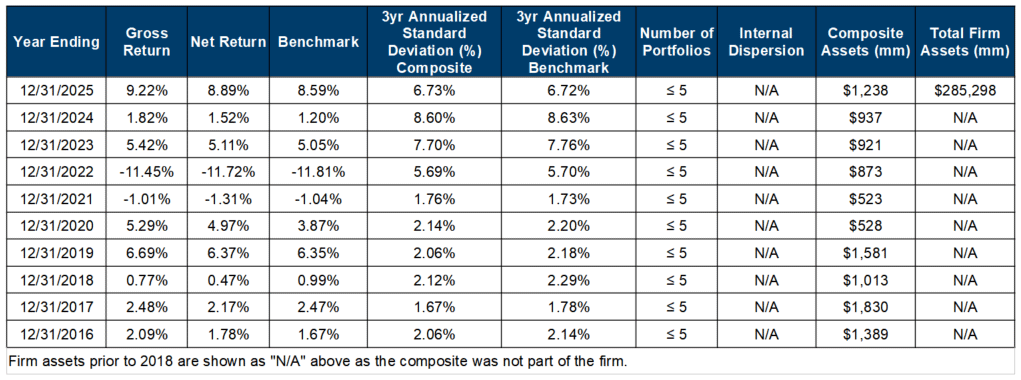
Pioneer US Agency MBS Strategy

Composite Performance
Image
Table showing composite performance

    1. Victory Capital Management Inc. claims compliance with the Global Investment Performance Standards (GIPS®) and has prepared and presented this report in compliance with the GIPS standards. Victory Capital Management Inc. has been independently verified for the periods January 1,2001 through December 31, 2025. The verification report is available upon request. A firm that claims compliance with the GIPS standards must establish policies and procedures for complying with all the applicable requirements of the GIPS standards.  Verification provides assurance on whether the firm's policies and procedures related to composite and pooled fund maintenance, as well as the calculation, presentation, and distribution of performance, have been designed in compliance with the GIPS standards and have been implemented on a firm-wide basis. Verification does not provide assurance on the accuracy of any specific performance report.
   2. Victory Capital Management Inc. (VCM) is a diversified global investment adviser registered under the Investment Advisers Act of 1940 and comprises multiple investment franchises: Integrity Asset Management, New Energy Capital Partners, Pioneer Investments, RS Investments, Sycamore Capital, Trivalent Investments, Victory Income Investors, and the Victory Capital Solutions Platform. RS Investments and Sophus Capital became a part of the VCM GIPS firm effective January 1, 2017; Victory Income Investors, effective July 1, 2019; THB Asset Management, effective March 1, 2021; New Energy Capital effective November 1, 2021; and Amundi Asset Management US, Inc. (renamed to “Pioneer Investments”), effective April 1, 2025. Effective July 1, 2025, Newbridge Asset Management, Sophus Capital and THB Asset Management are no longer part of the GIPS firm. Effective December 1, 2025, Munder Capital Management is no longer part of the GIPS firm. 
   3. The Pioneer US Agency MBS Strategy seeks to produce returns in excess of the index by actively managing a portfolio consisting primarily of agency mortgage-backed securities. The composite creation date is June 1998, and the composite inception date is July 1, 1998. The benchmark of the composite is the Bloomberg US MBS Index. 
    4. The benchmark of the composite is the Bloomberg US MBS Index. The Bloomberg US MBS Index tracks fixed-rate, agency mortgage-backed pass-through securities guaranteed by Ginnie Mae, Fannie Mae, and Freddie Mac (FHLMC), making it a key benchmark for this segment of the U.S. bond market. It groups securities into generic pools by program, coupon, and vintage, focusing on investment-grade bonds with at least $1 billion outstanding and a weighted average maturity over one year, providing broad exposure to government-backed MBS. The benchmark returns are provided to represent the investment environment existing during the time periods shown and are not covered by the report of independent verifiers. For comparison purposes, the index is fully invested, which includes the reinvestment of income. The returns have been taken from a published source and do not include any transaction fees, management fees, or other costs.
   5. The internal dispersion of annual returns is measured by the standard deviation of asset-weighted gross returns of accounts included in the composite for the full year. If less than six portfolios are included in the composite for the full year, no dispersion measure is presented, as it is not considered meaningful (N/M). The three-year annualized ex-post standard deviation measures the variability of the composite’s gross returns, and the benchmark returns over the preceding 36-month period. It is not required to be presented for annual periods when a full three years of composite performance is not yet available.
   6. Composite and benchmark returns are presented net of non-reclaimable withholding taxes. Gross-of-fees returns are presented before management and custodial fees but after all transaction costs. Net-of-fees returns are calculated by deducting 1/12 of the highest tier of the standard fee schedule in effect for the period noted (the model fee). The composite model fee for each period is either the highest tier of the current fee schedule or a higher value, whichever is required to ensure the model composite net-of-fee return is lower than or equal to the composite net-of-fee return calculated using actual fees. Actual fees may vary depending on, among other things, the applicable fee schedule and portfolio size. The complete fee schedule for this product is:

Image
Table correlating Market Value and Annual Fee

   7. Valuations and returns are stated in U.S. dollars. Past performance should not be considered indicative of future performance. Composite returns reflect the reinvestment of dividends and other earnings. A list of broad distribution pooled funds, composite and limited distribution pooled fund descriptions and policies of valuing investments, calculating performance, and preparing GIPS Reports are available upon request. Registration with the SEC does not imply a certain level of skill or training.
   8. The composite is managed by Pioneer Investments (formerly Amundi Asset Management US, Inc. Performance prior to April 2025 occurred while the team was affiliated with a prior firm. Such members of the portfolio management team were responsible for investment decisions at the prior firm, and the decision-making process has remained intact. The historical performance has been linked to performance earned at Victory Capital Management Inc.
   9. GIPS® is a registered trademark of CFA Institute. CFA Institute does not endorse or promote this organization, nor does it warrant the accuracy or quality of the content contained herein.
 

20260721-5768327

Share this post

Sign Up Now for Full Access to Articles and Podcasts!

Unlock full access to our vast content library by registering as an institutional investor

Register

Contacts


Image
Pioneer Stacked Logo FL


Pioneer Investments manages $147 billion in assets and has a long-standing history of innovation with deep expertise managing fixed income portfolios and creating customized solutions within the more opportunistic areas of the securitized market.

Pioneer Investments’ culture of innovation, in the securitized market, originated at Smith Breeden, where its founders developed early option-adjusted spread modeling techniques for MBS valuation. The innovative approach continues under Victory Capital, which manages over $10.7 billion for insurance companies. We are focused on delivering competitive risk-adjusted returns, while considering the accounting, regulatory, and capital management needs of our insurance clients to create long-term partnerships.  We understand the unique needs of insurers, and we provide customized and efficient risk-based capital solutions that align with insurers' risk tolerances and investment objectives.

Source: *Pioneer Investments, a Victory Capital Investment Franchise, as of June 30, 2026
 

Jay Alexander, CFA, CAIA
Managing Director, Institutional Markets
jalexander@vcm.com
+1 (612) 965-5426

 
Emma White
Director, Institutional Markets
ewhite@vcm.com
+1 (617) 422-4569

Marko Komarynsky
Director, Institutional Markets
mkomarynsky@vcm.com
+1 (210) 697-3613
 

View the contributor page

Sign Up Now for Full Access to Articles and Podcasts!

Unlock full access to our vast content library by registering as an institutional investor .

Create an account

Already have an account ? Sign in

Ѐ Ё Ђ Ѓ Є Ѕ І Ї Ј Љ Њ Ћ Ќ Ѝ Ў Џ А Б В Г Д Е Ж З И Й К Л М Н О П Р С ΄ ΅ Ά · Έ Ή Ί Ό Ύ Ώ ΐ Α Β Γ Δ Ε Ζ Η Θ Ι Κ Λ Μ Ν Ξ Ο Π Ρ Ё Ђ Ѓ Є Ѕ І Ї Ј Љ Њ Ћ Ќ Ў Џ А Б В Г Д Е Ж З И Й К Л М Н О П Р С Т У Ф Х Ц Ч Ш Ā ā Ă ă Ą ą Ć ć Ĉ ĉ Ċ ċ Č č Ď ď Đ đ Ē ē Ĕ ĕ Ė fi fl œ æ ß