

Pioneer Investments -

Agency Mortgage-Backed Securities (MBS) Market

IAUM_Article_Banner_Pioneer-MBS-Nov26_1004x422

Tyler Patla
Managing Director, Deputy Director of Core Fixed Income, Director of Agency Mortgages
Portfolio Manager


Agency MBS Bore the Brunt of September’s Selloff

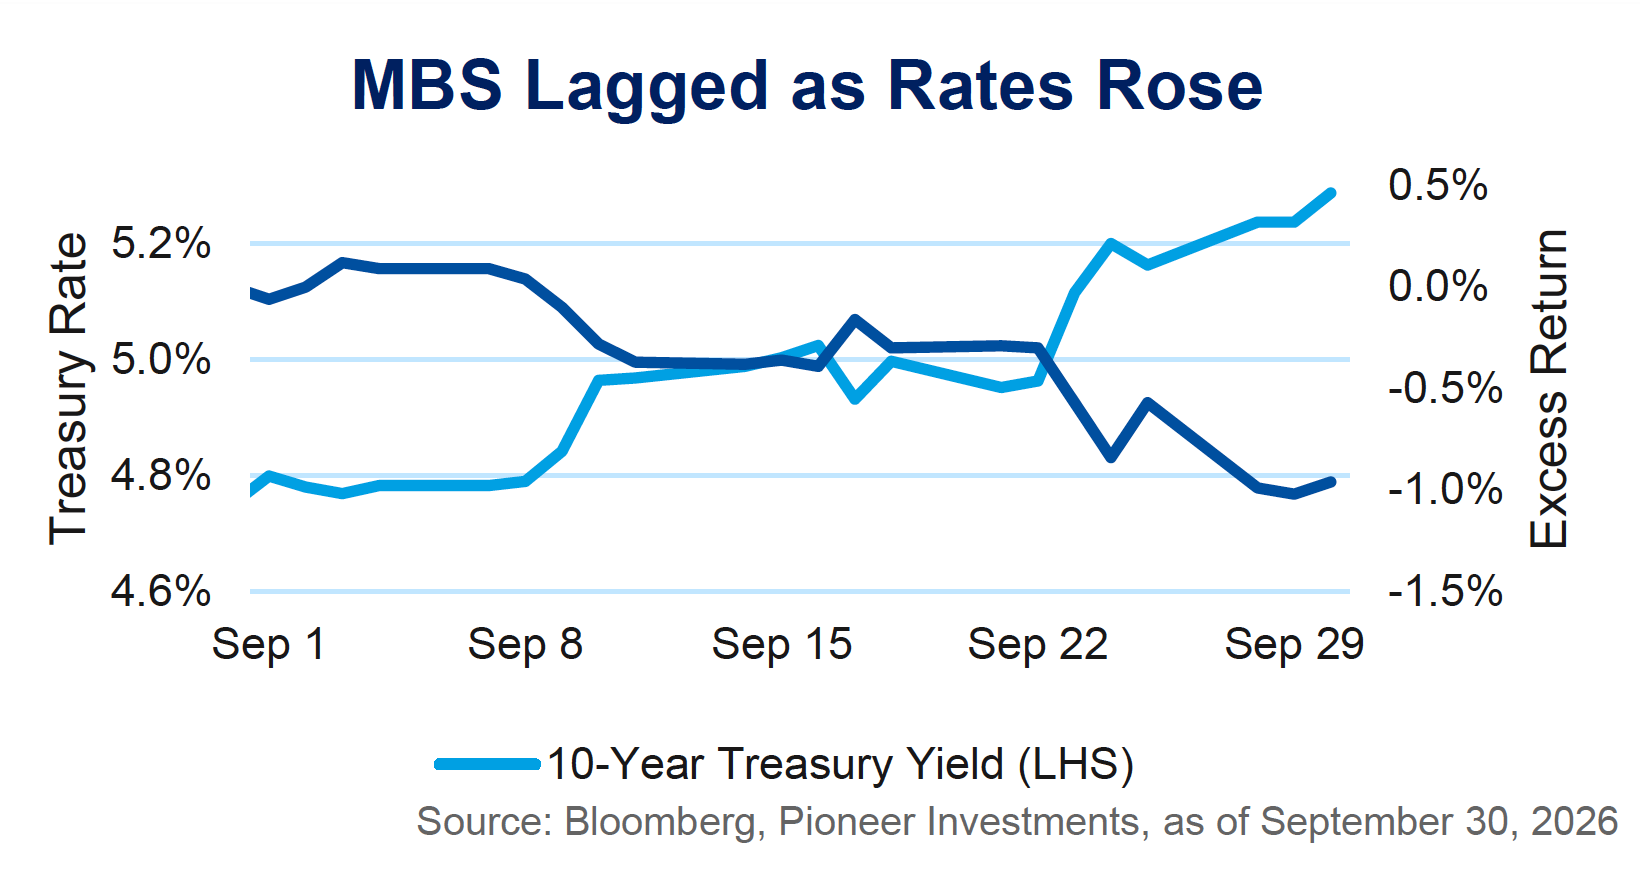
US Treasury yields rose sharply in September as strong economic data and a hawkish Federal Reserve pushed markets to price a higher path for policy rates. The August jobs report showed non-farm payrolls rising by 162,000, well above expectations, and a firmer-than-expected 0.25% gain in core Consumer Price Index (CPI) all but guaranteed a rate hike at the September 16 Federal Open Market Committee (FOMC) meeting. The Committee unanimously raised the federal funds target range by 25bp to 3.75%–4.00%, but the accompanying message was more hawkish than the hike itself, with 16 of 18 participants projecting at least one additional hike before year-end. Fed Chair Warsh reinforced that signal, saying the hike merely “removed a dose of accommodation.” The selloff was almost entirely a real-yield story, with the 10-year Treasury-inflation protected securities (TIPS) yield accounting for 48bp of the 53bp rise in the 10-year Treasury yield and closing at its highest level since 2008. By month-end, interest rate futures were pointing to roughly 90bp of additional Fed hikes over the next year.

Chart comparing 10-year Treasury yields and agency MBS excess returns during the September 2026 market selloff.

Source: Bloomberg, Pioneer Investments, as of September 30, 2026.

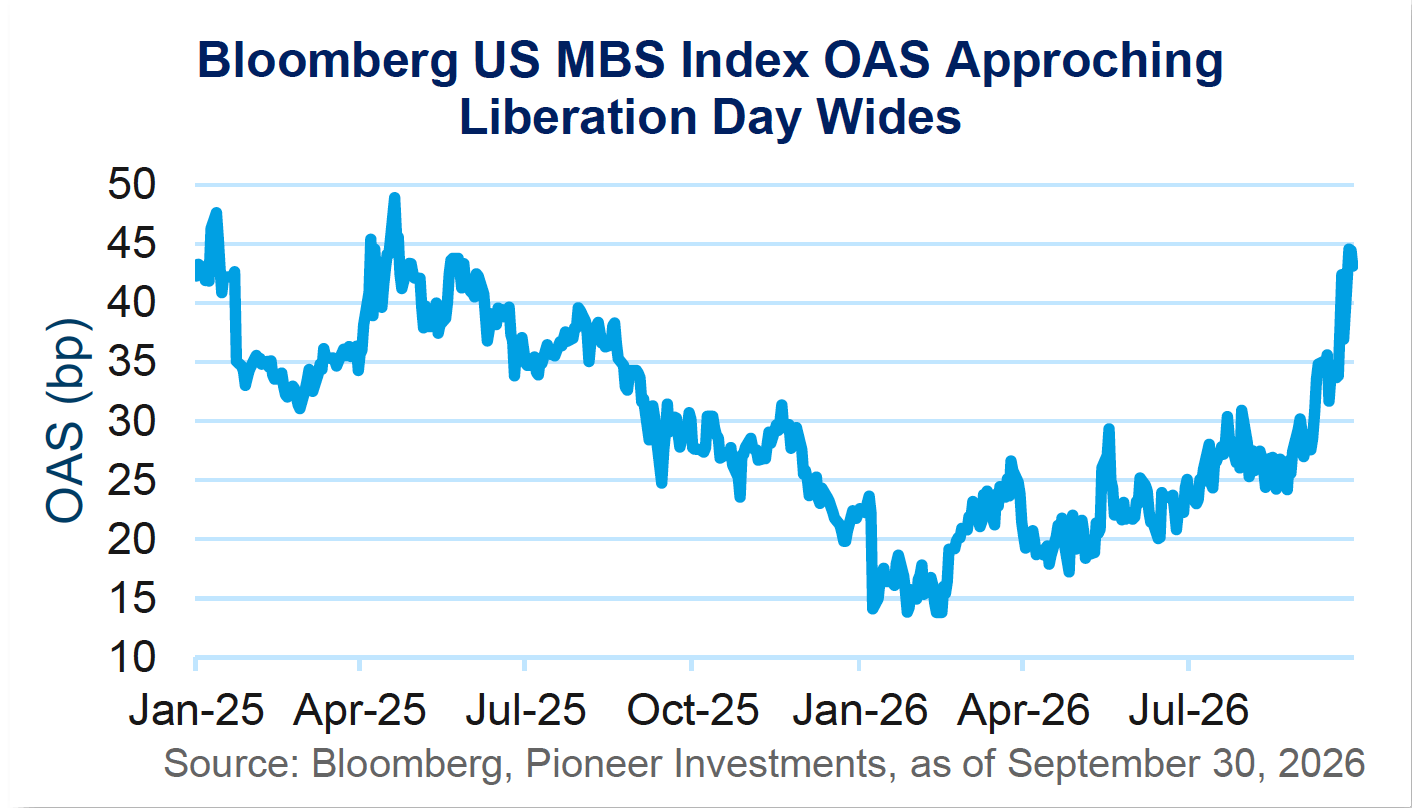
Agency MBS bore the brunt of the selloff within fixed income. As rising rates slowed expected prepayments and extended mortgage durations, hedging-related selling compounded the move higher in yields, and the ICE BofA MOVE Index of implied rate volatility jumped from 75 to 110. The Bloomberg US MBS Index returned -3.38% on the month, reflecting a -0.96% excess return to Treasuries as sector option-adjusted spread (OAS) widened by 14bp to +43bp, its widest level since the April 2025 tariff announcements. After two months breaking from the historical relationship between curve and MBS that we described in July, September’s near-parallel bear move produced the widening that history would suggest, albeit at roughly four times the average magnitude. Higher coupons drove most of the underperformance, as most selling came from active extension hedgers like dealers, hedge funds, and mortgage real estate investment trusts (mREITs), while relative value adders like asset managers bought across the curve. MBS significantly lagged investment-grade corporate bonds, as the Bloomberg US Corporate Index essentially matched the return of duration-matched Treasuries.

New Developments in Credit Scoring

For three decades, mortgage lenders relied on a single credit score, Classic FICO, to underwrite and price loans, and MBS investors have long paid extra for pools of lower-scoring borrowers, who tend to refinance more slowly when rates fall. Over the past several months, a pilot program has been progressing using an alternative VantageScore 4.0, a newer model that incorporates trended credit data and typically scores borrowers higher, which has skewed about 20 points higher on average relative to FICO. In October, Federal Housing Finance Agency Director Bill Pulte announced that Fannie Mae and Freddie Mac will charge the same upfront fees on purchase loans whether lenders use Classic FICO or VantageScore 4.0, after previously noting that a separate matrix would be used. Many borrowers will therefore qualify for lower fees, saving an estimated 5bp in mortgage rate on average, a modest affordability benefit that nonetheless dilutes the prepayment protection of lower-score pools. If borrowers continue to be given the option to retrieve two credit scores and submit the one that qualifies for a lower fee, agency revenue will fall, or the fee schedule will eventually have to be raised, benefiting borrowers with disparate credit score relative to those with consistent scores across providers.

Separately, beginning October 19, the agencies will disclose their own internal credit scores on newly issued MBS. Early analysis suggests these scores can distinguish prepayment and default risk more effectively among borrowers with similar FICO scores, potentially creating new security selection opportunities.

Outlook: Value Restored, Technicals Still Conflicting

After several months of range-bound trading, September’s widening pushed agency MBS spreads well through the wide end of their range. While we appreciate greater risk compensation for the asset class, we remain cautious: if the macro forces behind September’s underperformance continue, including a more hawkish projected Fed path, rising term premia, and rising rate volatility, we would not be surprised to see further underperformance. The passthrough from macro headlines to MBS spreads has remained a function of valuations, technicals, and fundamentals, and while valuations have shifted meaningfully in favor of the sector, technicals may not yet immediately follow.

Valuations: Mortgage OAS to Treasuries is above its median of the past 5 and 10 years, which looks particularly attractive when spreads on the Bloomberg US Corporate Index are still in their tightest quintile over the same period. Primarily thanks to September’s dislocation, mortgages now trail corporates by 1.23% in excess return YTD, even as investors have digested record corporate bond issuance, while a slow housing market has flattened mortgage net issuance. Meanwhile, thanks to negative swap spreads, OAS to swaps widened by 16bp to 83bp, which is 30bp above its average over the past decade, and many potential buyers of MBS tend to hedge with swaps.

Bloomberg US MBS Index option-adjusted spread approaching the wide levels seen around Liberation Day in April 2025.

Source: Bloomberg, Pioneer Investments, as of September 30, 2026.

Technicals: Regulators are reportedly preparing to finalize the revised Basel III capital rules in December, which could allow banks to make up for a lack of purchases in recent years. However, while current carry relative to interest on reserve balances (IORB) remains near recent highs, a more hawkish projected Fed path has lowered forward projections of banks’ net interest margin on MBS. Similarly, while currency-hedged carry for overseas investors is relatively strong, higher projected Fed funds rates increase projected hedging costs. After Fannie Mae and Freddie Mac curiously stopped growing their portfolios for several months, FHFA Director Pulte stated on September 18 that the agencies are “beginning to buy even more, large quantities” of MBS, though the announcement did little to stem September’s widening. We have yet to see these purchases in lagged monthly published data, and agency purchases have been curiously absent from market-maker commentary. mREITs entered the month trading above book value with relatively low leverage, but based on our estimates tuned to historical data, September’s widening and rate volatility likely eroded book values, which may temper their near-term capacity for further purchases.

Fundamentals: AI advancements and isolated prepayment data have continued to suggest more efficient refinancing the next time mortgage rates fall, with the potential for streamline refinancing in conventional loans that could meaningfully accelerate cheapest-to-deliver prepayments. However, that risk has moved even further away: the 30-year mortgage rate closed the month at over 7.3%, its highest level since November 2023, and only about 1% of the MBS universe now has a meaningful refinancing incentive. With prepayment risk remote, extension is the more relevant near-term consideration, as slower expected speeds lengthen durations and fuel the hedging-related selling described above. If faster speeds do eventually arise, security selection potential increases, as do potential dislocations from changing government policies.

Improved valuations and the dislocation from other spread assets inspired us to add agency MBS exposure in dedicated and multi-sector portfolios. September demonstrated that macro forces, hedging needs, and indiscriminate derisking can overwhelm support from real money and relative value investors in the short run, but current spreads offer more compensation for that risk than they have in over a year. That said, we remain agile and retain room to increase our allocation in case more active hedging or forced selling drives MBS another leg wider.

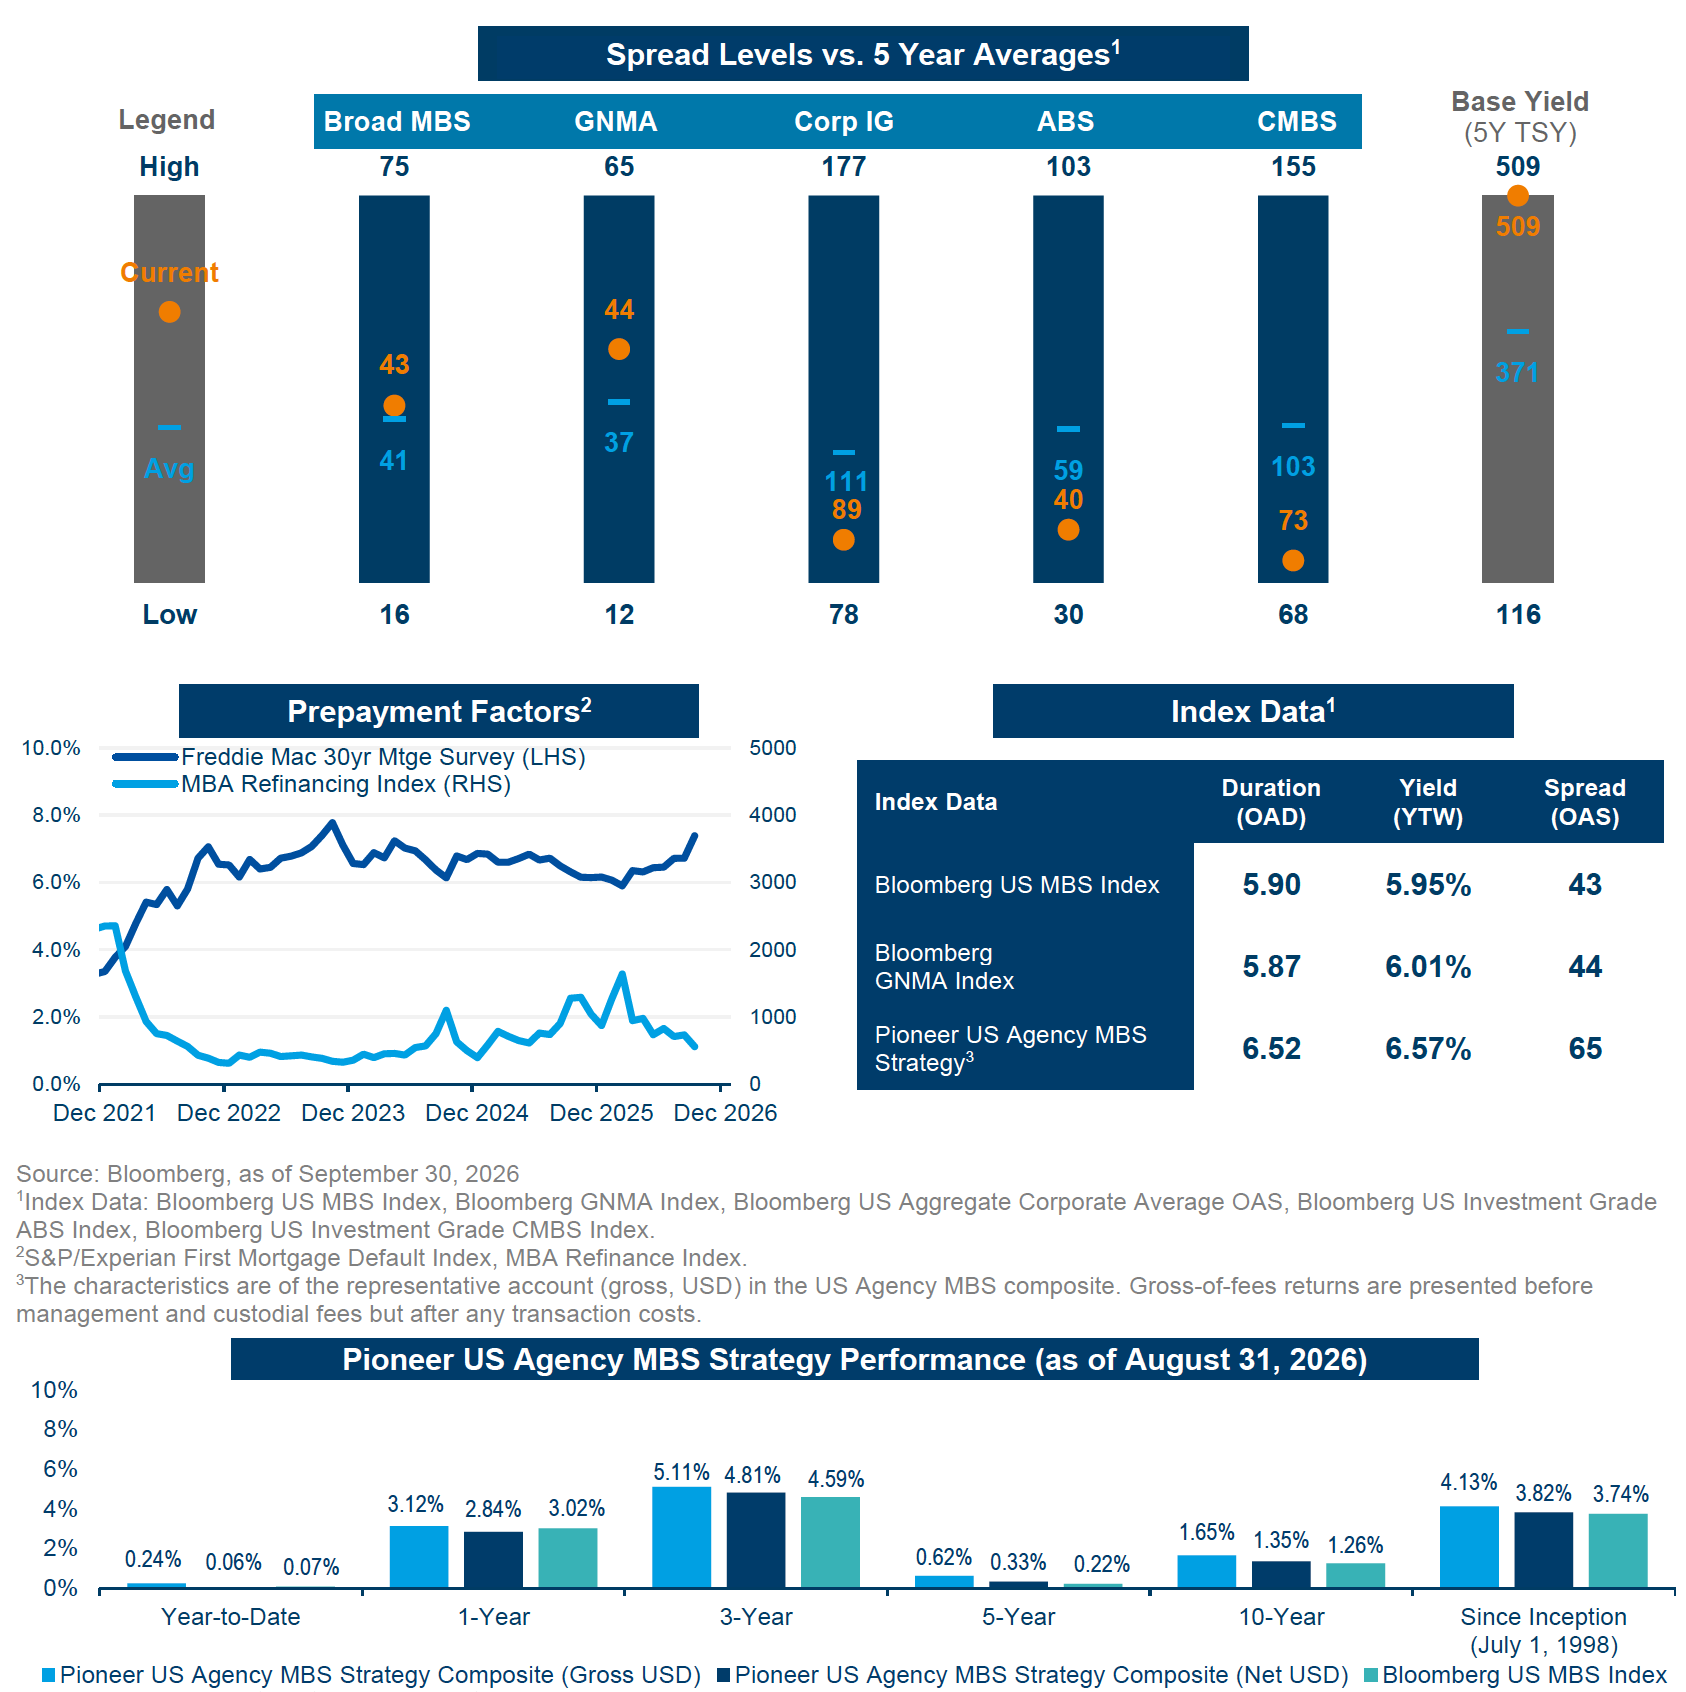
Securitized Market Dashboard

Pioneer Investments securitized market dashboard with spread comparisons, prepayment factors, index data and August 2026 agency MBS strategy performance.


Pioneer US Agency MBS Strategy Performance (as of August 31, 2026)

Source: Pioneer Investments, as of August 31, 2026.

Performance prior to April 1, 2025, occurred while the portfolio management team was affiliated with a prior firm. Such members of the portfolio management team were responsible for investment decisions at the prior firm and the decision-making process has remained intact.

Returns greater than one year are annualized. Returns are expressed in US dollars and reflect the reinvestment of dividends and other earnings. Gross-of-fees returns are presented before management and custodial fees but after any transaction costs. The composite net-of-fees returns reflect net of model fees and are calculated in the same manner as gross of fee returns using the Time Weighted Rate of Return method. Actual fees may vary depending on, among other things, the applicable fee schedule and portfolio size.

Please refer to the GIPS® Report for additional information.

Past performance is no guarantee of future results.

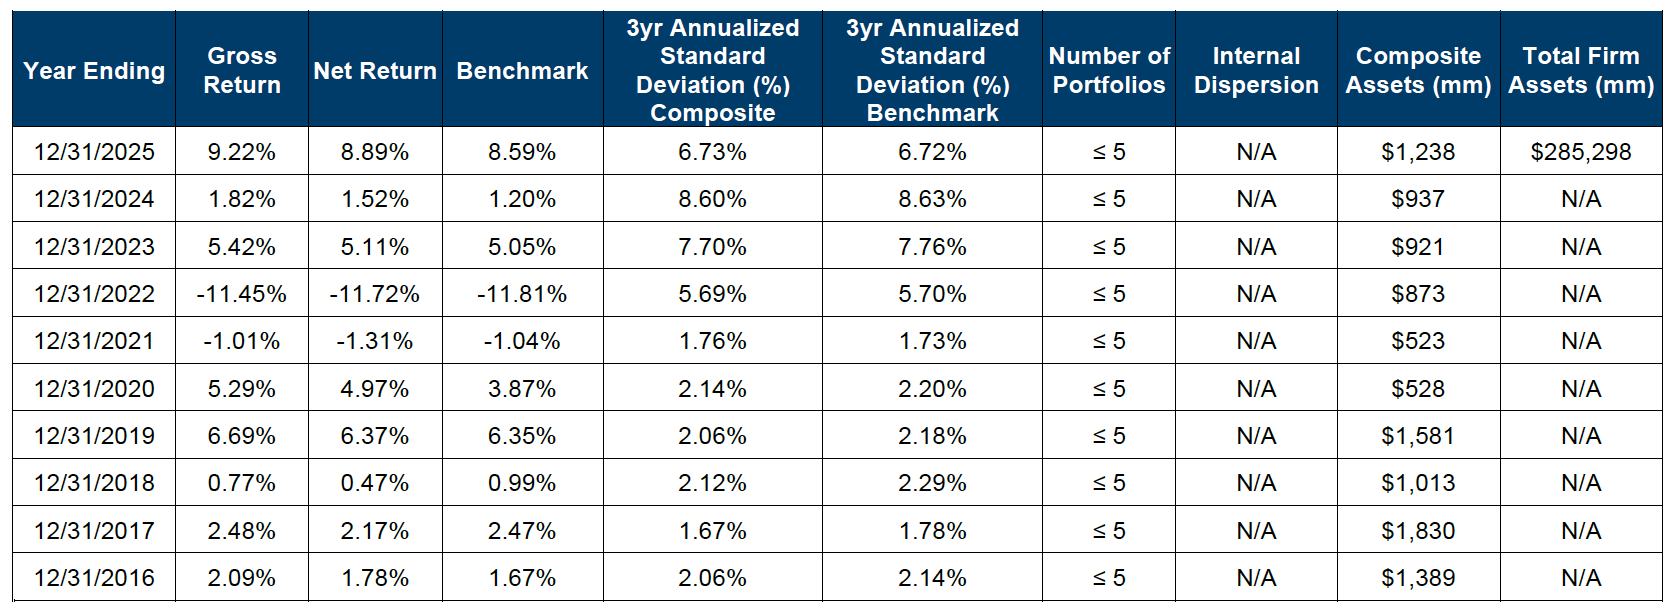
Pioneer US Agency MBS Strategy Composite Performance

Pioneer US Agency MBS Strategy composite performance table showing annual gross returns, net returns, benchmark returns, standard deviation and composite assets.

Firm assets prior to 2018 are shown as "N/A" above as the composite was not part of the firm.


READ MORE FROM PIONEER INVESTMENTS


Disclosures

All investing involves risk, including the possible loss of principal. An investment should be made with an understanding of the risks involved with owning a particular security or asset class.

Unless otherwise stated, all information contained in this document is from Pioneer Investments, a Victory Capital ® Investment Franchise. The views expressed in this presentation are those of Pioneer Investments as of the date noted, and are subject to change at any time. These views should not be relied upon as investment advice, as securities recommendations, or as an indication of trading intent on behalf of any of portfolio.

The services and any securities described in this document may not be registered for sale with the relevant authority in your jurisdiction and may not be regulated or supervised by any governmental or similar authority in your jurisdiction. Where unregistered, they may not be sold or offered except in the circumstances permitted by law. Pioneer Investments is not making any representation nor does this document constitute a representation with respect to (i) the eligibility of any recipients of this document to acquire any securities or any services described herein in any jurisdiction or (ii) the eligibility of any recipients of this document to receive this document in any jurisdiction. If you are in doubt about the content of this document or your eligibility, you should obtain independent professional advice.

Sector allocations are subject to change. Holdings are subject to change and should not be construed as investment advice or a recommendation to buy, sell, or hold any security. Information relating to portfolio holdings is based on the representative account in the composite and may vary for other accounts in the strategy due to asset size, client guidelines and other factors.

Indexes are unmanaged; their returns include reinvestment of dividends and other income but do not reflect management fees, transaction costs or expenses. It is not possible to invest directly in an index. Past performance does not guarantee future results.

Advisory Services offered by Victory Capital Management Inc.

©2026 Victory Capital Management Inc.

GIPS® Composite Notes

1. Victory Capital Management Inc. claims compliance with the Global Investment Performance Standards (GIPS®) and has prepared and presented this report in compliance with the GIPS standards. Victory Capital Management Inc. has been independently verified for the periods January 1,2001 through December 31, 2025. The verification report is available upon request. A firm that claims compliance with the GIPS standards must establish policies and procedures for complying with all the applicable requirements of the GIPS standards. Verification provides assurance on whether the firm's policies and procedures related to composite and pooled fund maintenance, as well as the calculation, presentation, and distribution of performance, have been designed in compliance with the GIPS standards and have been implemented on a firm-wide basis. Verification does not provide assurance on the accuracy of any specific performance report.

2. Victory Capital Management Inc. (VCM) is a diversified global investment adviser registered under the Investment Advisers Act of 1940 and comprises multiple investment franchises: Integrity Asset Management, New Energy Capital Partners, Pioneer Investments, RS Investments, Sycamore Capital, Trivalent Investments, Victory Income Investors, WestEnd Advisors and the Victory Capital Solutions Platform. RS Investments and Sophus Capital became a part of the VCM GIPS firm effective January 1, 2017; Victory Income Investors, effective July 1, 2019; THB Asset Management, effective March 1, 2021; New Energy Capital effective November 1, 2021; Amundi Asset Management US, Inc. (renamed to “Pioneer Investments”), effective April 1, 2025; and WestEnd Advisors, effective September 30, 2026. Effective July 1, 2025, Newbridge Asset Management, Sophus Capital, and THB Asset Management are no longer part of the GIPS firm. Effective December 1, 2025, Munder Capital Management is no longer part of the GIPS firm.

3. The Pioneer US Agency MBS Strategy seeks to produce returns in excess of the index by actively managing a portfolio consisting primarily of agency mortgage-backed securities. The composite creation date is June 1998, and the composite inception date is July 1, 1998. The benchmark of the composite is the Bloomberg US MBS Index.

4. The benchmark of the composite is the Bloomberg US MBS Index. The Bloomberg US MBS Index tracks fixed-rate, agency mortgage-backed pass-through securities guaranteed by Ginnie Mae, Fannie Mae, and Freddie Mac (FHLMC), making it a key benchmark for this segment of the U.S. bond market. It groups securities into generic pools by program, coupon, and vintage, focusing on investment-grade bonds with at least $1 billion outstanding and a weighted average maturity over one year, providing broad exposure to government-backed MBS. The benchmark returns are provided to represent the investment environment existing during the time periods shown and are not covered by the report of independent verifiers. For comparison purposes, the index is fully invested, which includes the reinvestment of income. The returns have been taken from a published source and do not include any transaction fees, management fees, or other costs.

5. The internal dispersion of annual returns is measured by the standard deviation of asset-weighted gross returns of accounts included in the composite for the full year. If less than six portfolios are included in the composite for the full year, no dispersion measure is presented, as it is not considered meaningful (N/M). The three-year annualized ex-post standard deviation measures the variability of the composite’s gross returns, and the benchmark returns over the preceding 36-month period. It is not required to be presented for annual periods when a full three years of composite performance is not yet available.

6. Composite and benchmark returns are presented net of non-reclaimable withholding taxes. Gross-of-fees returns are presented before management and custodial fees but after all transaction costs. Net-of-fees returns are calculated by deducting 1/12 of the highest tier of the standard fee schedule in effect for the period noted (the model fee). The composite model fee for each period is either the highest tier of the current fee schedule or a higher value, whichever is required to ensure the model composite net-of-fee return is lower than or equal to the composite net-of-fee return calculated using actual fees. Actual fees may vary depending on, among other things, the applicable fee schedule and portfolio size. The complete fee schedule for this product is:

Market ValueAnnual Fee
First $50,000,0000.25%
Next $50,000,0000.225%
Next $100,000,0000.20%
Above $200,000,0000.15%

7. Valuations and returns are stated in U.S. dollars. Past performance should not be considered indicative of future performance. Composite returns reflect the reinvestment of dividends and other earnings. A list of broad distribution pooled funds, composite and limited distribution pooled fund descriptions and policies of valuing investments, calculating performance, and preparing GIPS Reports are available upon request. Registration with the SEC does not imply a certain level of skill or training.

8. The composite is managed by Pioneer Investments (formerly Amundi Asset Management US, Inc. Performance prior to April 2025 occurred while the team was affiliated with a prior firm. Such members of the portfolio management team were responsible for investment decisions at the prior firm, and the decision-making process has remained intact. The historical performance has been linked to performance earned at Victory Capital Management Inc.

9. GIPS® is a registered trademark of CFA Institute. CFA Institute does not endorse or promote this organization, nor does it warrant the accuracy or quality of the content contained herein.

20261012-6009567

Share this post

Sign Up Now for Full Access to Articles and Podcasts!

Unlock full access to our vast content library by registering as an institutional investor

Register

Contacts


Image
Pioneer Stacked Logo FL


Pioneer Investments manages $160 billion in assets and has a long-standing history of innovation with deep expertise managing fixed income portfolios and creating customized solutions within the more opportunistic areas of the securitized market.

Pioneer Investments’ culture of innovation, in the securitized market, originated at Smith Breeden, where its founders developed early option-adjusted spread modeling techniques for MBS valuation. The innovative approach continues under Victory Capital, which manages over $10.8 billion for insurance companies. We are focused on delivering competitive risk-adjusted returns, while considering the accounting, regulatory, and capital management needs of our insurance clients to create long-term partnerships.  We understand the unique needs of insurers, and we provide customized and efficient risk-based capital solutions that align with insurers' risk tolerances and investment objectives.

Source: *Pioneer Investments, a Victory Capital Investment Franchise, as of September 30, 2026
 

Jay Alexander, CFA, CAIA
Managing Director, Institutional Markets
jalexander@vcm.com
+1 (612) 965-5426

 
Emma White
Director, Institutional Markets
ewhite@vcm.com
+1 (617) 422-4569

Marko Komarynsky
Director, Institutional Markets
mkomarynsky@vcm.com
+1 (210) 697-3613
 

View the contributor page

Sign Up Now for Full Access to Articles and Podcasts!

Unlock full access to our vast content library by registering as an institutional investor .

Create an account

Already have an account ? Sign in

Ѐ Ё Ђ Ѓ Є Ѕ І Ї Ј Љ Њ Ћ Ќ Ѝ Ў Џ А Б В Г Д Е Ж З И Й К Л М Н О П Р С ΄ ΅ Ά · Έ Ή Ί Ό Ύ Ώ ΐ Α Β Γ Δ Ε Ζ Η Θ Ι Κ Λ Μ Ν Ξ Ο Π Ρ Ё Ђ Ѓ Є Ѕ І Ї Ј Љ Њ Ћ Ќ Ў Џ А Б В Г Д Е Ж З И Й К Л М Н О П Р С Т У Ф Х Ц Ч Ш Ā ā Ă ă Ą ą Ć ć Ĉ ĉ Ċ ċ Č č Ď ď Đ đ Ē ē Ĕ ĕ Ė fi fl œ æ ß