

Pioneer Investments -

Agency Mortgage-Backed Securities (MBS) Market Commentary and Outlook

Pioneer Investments graphic showing a rising housing market line over a house icon.

Tyler Patla
Senior Vice President, Deputy Director of Core Fixed Income, Director of Agency Mortgages
Portfolio Manager


As of May 31, 2026

Agency MBS Outperformed Modestly in May, Lagging Risk-On Tone

The improvement in risk sentiment that began in mid-April extended through May, as easing oil prices and a resilient US economy set a constructive tone for financial markets. Risk assets capitalized on the improving backdrop, with equities reaching new record highs and corporate bonds tightening on the strength of first-quarter corporate earnings and renewed enthusiasm for AI-related capital expenditure. Despite a decline in oil prices, Treasury yields moved higher as inflation concerns remained elevated. April headline CPI, released mid-month, accelerated to +0.6% month-over-month, with core CPI rising +0.4%.

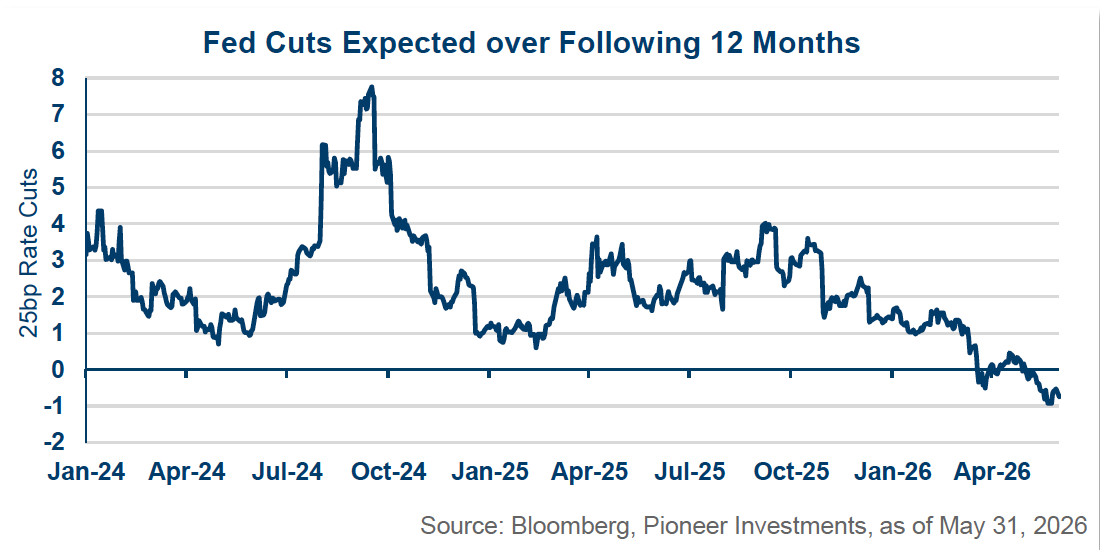
The upside inflation surprise validated the Federal Reserve’s hawkish concerns, and the pivot toward restraint extended even to traditionally dovish Committee members. Governor Christopher Waller stated that ‘a rate cut is no more likely in the future than a rate increase,’ a striking turn from an official who had championed cuts just a few months ago. With renewed inflation fears and a Federal Open Market Committee signaling a more balanced and less dovish outlook, the market expectation for Fed Funds moves in the next year has moved from cuts to neutral to a hike, as illustrated in the graph below. This has demand implications for investors that project the yield and carry advantages of MBS over sovereign alternatives that we investigate later in this piece.

Fed cuts expected over following 12 months chart.

Despite intramonth volatility, agency MBS closed the month close to where it started, underperforming the risk-on sentiment in corporate bonds. The Bloomberg US MBS Index returned 0.30% on the month, reflecting a +0.13% excess return to Treasuries despite sector option-adjusted spread (OAS) widening by 2bp to +22bp. Performance was slightly stronger in lower coupons than in recent production, with a flattening yield curve benefitting longer assets by more than implied by cash flow models.

Potential Streamline Refi for Fannie and Freddie?

In mid-May, HousingWire reported that the Consumer Financial Protection Bureau is considering rule changes that could allow streamline refinancing for conventional loans wrapped by Fannie Mae and Freddie Mac more akin to the process currently only available to Veterans Affairs (VA) borrowers. The change would reduce the documentation burden required to reconfirm ability-to-repay when processing a loan refinancing. In theory, originators could mail “sign here” offers to borrowers to execute a mortgage recasting and rate reduction. If VA refinancing rates are any indication, this could significantly increase borrowers’ prepayment speeds, particularly if borrowers are allowed to roll in the fixed costs of refinancing into the loan. Such behaviour would increase option costs that could flow through to primary mortgage rates.

Currently, this is merely a consideration, could include a 36-month seasoning requirement that far exceeds VA’s 7-month requirement, and could include a more onerous net tangible benefit clause. We will remain vigilant on this topic, and it reinforces our preference for security selection in higher coupons as the cheapest-to-deliver cohort has continually deteriorated in recent years.

Fannie Mae Slowed Purchases, but Continued to Build Portfolio in April

In late May, Fannie Mae published its updated portfolio as of April’s month-end. Fannie Mae net added $5.5 billion of Agency MBS in April, which was less than a third of March’s $18 billion addition, the largest monthly increase since the global financial crisis. As of April month-end, Fannie Mae’s retained portfolio stood at $175 billion, showing $41 billion MBS added YTD. Each agency can still add about $5 billion per month through the end of 2026 to reach their respective caps, with current signs pointing to the program not being extended and caps expanded into 2027.

Outlook: Slightly-Deteriorating Dynamics, Driven by Exogenous Factors

Consistent with prior months, we still believe agency MBS spreads will remain range-bound, with movement within the range influenced by exogenous headlines and short term dynamics. This regime held again in May, as agency MBS spreads moved with high correlation to broader risk sentiment, implied rate volatility, and Fed expectations, all of which were driven by the Iranian conflict, the ensuing oil price shock, and oscillating optimism for a resolution. The passthrough to MBS spreads with implicit guardrails is a function of balanced valuations, technicals, and fundamentals, though the medium-term outlook for these dynamics has modestly weakened:

Valuations: Mortgage OASs to Treasuries remained toward the tight end of their 5-year and 10-year ranges, though the Bloomberg US Corporate Index looks similarly tight compared to its respective spread history, with significant geopolitical and supply-chain risks that could impact the sector more than MBS. Meanwhile, thanks to negative swap spreads, OAS to swaps is at 62bp, above its average over the past decade, and many potential marginal buyers tend to hedge with swaps.

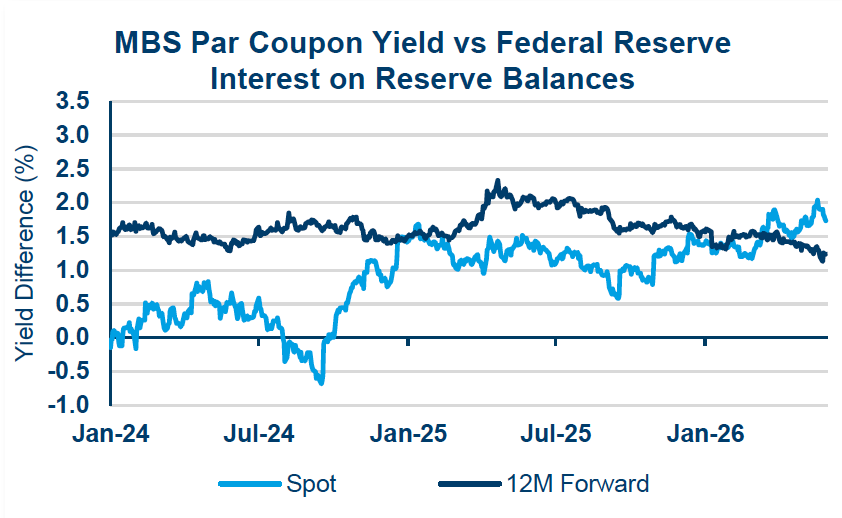
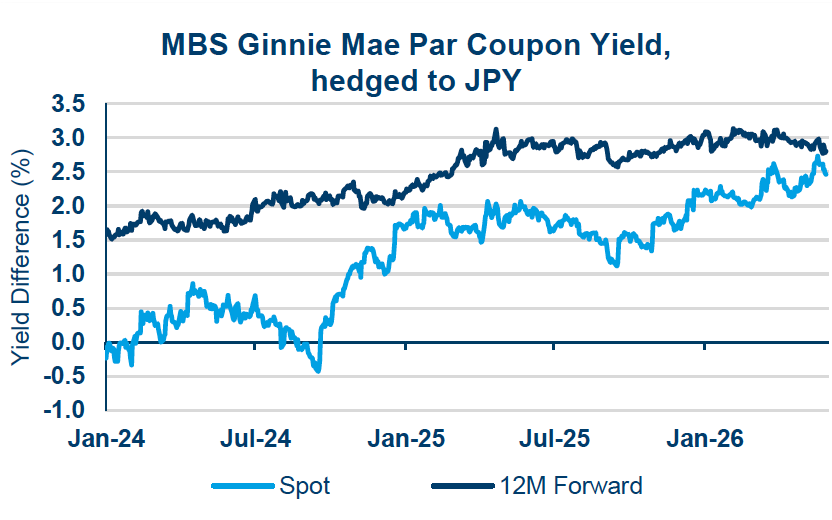
Technicals: The updated Basel III Endgame proposal could inspire banks to make up for a lack of purchases in recent years, but while current carry relative to interest on reserve balances (IORB) is at recent highs, forward curves project this spread to contract amid less dovish Fed expectations. Similarly, while currency-hedged carry for overseas investors is relatively strong, it is not projected to rise much more if forward expectations are realized. Both trends are illustrated below. Fannie Mae and Freddie Mac have been adding MBS as directed by the Trump administration, and while the White House could also attempt to tighten mortgage spreads via additional buy programs or policy changes, the program is not expected to continue past 2026. Mortgage Real Estate Investment Trusts (mREITs) have traded above book value and are positioned with relatively low leverage, both of which can facilitate additional MBS purchases. Asset managers, sitting at significant overweights, could continue to reduce allocations to MBS at tighter spreads.

MBS par coupon yield versus Federal Reserve interest on reserve balances chart.

MBS Ginnie Mae par coupon yield hedged to JPY chart.

Fundamentals: AI advancements and isolated prepayment data suggest more efficient refinancing the next time mortgage rates fall, with the potential for streamline refinancing in conventional loans that could meaningfully accelerate cheapest-to-deliver prepayments. However, current data continues to support more benign prepayment outlooks, with any spike in recent years short-lived and explainable by loan closing timeline adjustments. Additionally, faster prepayments increase the potential for security selection opportunities, as do potential dislocations from changing government policies.

The balanced considerations above and price-sensitivity of marginal investors has influenced us to trade around in modest size as headlines moved markets. Broadly, the willingness of asset managers to sell at tighter spreads, with banks, overseas investors, mREITs, and agencies willing to buy at wider spreads, can provide both the resistance and support to maintain the range as macro factors oscillate. In the medium-term, demand from banks, overseas investors, and the agencies could weaken or disappear in 2027, reducing (but not extinguishing) our optimism over a longer timeline. Dedicated MBS portfolios are positioned more closely to the index than the long-term average, but we view agency MBS more favorably as a positive contributor to aggregate, multi-sector, or multi-asset portfolios. We prefer MBS relative to swaps rather than to Treasuries, particularly because current marginal sources of demand hedge this way. Additionally, we are optimistic that prepayment uncertainty and headline-induced dislocations may provide dynamic allocation and security selection opportunities.

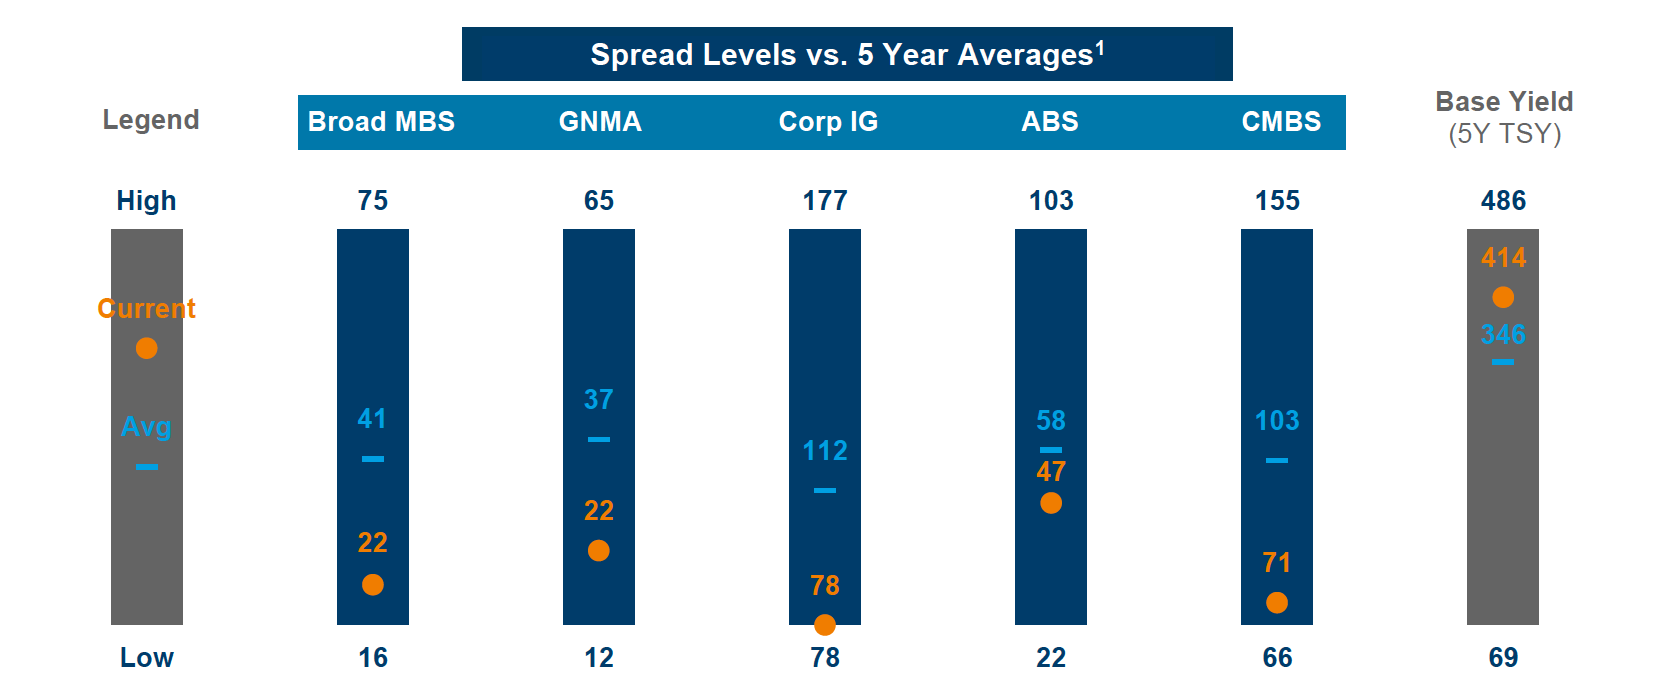
Securitized Market Dashboard

Spread levels versus five-year averages chart.

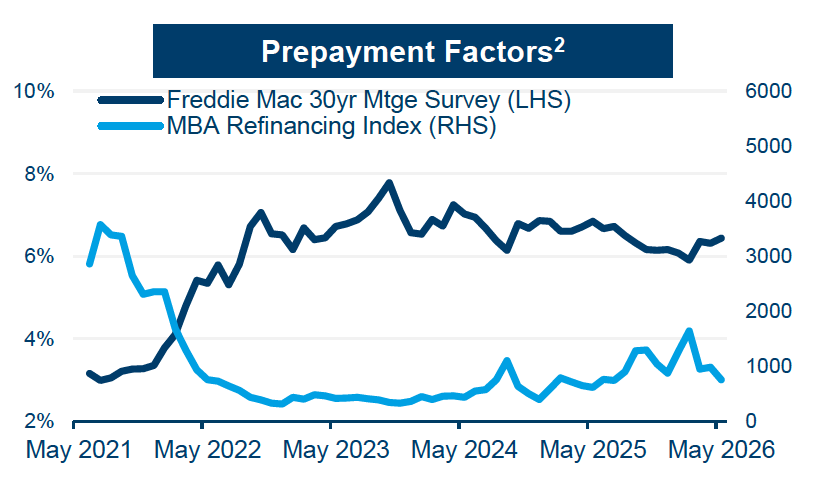
Prepayment factors chart showing Freddie Mac 30-year mortgage survey and MBA refinancing index.

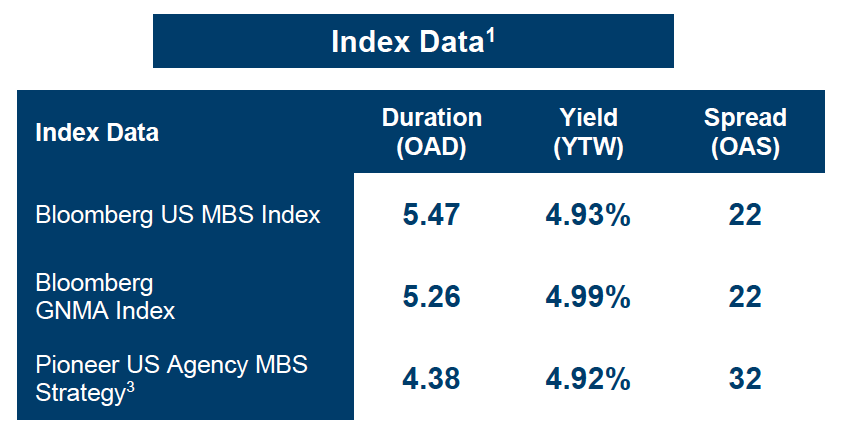
Index data table showing duration, yield and spread for MBS indexes and Pioneer US Agency MBS Strategy.

Source: Bloomberg, as of May 31, 2026

1Index Data: Bloomberg US MBS Index, Bloomberg GNMA Index, Bloomberg US Aggregate Corporate Average OAS, Bloomberg US Investment Grade ABS Index, Bloomberg US Investment Grade CMBS Index.
2S&P/Experian First Mortgage Default Index, MBA Refinance Index.
3The characteristics are of the representative account (gross, USD) in the US Agency MBS composite. Gross-of-fees returns are presented before management and custodial fees but after any transaction costs.

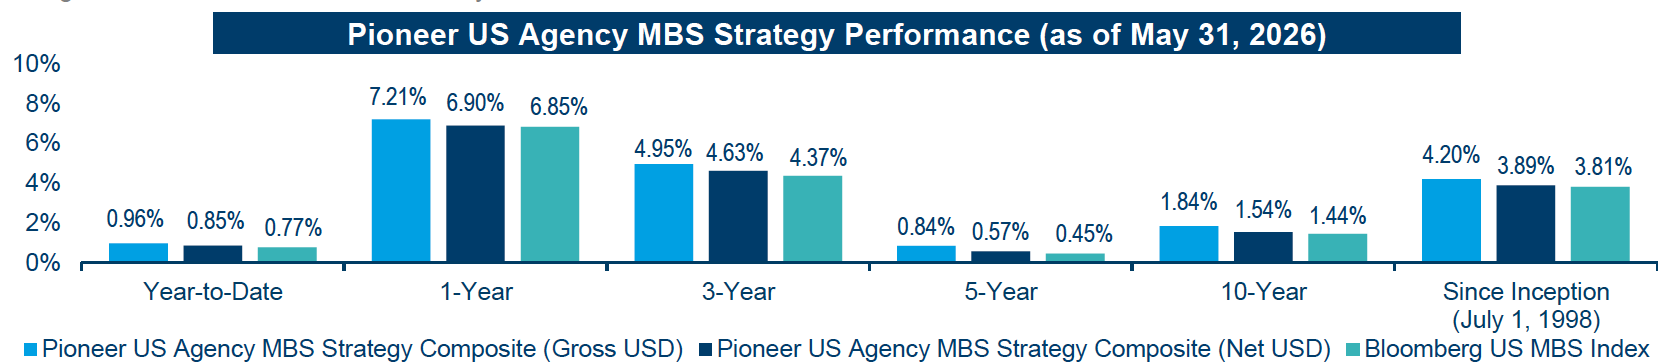
Pioneer US Agency MBS Strategy performance chart as of May 31, 2026.

Source: Pioneer Investments, as of May 31, 2026
Performance prior to April 1, 2025, occurred while the portfolio management team was affiliated with a prior firm. Such members of the portfolio management team were responsible for investment decisions at the prior firm and the decision-making process has remained intact.
Returns greater than one year are annualized. Returns are expressed in US dollars and reflect the reinvestment of dividends and other earnings.
Gross-of-fees returns are presented before management and custodial fees but after any transaction costs. The composite net-of-fees returns reflect net of model fees and are calculated in the same manner as gross of fee returns using the Time Weighted Rate of Return method. Actual fees may vary depending on, among other things, the applicable fee schedule and portfolio size.
Please refer to the GIPS® Report for additional information.
Past performance is no guarantee of future results.


READ MORE FROM PIONEER INVESTMENTS


Important Information

All investing involves risk, including the possible loss of principal. An investment should be made with an understanding of the risks involved with owning a particular security or asset class.

Unless otherwise stated, all information contained in this document is from Pioneer Investments, a Victory Capital® Investment Franchise. The views expressed in this presentation are those of Pioneer Investments as of the date noted, and are subject to change at any time. These views should not be relied upon as investment advice, as securities recommendations, or as an indication of trading intent on behalf of any of portfolio.

The services and any securities described in this document may not be registered for sale with the relevant authority in your jurisdiction and may not be regulated or supervised by any governmental or similar authority in your jurisdiction. Where unregistered, they may not be sold or offered except in the circumstances permitted by law. Pioneer Investments is not making any representation nor does this document constitute a representation with respect to (i) the eligibility of any recipients of this document to acquire any securities or any services described herein in any jurisdiction or (ii) the eligibility of any recipients of this document to receive this document in any jurisdiction. If you are in doubt about the content of this document or your eligibility, you should obtain independent professional advice.

Each portfolio is actively managed. Sector allocations are subject to change. Holdings are subject to change and should not be construed as investment advice or a recommendation to buy, sell, or hold any security. Information relating to portfolio holdings is based on the representative account in the composite and may vary for other accounts in the strategy due to asset size, client guidelines and other factors.

Indexes are unmanaged; their returns include reinvestment of dividends and other income but do not reflect management fees, transaction costs or expenses. It is not possible to invest directly in an index. Past performance does not guarantee future results.

Advisory Services offered by Victory Capital Management Inc.

Compliance Statement: Victory Capital Management Inc. claims compliance with the Global Investment Performance Standards (GIPS®) and has prepared and presented this report in compliance with the GIPS standards. Victory Capital Management Inc. has been independently verified for the period from January 1, 2001 through December 31, 2023. The verification report is available upon request. A firm that claims compliance with the GIPS standards must establish policies and procedures for complying with all the applicable requirements of the GIPS standards. Verification provides assurance on whether the firm's policies and procedures related to composite and pooled fund maintenance, as well as the calculation, presentation, and distribution of performance, have been designed in compliance with the GIPS standards and have been implemented on a firm-wide basis. Verification does not provide assurance on the accuracy of any specific performance report.

©2026 Victory Capital Management Inc.

20260609-5547416

Share this post

Sign Up Now for Full Access to Articles and Podcasts!

Unlock full access to our vast content library by registering as an institutional investor

Register

Contacts


Image
Pioneer Stacked Logo FL


Pioneer Investments manages $147 billion in assets and has a long-standing history of innovation with deep expertise managing fixed income portfolios and creating customized solutions within the more opportunistic areas of the securitized market.

Pioneer Investments’ culture of innovation, in the securitized market, originated at Smith Breeden, where its founders developed early option-adjusted spread modeling techniques for MBS valuation. The innovative approach continues under Victory Capital, which manages over $10.7 billion for insurance companies. We are focused on delivering competitive risk-adjusted returns, while considering the accounting, regulatory, and capital management needs of our insurance clients to create long-term partnerships.  We understand the unique needs of insurers, and we provide customized and efficient risk-based capital solutions that align with insurers' risk tolerances and investment objectives.

Source: *Pioneer Investments, a Victory Capital Investment Franchise, as of June 30, 2026
 

Jay Alexander, CFA, CAIA
Managing Director, Institutional Markets
jalexander@vcm.com
+1 (612) 965-5426

 
Emma White
Director, Institutional Markets
ewhite@vcm.com
+1 (617) 422-4569

Marko Komarynsky
Director, Institutional Markets
mkomarynsky@vcm.com
+1 (210) 697-3613
 

View the contributor page

Sign Up Now for Full Access to Articles and Podcasts!

Unlock full access to our vast content library by registering as an institutional investor .

Create an account

Already have an account ? Sign in

Ѐ Ё Ђ Ѓ Є Ѕ І Ї Ј Љ Њ Ћ Ќ Ѝ Ў Џ А Б В Г Д Е Ж З И Й К Л М Н О П Р С ΄ ΅ Ά · Έ Ή Ί Ό Ύ Ώ ΐ Α Β Γ Δ Ε Ζ Η Θ Ι Κ Λ Μ Ν Ξ Ο Π Ρ Ё Ђ Ѓ Є Ѕ І Ї Ј Љ Њ Ћ Ќ Ў Џ А Б В Г Д Е Ж З И Й К Л М Н О П Р С Т У Ф Х Ц Ч Ш Ā ā Ă ă Ą ą Ć ć Ĉ ĉ Ċ ċ Č č Ď ď Đ đ Ē ē Ĕ ĕ Ė fi fl œ æ ß