Commercial Real Estate Fundamentals After the COVID-19 Outbreak: Surprisingly Attractive
Executive Summary
Unlike the aftermath of the global financial crisis, when U.S. real estate values plummeted across the board, the pandemic has had disparate effects: It dealt a blow to retail, office and hospitality sectors while industrial and multi-family sectors have remained relatively unscathed.
Even within the commercial real estate category, there has been dispersion among subsectors: Industrial has outperformed while office, hospitality and retail have yet to bounce back. This has created unique and potentially fruitful investment opportunities.
Our research seeks to assess valuations for a range of commercial property types. To do so, we devised a cyclically adjusted capitalization rate that serves as a real measure of relative value across asset classes and property types. According to this metric, commercial real estate appears to have a significantly higher risk premium than other, traditional asset classes.
Based on historical data, secular trends and technical and fundamental factors, we believe commercial real estate is an attractive asset class. We favor industrial, multi-family and hospitality sectors, yet remain cautious on retail. We have a mixed outlook for office properties.
Authors: Jamil Baz, Managing Director Head of Client Solutions and Analytics, Josh Davis, Managing Director Global Head of Client Analytics, Lloyd Han, Vice President Quantitative Research Analyst Client Solutions and Analytics, German Ramirez, Vice President Quantitative Research Analyst Client Solutions and Analytics, and Christian Stracke, Managing Director Global Head, Credit Research
INTRODUCTION
As the economy begins to reopen and valuations of traditional assets are in the tails, investors are looking to broaden their investment universe. In this piece, we examine the appeal of commercial real estate in the U.S. and the factors that could affect valuation and recovery across subsectors. Overall, we find real estate attractive and favor industrial, multi-family and hospitality sectors, yet remain cautious on retail. We have a mixed outlook for office properties.
At the end of 2019, three secular themes guided commercial real estate investment: the growing importance of technology, the rise of e-commerce and continuing urbanization. When the COVID-19 pandemic slammed the U.S. in March 2020, the economic shutdown accelerated the relevance of technology and e-commerce while the upsurge in working from home (WFH) and the risk of contagion associated with city living reversed the urbanization trend. Moreover, the crisis has had a heterogeneous effect on property types.
Industrial and multi-family real estate were least affected; they benefited from the boost to online shopping and strong housing market fundamentals. For hotel, retail and office real estate, though, the crisis proved especially disruptive, and all three sectors have yet to fully recover.
Our views on the real estate market reflect historical data, secular trends, and technical and fundamental factors, in a holistic manner. To measure the fundamental real estate value, we introduce a cyclically adjusted capitalization rate (CACR), the real estate equivalent of Shiller’s cyclically adjusted price-to-earnings ratio, commonly known as CAPE, for equities. However, cap rates alone do not capture the full story. Our investment conclusions thus assess this data in the context of both broader market trends and the idiosyncrasies of various property types.
A LOOK AT HISTORY
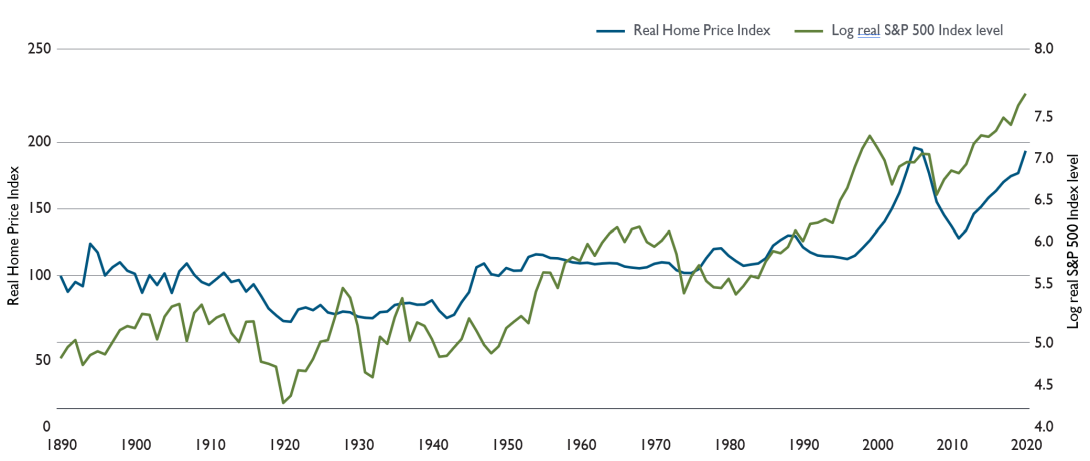
Residential real estate Unfortunately, historical data on commercial properties is quite limited. Therefore, to gain perspective, we will make a brief detour and look at U.S. residential real estate. Exhibit 1 plots real home prices and the real level of the S&P 500 (on a log scale) from 1890 through 2019. Note that we trimmed our sample at the end of 2019, as we are interested in studying the historical record leading to the COVID-19 crisis. In the following section, we will detail asset performance after the outbreak.
With the exception of the past 25 years, real home prices have been remarkably stable in the U.S. The index fell following the influenza epidemic in 1918 and rose as baby boomers multiplied after World War II. The steady increase in real home prices since about 2000 looks to be the exception, not the rule. The stability of real home prices is particularly interesting because economic theory suggests the ratio of real price growth to real GDP growth should be stationary over long horizons. In the U.S., however, the lack of real home price growth likely reflects the massively elastic supply of land and construction technology that makes the older stock of homes obsolete. The increase over recent decades – including the recovery following the 2008 global financial crisis (GFC) – is largely tied to dovish monetary policy, in our view.
On average, real home prices rose 0.26% per year from 1890 to 2000 and 1.5% annually from 2000 to 2019, yielding a full-sample growth rate of 0.44% per year, which indicates that the bulk of the total return came from rents net of maintenance and taxes. The average rental yield was 5.3% per year from 1890 to 2000 and 4.6% annually from 2000 to 2019, resulting in a full-sample yearly rental yield of 5.2%, according to Shiller’s website.
Another salient point is the diversification offered by real estate assets. The correlation of real Home Price Index (HPI) returns to real S&P returns was 0.17 from 1890 to 2000 and 0.28 from 2000 through 2019, yielding a full-sample correlation of 0.18.
Exhibit 1: The recent appreciation in real house prices is an exception, not the rule
Source: Bloomberg and Robert Shiller’s website as of December 2019. The Real Home Price Index corresponds to the index used in Shiller’s book Irrational Exuberance.
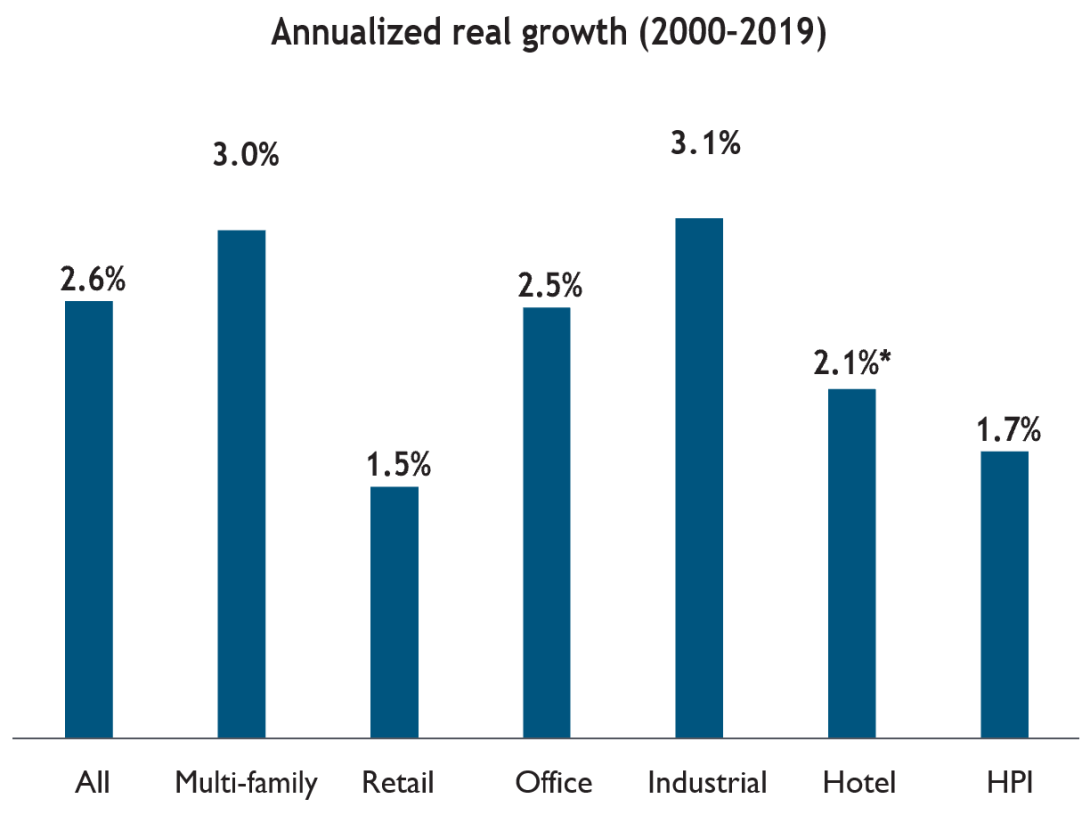
Commercial real estate With the historical backdrop of the U.S. residential real estate market in mind, we return to commercial real estate. Exhibit 2 compares the real prices of various commercial property types with Shiller’s HPI from 2000 through 2019. Notwithstanding some dispersion across sectors, all real estate has seen a positive real price appreciation over the past two decades.
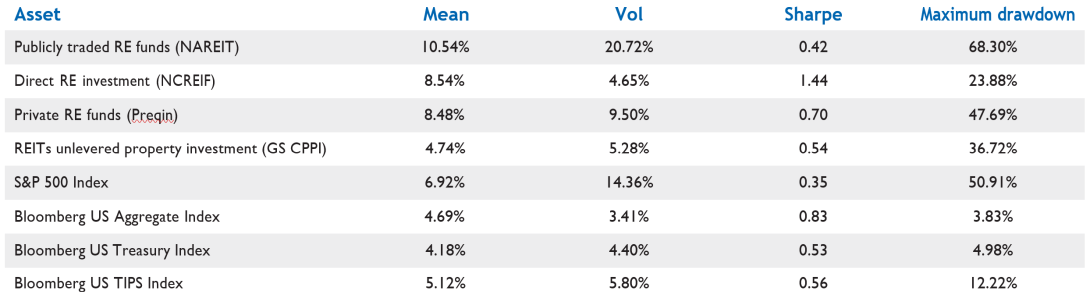
As for total returns, Exhibit 3 shows annualized nominal returns from investing in real estate compared with equities, bonds, U.S. Treasuries and Treasury Inflation-Protected Securities (TIPS). We include public, direct and private real estate investments, represented by indices from the National Association of Real Estate Investment Trusts (NAREIT), the National Council of Real Estate Investment Fiduciaries (NCREIF) and Preqin. We also include the Green Street Commercial Property Price Index (GS CPPI) as a reference point.
Exhibit 2: Notwithstanding some dispersion across sectors, real estate prices appreciated over the past two decades
Source: Green Street Advisors. Annualized real growth based on property price data from December 2000 to December 2019. *Hotel data starts in December 2003.
Exhibit 3: Regardless of the vehicle, commercial real estate has been an attractive alternative asset
Source: PIMCO, Green Street Advisors and Bloomberg. Based on monthly data from December 2000 to December 2019. Publicly traded RE funds correspond to the FTSE NAREIT Equity REITs Index, direct RE investment to the U.S. NCREIF Property Index, private RE funds to the Preqin Private Real Estate Index, REITs unlevered property investment to the Green Street Commercial Property Price Index. It is not possible to invest directly in an unmanaged index.
Exhibit 4: Performance within real estate varies greatly by property type, as seen in REITs data
Source: PIMCO and Bloomberg as of December 2019. Annualized performance metrics
As Exhibits 3 and 4 show, U.S. commercial real estate outperformed U.S. stock and bond indices over the two decades prior to the COVID-19 outbreak, although the highest Sharpe ratios, among publicly traded assets, belong to fixed income categories. Joint outperformance of real estate and bonds is hardly surprising, as it can be argued that most equity assets were propped up by lower real yields and benevolent monetary policy.
It is worth highlighting some of the differences among real estate investment vehicles, particularly regarding volatility. Public funds experienced volatility 4.5 times higher than direct investments. Historically, total debt-to-enterprise value for REITs has averaged 40%. Thus, leverage accounts for an increase of 1.7 times in volatility, while the remaining multiple of 2.7 can be attributed to factors such as overly smoothed appraisal values and equity beta as investors look to sell their more liquid public holdings during downturns.1 Despite the additional volatility in public funds, the REIT return series has an autocorrelation near zero, meaning there is minimal evidence of price smoothing.
For private funds, volatility has been 2 times higher than for direct investments. According to Preqin, these funds’ total debt-to-enterprise value has averaged around 56%, which explains the difference in volatility. However, adjusting for leverage alone does not correct for appraisal values and lacks mark-to-market pricing. With return autocorrelations of 0.85 for direct investment and 0.60 for private funds, returns may still be distorted.
Given our goal of analyzing the asset class since the onset of the COVID-19 crisis, we choose to focus on data from REITs. The NCREIF and Preqin indices suffer from smoothing, which makes it difficult to see the impact of recent market events. We acknowledge that some of the volatility coming from REITs will not be solely related to real estate investing and may also be related to liquidity concerns, as experienced by all publicly traded assets.
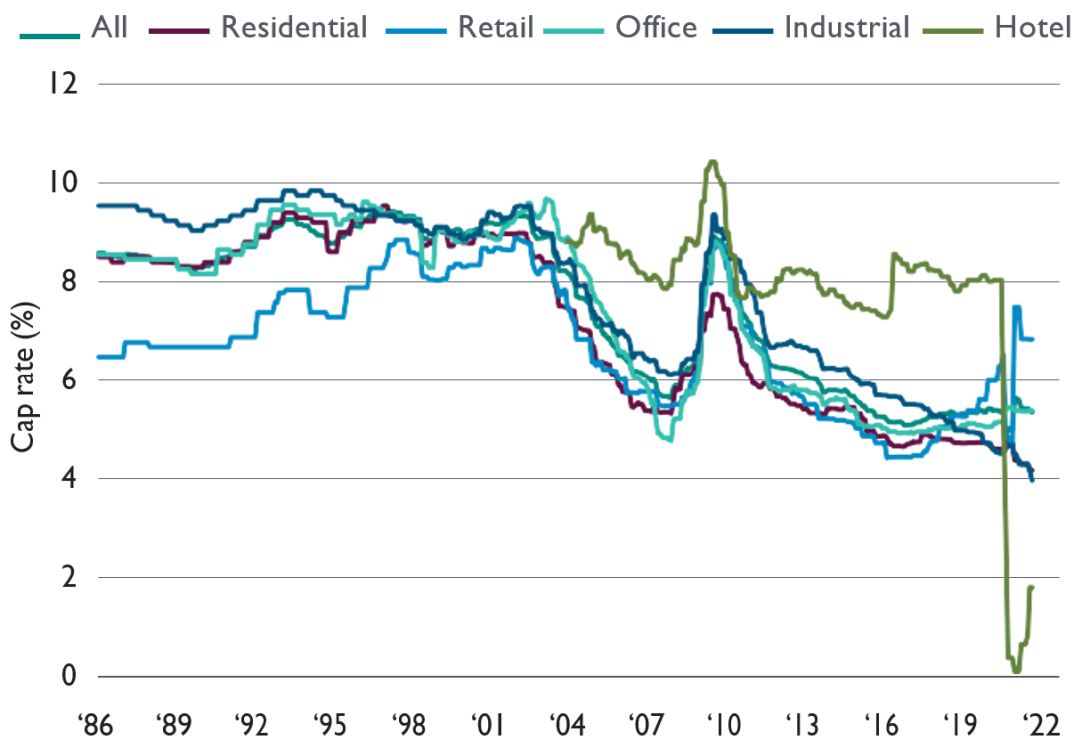
Next, we account for the income component of real estate sectors by plotting the time-series of cap rates across sectors. Cap rates are defined as net operating income (NOI) divided by the property price (see Exhibit 5).
Exhibit 5: Capitalization rates across property types have consistently declined
Source: Green Street Advisors as of May 2021
Although the data sample is limited to 35 years, we see that, with a couple of exceptions, such as hotels suffering from mandatory closures during the COVID-19 crisis, cap rates across the different property types have tended to move together. We have also seen a secular downward trend in cap rates coinciding with the fall in real yields across all major asset classes over this time period. We caveat our results by noting that the data may be unreliable, especially for hotels. While we feel the trend and relative level of cap rates are intuitive, we caution that measurement error and poor data quality remain a potential issue.
To understand valuations,2 we find it illustrative to use a simple Gordon Growth Model. In the appendix, we show cap rates can be interpreted conceptually as the earnings yield. Moreover, if we assume rent growth matches growth in capital expenditures, we find that the real estate risk premium is the cap rate minus the real yield. If we consider a longer history in which real home prices have remained mostly unchanged, reinvested earnings have generated little growth, in which case the cap rate could be analogous to both the earnings yield and the dividend yield. As home prices have experienced material real growth in recent times, earnings yields have diverged from dividend yields.
Similar to earnings in equities, NOI can fluctuate with both the business cycle and idiosyncratic events. As a result, current NOI is not a good measure of the sustainable income real estate can generate. Instead of using the cap rate to calculate the real estate risk premium, we use the CACR, equivalent to Shiller’s CAPE ratio. We define the CACR as the 10-year average real NOI divided by the current real price. We define the real estate risk premium as the CACR minus the real yield.
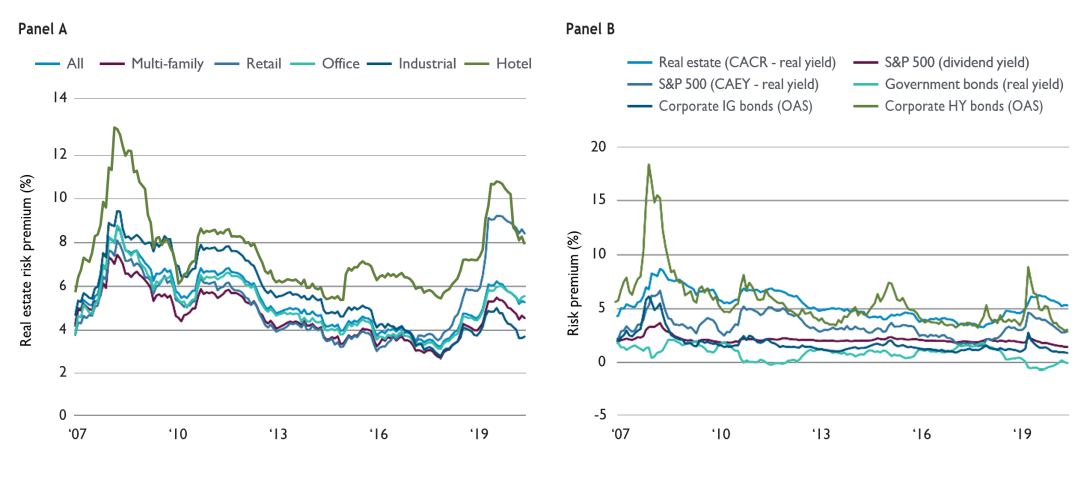
Exhibit 6 plots the real estate implied risk premium across real estate sectors and compares the broad real estate premium with the risk premia of other asset classes. Based on this valuation metric, real estate appears to be particularly attractive, trading at a risk premium spread close to 270 basis points (bps) above the S&P 500. We define the equity risk premium as the cyclically adjusted earnings yield (CAEY) minus the 10-year real yield. The CAEY corresponds to the inverse of the CAPE. This equity risk premium is consistent with our real estate risk premium definition.
Exhibit 6: Looking forward, the risk premium in real estate appears attractive relative to traditional assets
Source: PIMCO, Green Street Advisors and Bloomberg as of May 2021. Panel A shows valuations across commercial real estate property types. Panel B shows valuations for different asset classes.
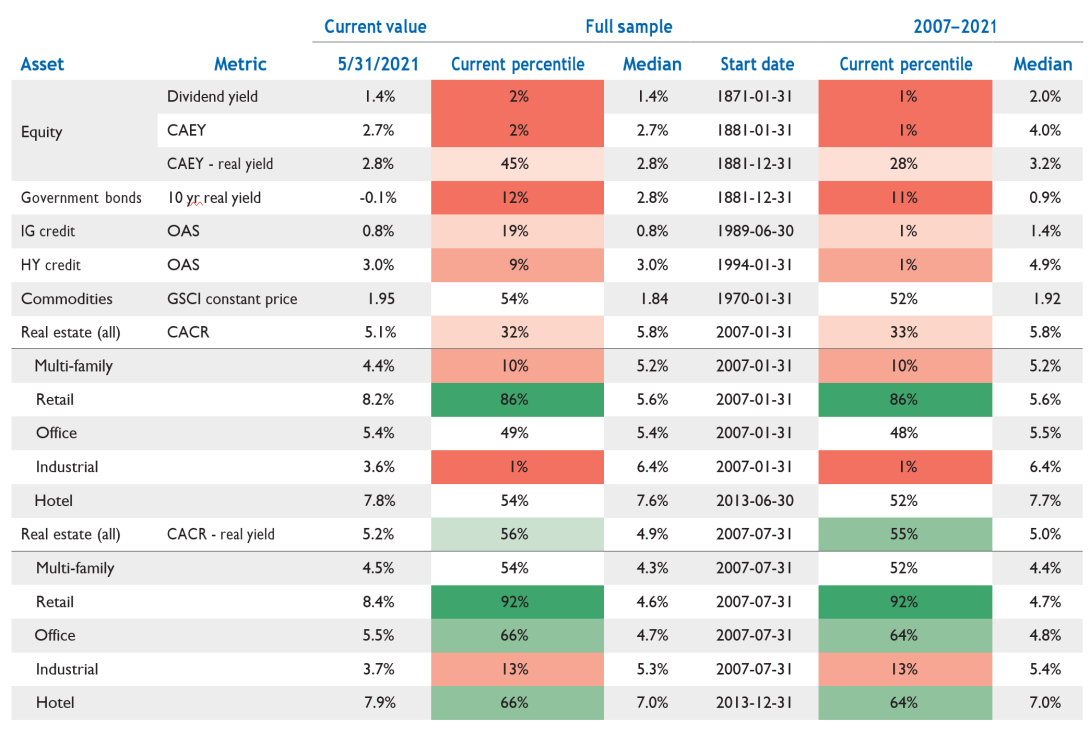
We also compute the percentiles of the valuation metric for each asset class relative to the longest possible history as well as a common sample in Exhibit 7.
Exhibit 7: Current valuations favor commercial real estate over other asset classes
Source: PIMCO, Green Street Advisors and Bloomberg as of May 2021
These percentiles confirm our assessment of absolute risk premium levels: Current market conditions show equities and credit trading at compressed valuation levels while real estate remains an attractive investment.
THE COVID-19 CRISIS AND SUBSEQUENT RECOVERY
One way to put context around the impact of the pandemic on real estate is to compare current return and valuation metrics with those during the financial crisis of 2008. Exhibit 8 compares returns of the various property types (measured by REIT indices) during the drawdown and recovery periods of both the COVID-19 crisis and the GFC. As it did in other asset classes, the pandemic caused an abrupt drop in real estate prices; the drawdown occurred over two months, January 2020 and March 2020. This is a significantly shorter period than the GFC drawdown, which spanned 25 months from January 2007 through February 2009. We define the post-COVID-19 recovery as the return from the trough of returns to the present, March 2020 to May 2021 (the latest data available). For consistency, we define the 2008 crisis recovery period as a 14-month window from February 2009 to April 2010.
Exhibit 8: The GFC hit all property types similarly, while hotels, office and retail have yet to recover after the pandemic
Source: PIMCO and Bloomberg as of May 2021
During the GFC, there was a more uniform drawdown across sectors as well as a more uniform recovery from the trough, with the exception of hotels. During the COVID-19 drawdown, the largest impacts were in the hotel, retail and office sectors, with industrial and multi-family segments relatively unaffected. Note that the magnitude of the GFC drawdown was twice as large as the COVID-19 drawdown; however, the pandemic drawdown took only an eighth as much time. After the trough in February 2009, all sectors had extremely high returns. However, over a sample of the same length following COVID-19, offices, retail and hotels had not fully recovered, unlike the multi-family and industrial sectors, which are now priced higher than pre- COVID-19 levels.
It is easy to see why this dispersion occurred: Hotels suffered a collapse in occupancy rates coupled with high operational leverage and fixed costs, while retail landlords struggled as tenants demanded rent relief and faced default. By contrast, industrial, logistics and life science assets were, if anything, bolstered by the pandemic.
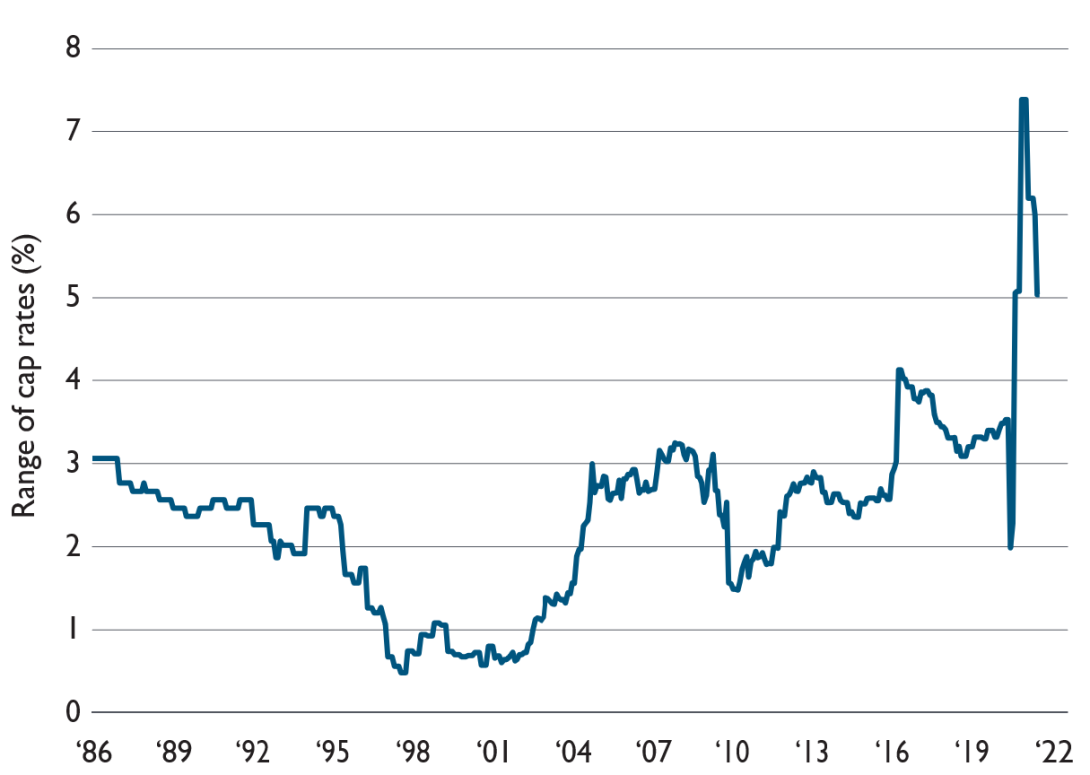
Another way to visualize the heterogeneous impact of the COVID-19 crisis is to look at the difference between the maximum and minimum cap rates across property types (see Exhibit 9). The COVID-19 crisis created an unprecedented dispersion in cap rates.
Exhibit 9: Valuation dispersion across property types reached unprecedented levels during the pandemic
Source: PIMCO, Green Street Advisors and Bloomberg as of May 2021. The range of cap rates includes the following property types: multi-family, industrial, retail, hotel and office. Hotel data starts in December 2003.
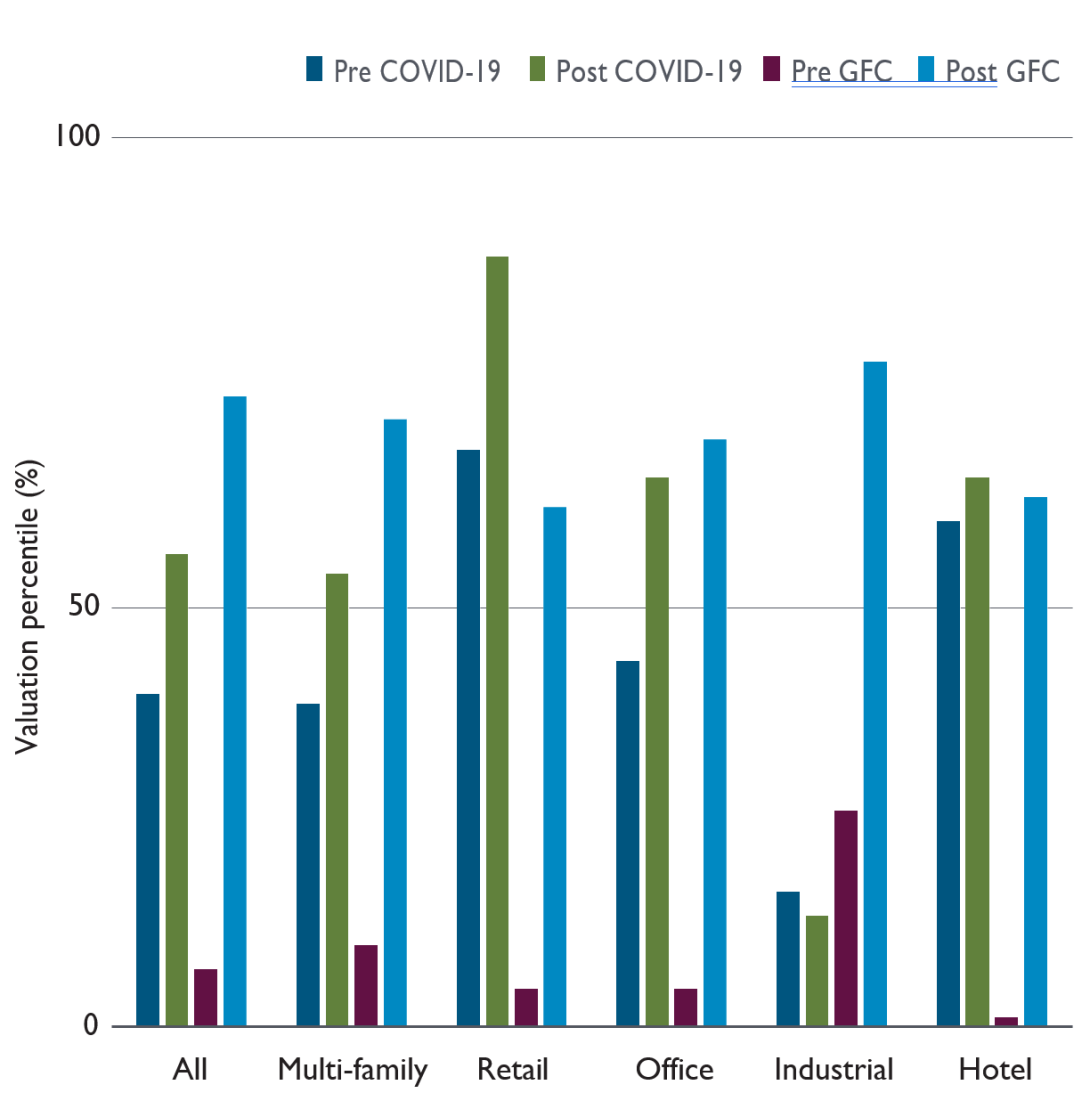
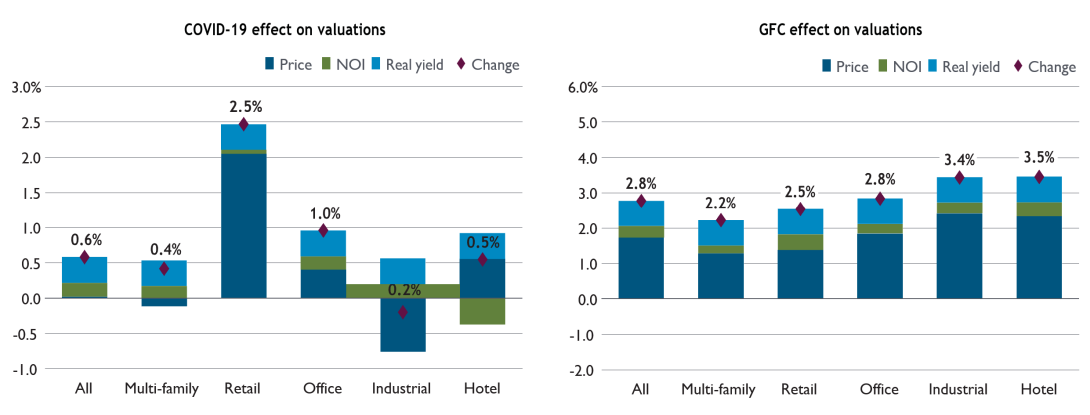
Exhibit 10 shows the impact of both crises on the proposed valuation metric – that is, the real estate risk premium defined as CACR minus real yield. In the GFC, all real estate sectors started at rich valuations and ended at cheap levels. The COVID-19 crisis was quite different. First, valuations were more dispersed pre-pandemic: Retail and hotel sectors were cheap, and multi-family, office and industrial segments were rich. Second, the COVID-19 crisis had a mixed effect: Multi-family, retail and office properties became cheaper while industrial assets remained unchanged.
What accounts for the changes in valuation during the GFC and COVID-19 crisis? In both cases, real yields made valuations more attractive. During the GFC, all valuations became cheaper, with property prices and the real yield dropping while rents remained relatively unchanged. In the case of COVID-19, the impact from income and price changes varied by property type. For retail, office and hotel, falling property prices caused valuations to become cheaper. For industrial, property prices rose and more than offset the fall in real yield and increase in NOI. For multi-family, property prices remained mostly unchanged (see Exhibit 11).
Exhibit 10: The pandemic has had more diverse impacts on valuations than the GFC did
Source: PIMCO, Green Street Advisors and Bloomberg as of May 2021
Exhibit 11: Changes in income and prices across property types highlight the heterogeneous effect the pandemic has had on valuations
Source: PIMCO, Green Street Advisors and Bloomberg as of May 2021. Decomposition of the change in valuation between January 2020 and May 2021 for the COVID-19 crisis and between January 2007 and April 2010 for the GFC
INVESTMENT IMPLICATIONS
Real estate valuations are attractive. This is a rare finding in a world marked by fair to stretched valuations and the strong recovery of most assets after COVID-19. Moreover, the recession created historically high dispersion within real estate valuations, generating many alpha opportunities for both equity and debt investors. In the current market, we favor industrial, multi-family and hospitality sectors while we remain cautious about retail. For office properties, we have a mixed outlook.
Our views differ from an assessment based solely on the proposed valuation metric that would indicate that hospitality, office and retail properties are cheap; industrial assets are rich; and multi-family real estate is fairly valued. However, as we explain below, looking at only one metric does not account for secular trends and qualitative factors.
Despite rich valuations, we are bullish on industrial property owing to its long-term resilience and to the structural, e-commerce-driven demand for warehouse space. CBRE Group estimates 2020 was the first year in which e-commerce surpassed 20% of total retail sales,3 continuing a trend of exponential growth.
Multi-family demonstrated its resiliency during the crisis. Thanks to strong fundamentals, reduced consumer spending and fiscal stimulus, tenants were able to continue rent payments without major rebates. The crisis disrupted the secular urbanization trend; people looked to move outside of city centers and to lower-tax cities as WFH became prominent and employers allowed more flexible work schedules. Our multi-family outlook is positive as these migration patterns create investment opportunities supported by strong fundamentals.
Our positive take on hotels stems from our generally positive cyclical outlook on the economy, which bolsters high leverage, income-sensitive property types such as hospitality. Even though NOI is at historically low levels, we believe nothing is structurally wrong with the sector, and these assets should have a strong recovery. Hotel prices are trading at a deep discount while dislocation and liquidity concerns have allowed financiers to impose stricter covenants, making lending attractive.
We favor office properties in the short run, as they feature long-term leases. However, we believe WFH is a trend that will persist. In a recent survey,4 many employees reported an increase in productivity when working from home. This trend will inevitably reduce the required office space per employee, but floor plans will need to be adapted to shared workstations and more collaborative spaces, creating dispersion and opportunities in the sector. Long term, we remain cautious on the sector as some of these trends settle.
In retail, the pandemic pushed valuations to even cheaper levels, which we think are justified, given the trend toward e-commerce. However, we may see transitional opportunities as retail locations are converted to other property types. For example, warehouses in urban core areas are in high demand, as they are optimal for e-commerce distribution. Some select retail properties may become excellent candidates for repurposing if market- and deal-specific conditions are met.
CONCLUSION
The COVID-19 dislocation accelerated existing secular trends and created potentially lucrative opportunities in real estate. Valuations favor the asset class relative to equities: We estimate the real estate risk premium is 270 bps above the equity risk premium. Across property types, our view is that industrial and multi-family sectors have room to grow despite richer valuations today, and hotel and office properties are poised for a strong recovery – although risks related to a return to offices and business travel remain. Amid low expected returns and fragile asset markets, we view real estate-linked assets as strongly accretive to portfolios.
We thank Megan Walters, Clemens Ernst, Raphael Mertens and Francois Trausch from Allianz Real Estate, and John Murray, Devin Chen, Carrie Petersen-Brown and Jason Mandinach from PIMCO, for valuable feedback and contributions to this paper.
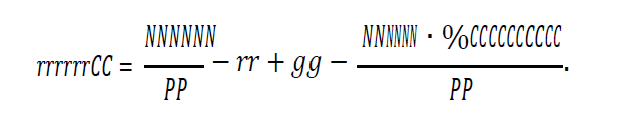
Using the Gordon Growth Model in the context of real estate, we find that the price of a property is
where NOI is the net operating income from owning a property, %CapEx are capital expenditures expressed as a percentage of NOI, r is the real yield and rerp is the real estate risk premium. Rent, capital expenditures and operating income are all assumed to grow at a rate g. Then the real estate risk premium is
Assuming rent grows at par with capital expenditures – that is,g = NOI ∙ %CapEx/P – we simplify the real estate risk premium to
Past performance is not a guarantee or a reliable indicator of future results. This paper contains hypothetical analysis. Results shown may not be attained and should not be construed as the only possibilities that exist. All investments contain risk and may lose value. Equity investments may decline in value due to both real and perceived general market, economic and industry conditions, while