Ninety One -
EM debt: the evolution of an asset class

The growing size and importance of EM as an asset class and the diversification benefits it can provide investors means that an allocation merits serious consideration.
EM debt has been expanding rapidly
The evolution of the asset class over the past decade has been quite astounding. While this has created a broader opportunity set, it has also increased the complexities around investing in it. The asset class was born in 1989, with the creation of ‘Brady bonds’ by then US Treasury Secretary Nicholas Brady. The debt-reduction plan enabled commercial banks to exchange their claims on developing market governments (mainly from Latin America) and convert them to more tradeable and liquid Brady bonds. Since then, hard currency debt markets have become an increasingly important source of financing for EMs and remain the main entry point for most countries when making their first foray into global fixed income markets. Compared to the early 1990’s, when four countries (Argentina, Brazil, Mexico and Russia) accounted for over 80% of the market, the size, complexity and diversity of the market has changed hugely. More recently, since the Global Financial Crisis (GFC) the amount of overall debt in issuance has increased by 3.5 times, with annual growth rates above 15%. Yet despite this large increase, the asset class has not kept pace with the growth of EM economies’ share of global GDP. EM debt accounted for around 30% of global debt as at the end of 2022, while the EM share of GDP has grown from just over 20% in 2003 to nearly 43% over the past 20 years (IMF World Economic Outlook April 2023). Therefore, whether or not to make a deliberate and considered allocation to such a sizeable part of the fixed income investable universe is a definitive investment decision.An increasingly diverse opportunity set
The composition of the market has also changed. Initially dominated by hard currency sovereign issuance, the hard currency corporate market has grown significantly in recent years. The EM corporate debt market alone is now double the size of the US high-yield market and similar in size to the European IG market – this is a big and diversified opportunity set. However, the real surge in issuance has taken place in the local currency space – first in sovereigns and then corporates once local yield curves got established. Over the past 10 years, we have seen a diverse array of countries join the flagship EM hard currency debt index known as the JP Morgan Emerging Market Bond Index (EMBI). The number of countries in the index has almost doubled from 38 to 69 and coverage of the investment universe has become more challenging as it spans oil exporters and importers, regional manufacturing hubs and services-driven economies. A key feature of the EMBI’s growth has been the increasing number of smaller markets, including countries in central Asia, Sub-Saharan Africa, and the Middle East. These smaller and often less liquid markets are also typically under-researched by the mainstream investment community, bringing greater potential for alpha capture for those willing and able to do the necessary analysis. The EMBI was originally focused on Latin America but today the investment universe spans the globe. While this is among the factors explaining its diversification properties, it also brings additional complexity to investors, who need to keep abreast of global geopolitical trends in addition to a highly diverse set of market-specific drivers. Approximately half of the countries in the EMBI can be thought of as ‘frontier countries’ and these countries offer significantly higher spreads. This globally diverse frontier market universe is as big as the US high-yield bond market (US$1.4 trillion as at the end of 2022, according to JP Morgan). These markets offer the opportunity for investors to take meaningful – and diversified – exposure to a broad range of underlying return drivers.Improving in quality
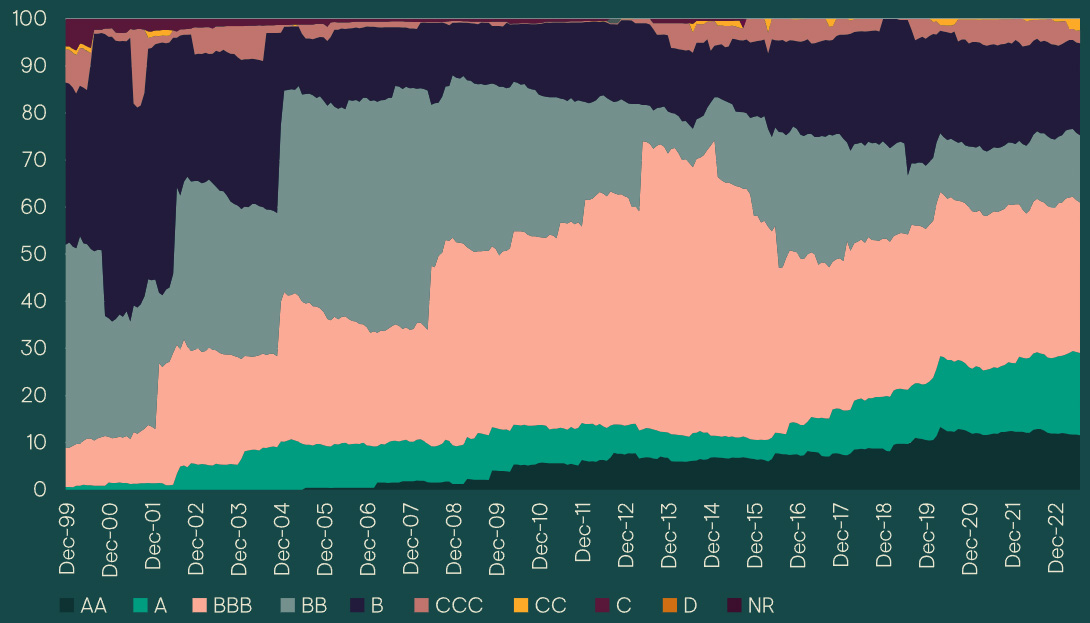
Since the era of Brady bonds, the average credit quality of the EM debt investment universe has steadily improved. Barring a wobble during the taper tantrum of Q1 2013 to Q1 2016, when the proportion of investment-grade markets in the local index (JP Morgan Government Bond Index – Emerging Markets) dipped from 70% to around 50%, on balance it has increased since then. That said, with the growth of frontier markets, the number of high-yield markets within the EMBI has risen, while at the same time, the index has also included more countries from the Gulf Cooperation Council (GCC) region1 and these countries are generally of higher credit quality. The result is a greater dispersion of return outcomes, especially relating to the potential for negative credit events, which creates a rich hunting ground for active investors.Credit rating evolution of the EM HC sovereign bond universe, % of universe
Image
An under-owned asset class
Despite this rapid growth and increasingly diverse opportunity set, EM debt remains an under-owned asset class in investor portfolios, with foreign ownership of local currency bonds in particular standing at just 13.5%. In comparison, foreign investors account for 47% of the holdings of Australian government debt2. This bodes well for current and potential investors, as lower foreign ownership tends to mean that in times of market stress there is less forced selling and the local investor base typically acts countercyclically - with local investors more inclined to hold onto their assets. It also means that in the current environment, and against the backdrop of significant outflows from the asset class in 2022, the technical (supply/demand) position is likely to support the market. From a more structural perspective, investment in EMs is crucial for the global transition to net zero. Given the huge amount of capital needed to finance the energy transition, the green bond market has significant growth potential, and the social, sustainable and sustainability-linked bond markets along with it. In many instances, EMs are leading the way in this field.The EM debt investable opportunity set
| Hard currency sovereign | Hard currency corporate | Local currency sovereign | |
| Definition | Debt issued by EM governments and companies that are 100% state-owned. Denominated in US dollars (or, e.g., euros). | Debt issued by companies based in emerging market economies, usually denominated in US dollars (or, e.g., euros). | Debt issued by EM governments that is denominated in the domestic currency of the issuer. |
| Index* | JP Morgan EMBI | JP Morgan CEMBI | JP Morgan GBI-EM |
| Countries | 69 | 63 | 20 |
| Issuers | 158 | 772 | 20 |
| Yield, % | 8.13 | 7.30 | 6.29 |
| Duration | 6.80 | 4.17 | 5.03 |
Risk and return outcomes
Over the past 20 years, as illustrated in the table below, EM debt has delivered attractive returns for underlying credit quality, and robust risk-adjusted returns. While there have been periods where the market – particularly local currency debt – has struggled to contend with the relentlessly strong US dollar over the past decade, the diversification argument has remained intact. EM debt has brought significant diversification benefits; unsurprisingly, hard currency-denominated sovereign and corporate debt has had a higher correlation to developed market fixed income (given the comparable underlying drivers: US Treasuries and spreads) and the correlation in local currency debt is lower. Importantly, however, EM debt offers a sufficiently high correlation to other growth fixed income asset classes that it can be considered in the same risk bucket, yet the returns are differentiated enough that it warrants analysis as a standalone allocation.Returns, annualised, in US dollars (please see Appendix for individual years)
| Emerging markets | Developed markets | |||||
|---|---|---|---|---|---|---|
| Corp. debt | Sov. HC | Local debt | Global agg | US agg | US HY | |
| End 2002-end 2012 | 8.6% | 11.0% | 12.3% | 6.0% | 5.2 | 10.6% |
| End 2012-end 2022 | 2.8% | 1.6% | -2.0% | -0.4% | 1.1% | 4.0% |
| 2023 YTD | 4.7% | 6.1% | 10.9% | 2.1% | 2.0% | 6.8% |
| Full period (end 2002-31 July 2023) | 5.7% | 6.3% | 5.3% | 2.7% | 3.1% | 7.4% |
Returns/volatility, in US dollars*
| Emerging markets | Developed markets | |||||
|---|---|---|---|---|---|---|
| Corp. debt | Sov. HC | Local debt | Global agg | US agg | US HY | |
| End 2002-end 2012 | 0.98 | 1.24 | 1.03 | 0.98 | 1.46 | 1.00 |
| End 2012-end 2022 | 0.44 | 0.18 | -0.18 | -0.08 | 0.26 | 0.55 |
| 2023 YTD | 0.92 | 0.96 | 1.08 | 0.25 | 0.29 | 1.16 |
| Full period (end 2002-31 July 2023) | 0.75 | 0.70 | 0.45 | 0.46 | 0.78 | 0.81 |
Correlations over past decade (31 July 2013 to 31 July 2023)
| EM corporate | EM sovereign HC | EM local | Global agg | US agg | US HY | |
|---|---|---|---|---|---|---|
| EM corporate | 1.00 | |||||
| EM sovereign HC | 0.94 | 1.00 | ||||
| EM local debt | 0.77 | 0.81 | 1.00 | |||
| Global Agg | 0.63 | 0.71 | 0.68 | 1.00 | ||
| US Agg | 0.54 | 0.60 | 0.43 | 0.86 | 1.00 | |
| US HY | 0.82 | 0.82 | 0.65 | 0.56 | 0.44 | 1.00 |
Relevance for investors’ portfolios
While the percentage of global institutional investors that are allocating to EM debt is increasing, it is still low. For example, a recent European survey3 shows that while investors that do allocate to the asset class typically allocate 3-5% of their portfolios, the overall percentage of funds that allocate at all remains below 40%. Part of the reason for this appears to be that investors do not all view an allocation to EM debt through the same risk-reward lens. In fact, even within a single jurisdiction, there is diversity in approaches – from which part of the asset class to allocate to and how, and what outcomes are sought from the allocation.Analysing the investor base
An understanding of the investor base is crucial to successful investing in EM debt markets. While flows data typically focus on offshore investors, it’s interesting to look at who are the real long-term investors. EM debt has a very broad investor base and local investors – banks, assurance and insurance, as well as local pension markets – are very important for the asset class. That means local regulation is also an important driver, not only of holdings, but also of prices. For this reason, an understanding of the local backdrop is of paramount importance to understanding the fixed income market and yield curve. Local investors are the key holders of local debt in markets such as South Africa, Mexico and Brazil; the reasons behind this are varied and often country-specific. Local holders are also a big consideration in corporate markets – given the low level of onshore local currency corporate bond investment by offshore investors – this market is dominated by local banks and insurers, who typically have very long investment horizons.Looking to the future
While EM debt has grown significantly, its share of the global fixed income market has yet to catch up with emerging markets’ share of the global economy. The evolution of the asset class has created a broad and diversifying opportunity set, making it increasingly likely to find a place in investors’ portfolios. It continues to mature as an asset class with more investors recognising the myriad of different investment opportunities, the competitive risk-reward profile and diversification benefits that the asset class provides.1 Comprises Bahrain, Kuwait, Oman, Qatar, Saudi Arabia and the United Arab Emirates 2 Source: Australian Office of Financial Management: https://www.aofm.gov.au/media/589 3 Mercer European asset allocation report 2010-2021.Download PDFSign Up Now for Full Access to Articles and Podcasts!
Unlock full access to our vast content library by registering as an institutional investor .
Create an accountAlready have an account ? Sign in