Jennison Associates - Mon, 04/22/2024 - 14:11

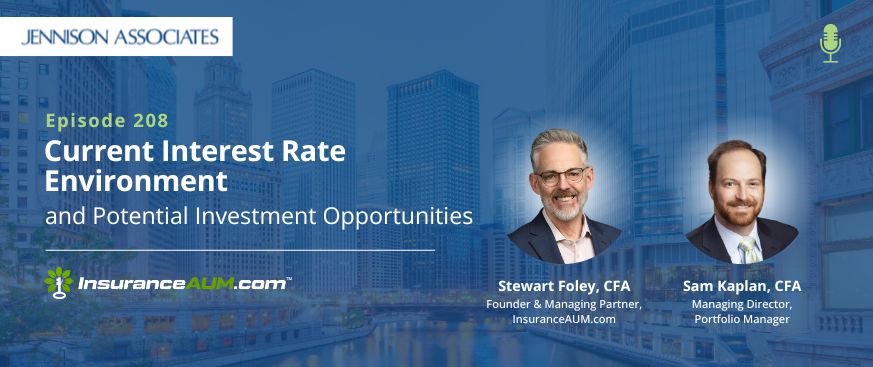
Episode 208: Current Interest Rate Environment and Potential Investment Opportunities

Download Article


Stewart: Welcome to another edition of the InsuranceAUM.com podcast. I'm Stewart Foley. I'll be your host. Thanks so much for joining us again. A special shout out, a couple of them, one to our Executive Council. Mike Huff and Aaron Diefenthaler have graciously decided to co-host or co-chair our event in the symposium this summer. Our Executive Council has been working feverishly on the agenda. There's about now 20 or so senior insurance investment professionals on the Executive Council. They work really, really hard to put together an event that everybody wants to attend. So I want to just say a big shout out to our Executive Council and thanks for all the work that you do and continue to do to help the industry.

With that, speaking of helping the industry, today's topic is straight-up fixed income and yield curve and Fed policy and implications. I couldn't be happier to be joined by Sam Kaplan, CFA, managing director and portfolio manager at Jennison Associates. Sam, thanks so much for being on. I'm a total fixed income geek, and I cannot wait to get going on this.

Sam: Thanks for having me. I'm very excited to discuss fixed income with you.

Stewart: That's great. Before we get going too far, can you tell our audience where you grew up, what was your first job, not the fancy one, and what makes insurance asset management so cool?

Sam: I grew up in New City, New York, not to be confused with New York City. It's a place in Rockland County, which is I guess considered upstate by people who live in the city, but it's about 30 miles north and west of New York City. My first job was actually as a caddy at a Minisceongo Golf Club in Pomona, New York. I was fortuitous in that one of the people I caddied for was a specialist on the floor of the New York Stock Exchange. I told him I was going to business school at Wharton and asked him if he could help me out, and he got me an internship after my freshman year of college working on the floor of the Stock Exchange. That sort of set my career on its path to be in finance.

Stewart: That's fantastic. That's great. We've had a lot of guests on that were former caddies. It's a well-worn path to Wall Street. What do you think makes insurance asset management so cool? Because I think there's a lot of people who are completely misinformed and maybe perhaps ill-guided that think that insurance asset management is boring, but I can attest that it is not. What do you think is cool about this industry?

Sam: I grew up as an athlete. I played soccer my whole life, played in college. I just really liked having a scoreboard in front of me at all times that told me, "Am I winning? Am I losing? What can I do to improve? How can I get better?" Managing portfolios in fixed income and equities, whatever the case may be, being an asset allocator, insurance people who are being asset allocators, there's that scoreboard in front of you at all times. It's not like we're working on a project that takes nine months to a year to complete and you can't really see if you're making progress or not.

A lot of my friends, when we were looking for jobs out of college, they went the investment banking route. After one or two years of being in investment banking, they sort of burned out. They worked on projects, and after nine months of all that hard work, the project fell through and there was no end result. For me, I get to see every day, are the trades that we have on the portfolio working, are they not? I'm re-evaluating stuff every single day. It's just a challenge all the time, which is something that I really enjoy.

Stewart: And the variables change every day, right?

Sam: Yep, every day.

Stewart: Every day.

Sam: There's new information every day.

Stewart: Every day. That's what keeps you coming back. I taught finance, and my summer students are like, "I want to go into investment banking." I'm like, "What's wrong with you? Fixed income, darn it. Fixed income." Speaking of fixed income, so talk to me a little bit about your thoughts on the shape of the yield curve and factors that will drive ongoing normalization, in your mind.

Sam: Well, we certainly are not a normal shape in the yield curve right now. The 2-year Treasury versus the 10-year Treasury has been continuously inverted since early July 2022. It's now the longest inversion on record surpassing a 624-day inversion that started in 1978 and ended in 1980. Typically, when the yield curve is inverted, it's signaling recession. Given how long we've been inverted, given the way that other markets are priced right now with equity markets near all-time highs, credit spreads near all-time tights, the Fed funds market pricing in an as-expected dot plot, which I think we'll get into when we talk about Fed expectations later, this is really the only part of the market that is saying, "Beware. There might be a recession out there." So this interesting dichotomy and this interesting conundrum right now is this yield curve signal that historically has been a very good indicator of recession flashing red falsely right now.

As far as normalization, typically the yield curve is upward-sloping. We think that that's going to continue and that that is the normal curve and that will reach an upward-sloping curve at some point. It's just, what is that path to normalization? Does the economic data take a turn? Do we have this recession that no one is predicting right now? It's very interesting. Last year, pretty much all the economists predicting recession, and it didn't come to fruition. This year, all economists are sort of calling for that soft landing. We'll see if that's the case or not. But there certainly is a scenario that I don't think the market is accurately pricing right now where we could fall into a recession, and if so, the shape of the curve should normalize as the Fed needs to cut rates more fast or more quickly than the market is anticipating right now and the Fed themselves are anticipating right now.

You also have the flip side, and we saw this move in the yield curve at the end of last year, the bear steepener, where front-end rates sort of remain anchored where they are with the Fed no longer hiking, not necessarily cutting rates, maybe doing their base case and doing some fine tune cuts, but front-end rates not moving higher because the Fed isn't hiking anymore. But do long-end rates move higher? You have potentially increased Treasury supply, like we saw last year, a return of term premiums to the market. If inflation is sort of running at the 2% Fed target or slightly above that, does that mean that term premium needs to return so that you'll get compensated for taking duration risks?

These are all things that we think about. I think that over time the curve will continue to move towards that upward-sloping shape. Two 10s at one point last year was minus 100 basis points. It's now only minus 40. I say ‘only minus 40’, but it is 60 basis points deeper than where we were at some points last year. We still think that there's plenty of room for the curve to normalize over time.

Stewart: I'm about to go off on some weird tangent, so just bear with me. It's not a terrible tangent, but just hang on. I was a fixed income guy forever and a day. You talked about the inversion in '78. So Volcker famously broke the back of inflation. At that time, you had this inversion, and it turned out that the trade to make in the face of the inversion was to extend.

I've always thought that in the face of an inversion, it's the hardest trade in fixed income, but to extend and give yield doing it. When you look at this, I think that the traditional view is that when the yield curve is inverted, that the bond market is calling for a recession. Is it possible that there's enough money, enough capital? Because the balance of power, if you will, has changed. Is it possible that there's enough demand out the yield curve to hold those rates down and that potentially that inverted yield curve is not calling for a recession and that it's supply/demand driven?

Sam: That certainly is a possibility, and it's something that we weigh. There has been pretty unsatiable demand for long duration instruments from the pension community, from insurance assets. You've seen some dislocations in the curve as a result of it. There's been pretty large stripping of long Treasury bonds. Basically, investors want to get as much duration as possible. So what they're doing is they're buying a 30-year principal strip, which is no coupon flow for 30 years. You just buy the 30-year bond at a discount, and eventually in 30 years' time you get paid back at par. That extends your duration because you're not getting coupons every 6 months. So you can get a 30-year duration instrument at a pretty steep discount.

As a result, when dealers are stripping those bonds, they are creating coupons across the entire curve every 6 months. As a result, you've seen the spread between principal strips and coupon strips move to all-time-wides. In certain parts of the curve, you can actually pick up 15 to 30 basis points just moving from a principal to a coupon for the same exact cash flow for just a small liquidity give. We actually think that trade is overdone. We think that valuations are at a point right now where it makes sense to be giving up liquidity and then picking that extra yield for a point on the curve where you need to match a liability or you need to get duration. So, yeah, certainly that is a possibility.

That being said, the difference between the '70s and '80s inversion and the one right now is back then rates were double digits, and right now what people are calling a high-yield environment, but at 4%, almost 5%, it's really a normal yield environment. It's really the last decade or so that it was an abnormality with consistently low rates. So that big difference there that back then you could buy something and be earning 10%, 12% yield and you had that cushion, that should rates continue to move higher, that yield that you're getting, that coupon that you're getting would insulate you from that blow.

Whereas now, if you buy a 30-duration instrument at a 4% yield, that's nice in context of what you've gotten for the last decade or so. But should rates move to 6%, 7%, 8%, should the Fed not be able to stem the tide on inflation, should there be a game changer like AI or something else that causes a shift in the markets, you're not getting that extra cushion that you got back in the '70s and '80s. So there's been lots of investors who have been buying duration as yields have been moving up. A lot of those trades are underwater where we sit almost 400 basis points higher on the 10-year than we were from the low yields of 2020. We're only 60 basis points off the high yields in 10s that we reached last year when 10s hit 5%.

There is a world where long-end rates continue to move higher, front-end rates stay where they are or maybe come down a little bit as the Fed moves more towards a less restrictive policy stance if you believe that neutral rate is still somewhere in the mid-2s. So it is a possibility that the right trade is to extend and give up yield and be long duration here.

That being said, if you look at the history of yields, the cycle tends to be very long. As we mentioned in the '70s and '80s, rates sold off for decades. Since then and when we reached the peak in the '80s, we were in a 40-year bond bull market. We've only been selling off in yields for 2 years. So it certainly could be where this is sort of a counter and the bond bull market resumes. But given the fact that we reached almost zero rates across the curve or sub-1 rates across the curve, it's pretty hard to say that the bond bull market is going to continue. So we as investors don't typically make duration calls because we think it's a hard thing to do. Certainly, it might be the right trade to get long duration here and extend, but I can't really guarantee that or forecast that with the amount of certainty that I think I can from an aspect of the yield curve normalizing over a shorter period of time.

Stewart: That's awesome. I would just say to our audience, fixed income geeks, buckle up. We're just getting started. So just to remind everybody, Sam Kaplan, yield curve at Jennison Associates. I'm going to show my age. When I was early in my career, one of the assets that we had was a US Treasury that was in bearer format, and it literally had the coupons clipped off of it. It was in our vault, and it was on paper that felt like money. I was like, "This is like a prehistoric... this is like a museum piece, literally." It was so cool. I want to be mindful of our time here. Talk a little bit about relative value opportunities and dislocations along the yield curve in US Treasuries right now.

Sam: One of them that I mentioned already was that spread between principals and coupon strips in the long end of the market. We think there's lots of opportunity there to give up a little bit of liquidity but pick up that extra yield. The other aspect is just the 20-year point of the Treasury curve. Since the end of 2021, the 20-year point has actually yielded more than both the 10-year and the 30-year point of the Treasury curve.

Now, there were some technical factors for that. As you remember back in May of 2020, the Treasury reintroduced an on-the-run Treasuries point that they hadn't issued for a long time. As COVID fiscal stimulus was brought to bear, the Treasury needed to increase issuance across the curve. They did so, and they actually increased the 20-year point disproportionately more than other points on the curve. So you factor in the fact that it's a newish on-the-run point, not as liquid as your typical 10-year or 30-year, plus they increased supply with not a lot of end user demand for that point on the curve at the time. Then you got an uptick in global rate volatility, and you had a lot of macro hedge funds, fast-money-type investors who were along the 20-year point who got tapped on the shoulder and said, "Get out of your position."

When that happened, the 20-year point cheapened up dramatically. There was one day, I remember, when it was late 2021 where the 10-year yield was unchanged on the day, the 30-year yield was unchanged on the day, and the 20-year yield was 6 basis points higher. Since that dislocation, you've actually seen it persist in various forms. The 20-year to this day is still higher than the 30-year by about 10 basis points. It's higher than the 10-year by about 25 basis points. At its peak, it reached about a pick of 60 basis points versus 10s and 30s, if you looked at it on a butterfly.

The technicals have flipped positive. You now have a Treasury that at one point was cutting issuance, and they cut the 20-year point more than they did everywhere else. Recently, they started raising issuance again, but they left the 20-year point alone and increased the amount of 10s and 30s that they were offering. From a valuation perspective, we went over that, 20s remained cheap versus 10s and 30s. You also have the Treasury bringing a buyback program, which they just tested last week and are going to start implementing on a bigger scale in the next coming months. We think they're going to target that off-the-run 20-year point. Because if you can buy back debt that's yielding higher than 10s and 30s and then issue debt that's lower yielding, you're going to save on interest expense. So that 20-year point has started to perform. It actually is tighter versus 10s and 30s, so it's outperformed 10s and 30s year-to-date by about 5 basis points or so. We think that will continue until you get to a more normal valuation.

Stewart: That's really an interesting analysis, and thank you for that. Can you give me your thoughts about increasing Treasury issuance and the impact it might have on yields?

Sam: One of the big topics de jure right now is federal debt. As a percentage of GDP, it's about 122% right now. It's a record outside of the COVID pandemic, which was a time when we were in recession. Obviously, we needed to increase issuance and increase debt as a percentage of GDP to make sure that the economy and the world can continue functioning. The CBO right now is projecting that debt's going to rise as a percentage of GDP to 166% in the next 30 years. Not to get into politics on a podcast about fixed income, but it seems neither political party has any intention or is able to reduce debt by either cutting spending or increasing taxes in revenues.

At some point the market might force politicians' hands. You actually saw that in Britain in late 2022 when they brought their budget plan to the market and the gilt over the span of 5 days went from a 3.75% yield to a 5% yield. On September 22nd, 30-year gilts were yielding 3.75%. On September 27th, they closed yielding 5%. That caused Liz Truss to resign and no longer be the prime minister of Great Britain. Not to say that we're going to have a president of the United States resign because of a move in Treasury yields, but you certainly could see... I guess the term was bond vigilantes back in the '70s and '80s come back to the market and cause some consternation as far as yields, especially out the curve. Until then, at a minimum, we did see a little bit of a return of term premium last year. Term premium turned positive before going negative again.

Your question about, should investors extend when giving up yield? Part of me wants to argue that, why take that duration risk when you're not getting any kind of term premium? You're locking up your capital for a longer period of time and not getting any gain or any benefit from it. I would think that over time that term premium would return to the market because of increased volatility, because of that duration risk that people are now taking. So, again, not to go back to... I guess to tie it all together, does the curve normalize in that bear fashion where long-end rates move higher with the front-end staying where it is just because of a return to term premium to the market?

Stewart: Talk to me a little bit about your view on the level of yields and where yields go over the next year or even, if you dare, longer. I laugh as a guy that used to run a bunch of fixed income and it's just like, "Oh." It's just so challenging to have a view here, but the thing I love is that you're willing to come out and talk about it. 
Sam: I'll give the usual caveat that it's hard, as you mentioned, to predict the level of yields. The cycle for the level of yields typically lasts a lot longer than people anticipate. As I mentioned earlier, to a large portion of investors who began their career after the GFC, this is considered a high-rate environment, but for many others, this is just a normal level of yields.

Right now, there's a very interesting dynamic in the sense that you have increased or continued fiscal stimulus and, as a result, increased Treasury supply. On the other side, you have what we think is tight monetary policy. There's the potential that the Fed is going to cut rates and monetary policy might get easier, but for now, the Fed thinks that we're in pretty restrictive territory. You also have quantitative tightening going on in the background separate from just the high level of yields. So we really are in a period where I think that the level of yields is truly dependent on how the economy unfolds and what the data will tell us going forward. When the Fed says they're data dependent, for the first time in a while I actually believe them.

So it really is a hard time to predict the level of rates because you can get a payroll print like we got last Friday or a CPI print like we're going to get tomorrow, and all of a sudden everything has changed and the expected level of rates is going to change, and it can change pretty dramatically. So I think there will be continued increased rate volatility as we've witnessed over the last year or so. We also, again, not to get into politics, have an election coming up in November. Depending on the outcome, there could be a large impact on the level of rates. There's certainly one candidate who, I think, would like to reduce taxes or keep that reduction in taxes. If there is a further reduction in taxes, that probably leads to an increased deficit and increased Treasury supply which could affect the level of rates.

You mentioned longer term. I mean, that's a tough one. There's lots of factors that are pushing and pulling on the level of rates. There's obviously fiscal policy. There's the potential de-globalization that we've potentially witnessed and experienced since the rise of COVID. You have an aging and declining supply of labor. All those factors are inflationary and should lead towards higher rates out the curve. On the flip side, you have quantitative tightening going on. You have tighter credit conditions due to higher rates. You also have increased productivity from AI. Those are all deflationary. So it's really hard to know if the neutral rate that the Fed has forecasted for a long time at around 2.5% is that neutral rate. It's really hard to know if we are at a truly restrictive level of policy. If we are, is it taking that much longer for monetary policy to work in this environment?

So I don't want to hazard a guess. I don't want to go on the record and say, "No, the 10-year is going to be at this level at the end of the year or in 3 years' time,” because I'll unquestionably be wrong. But what I would say is that I do think that there's going to be an increased level of volatility and that the range of outcomes is certainly higher than it has been in a long period of time.

Stewart: Those are all great points. What is your opinion on Fed expectations and drivers of rate cuts going forward?

Sam: As of today, the market is currently pricing in 67 basis points of interest rate cuts by the end of 2024. The Fed themselves, at their most recent dot plot or projection of expectations, in March said the base case was 75 basis points of cuts. The range this year, the market has priced it anywhere from 7 cuts to 2 cuts. Again, that points towards that increased volatility. I guess right now, and again, the Fed dot plot also assumed that core PCE would moderate to 2.6% by the end of the year from its current 2.8% level at the end of February, and GDP would moderate to positive 2.1% for the full 2024 from that 3.4% level that we saw at the end of 2023.

So the Fed is telling you that if inflation remains above their target but continues to moderate somewhat this year and GDP is still positive, not going into a recession but moderating from the increased levels that we saw in 2023, they're going to cut rates slightly, about 75 basis points, give or take. They're still going to be in restrictive territory, but given the fact that they've made so much progress on inflation, they don't need to be as restrictive as they have been for the last year or so.

Stewart: Let me ask you if you could do a little teaching while we're on here. Because when you started your answer, you said the market is pricing in 67 basis points of Fed cut. A lot of times, there's younger people earlier in their careers or whatever it may be, and a little explanation is helpful. Can you just deconstruct how you're getting to that number, and what you're looking at? I think there's a good opportunity to learn a little bit here.

Sam: I agree. There are Fed funds futures contracts for each month. The way that those trade is they trade on a dollar price, and the yield that is assumed for that month on the Fed fund rate is 100 minus the dollar price of that contract. So if you look at the June contract and it's pricing in a yield on Fed funds futures of 520, given the current level of rates is 533, you can price in a probability of a 25 basis point cut at any point in time based on what that price is. If you look all the way out to the December contract of this year, the current pricing is 67 basis points as of about an hour ago. Given volatility in the markets, it might've changed, but when I last looked, it was about 67 basis points.

Stewart: That's really helpful. Thank you.

Sam: So looking at those contracts, you can at any point in time say, "This is what the market is expecting," and compare that to what the Fed has told you they expect to do should certain economic conditions be met. The way that I look at the Fed funds futures market is it's not a certainty. They're not pricing in 100% probability that the Fed is going to cut at this point in time. Or even if... Let's say that example that I gave that June was implying a 50% probability that the Fed is going to cut 25 basis points. There also is the potential, as we've witnessed in the past, that the Fed cuts 50 basis points or 100 basis points should they need to.

During the COVID pandemic, they cut rates 100 basis points, I think, or 75 basis points in one clip because of the emergency situation. Not to say, again, that that's going to happen anytime soon, but that is a possibility that that could happen. Should we get a hard landing, a recessionary scenario where the data turns very quickly, all of a sudden the unemployment rate spikes, GDP turns negative, I think the Fed would act in that manner again. Maybe not cut rates all the way to zero like they have in the past, but they certainly would cut aggressively and quickly, and we wouldn't just see a 25 basis point rate cut at that time.

So what the Fed Funds futures market is telling me is that that market is basically pricing in zero chance of a recession this year. You couple that with equities are at an all-time high, as I mentioned, corporate spread's at an all-time tight set. The market is basically guaranteeing a Goldilocks scenario, a soft landing scenario, which is in direct competition with that yield curve that we mentioned that is inverted and typically has pointed to a recession.

So this is the conundrum right now that I think investors are facing is, which signal is right? If you look at the economic data, it's also painting a picture of either potential possibility. The unemployment rate remains low, job gains remain strong, GDP remains positive. But then you look at some of the ISM data and it's below 50. You look at small business optimism, which just came out this morning, and it's the lowest it's been in four years since the height of the pandemic. Credit card delinquencies are at recent highs since the global financial crisis. Subprime auto loan delinquencies are high. Basically, we're in this environment right now where the people who are bullish on the economy can point to lots of different things and say that they're right, and the people who are bearish on the economy can also point to lots of different things and say that they're going to be right. I didn't even mention commercial real estate and private debt, which are both potentially going through some issues right now.

What this all leads me to is, again, just increased volatility because any data point can point towards something in the opposite direction, and there's something for the bulls and there's something for the bears right now. Eventually, that data is going to coalesce around one of those scenarios. When that does, you're going to see half the market that is bulled up try and reduce their positions, or you're going to see half the market that is beared up try and change their positions. That's going to lead to a pretty big shift, I think, in the level of rates, the shape of the curve, equity prices, the level of credit spreads.

In sum, I think that if you look at the Fed dot plot, the one thing that has been consistent is their projections going forward have not been realized because something has changed in that interim. I think even though the Fed is projecting 75 basis points of cuts right now, and that certainly could be what transpires by the end of this year, there's also some probability or some likelihood that that's not going to happen. The Fed might not cut at all, or the Fed might cut 200 basis points. I think there's lots of possibilities that are out there right now, and given that, there's just lots of potential volatility in the market.

Stewart: Sam, I've had so much fun having you on. This has been an absolute practitioners fixed income geek... It just warms my heart. I love this stuff. I've got a couple of fun ones for you out the door. What is a piece of advice that you've gotten in your career that you think is worth sharing with our audience? And who would you most like to have lunch with alive or dead? You can take either question or both. Lots of our guests take both. No pressure.

Sam: I was told there might be a fun fact question. Is that still up for possibility as well or no?

Stewart: Yeah, you can. Yeah, sure.

Sam: Okay.

Stewart: I'll do that. What is a fun fact?

Sam: I could do all three. I just don't want to go too long.

Stewart: No, no. Hey, listen, whatever floats your boat. We're brothers in fixed income for heaven's sake. So let's go ahead. What's the fun fact, first of all?

Sam: My fun fact is that I have a current 2,150-day streak of completing the New York Times crossword puzzle-

Stewart: Wow.

Sam: ... which is coming up on 6 years. The New York Times doesn't keep track or publish the longest active streaks. But there was an article on the 50th anniversary of the crossword puzzle at the end of last year. In that, Will Shortz, the editor, answered a question about a streak and said several hundred people but certainly less than a thousand have a streak longer than 1,780 days. So I am in that several hundred less than a thousand people.

Stewart: Wow, good for you. Congratulations. That's awesome.

Sam: Yeah.

Stewart: How about, let's go with, who would you most like to have lunch with alive or dead? I would think that if you're a crossword puzzle person, this is going to be an interesting answer.

Sam: Well, if I'm being honest, the person that I would most like to have lunch with is my mom, Ellen Kaplan, who passed away in June of 2022. She and I were very close. She molded me into the person that I am today. She was a psychologist who knew how to get the best out of people. She also knew how to manipulate people very well. One day when I was 13 years old, she came into my room and said that she thought it would be a good idea for me to get my ear pierced. She thought I would look very good with my ear pierced. I said, from that day on, I never wanted to get my ear pierced. I don't know if that was her way of doing reverse psychology or not, but it certainly worked if that was her intention.

She told me growing up that she used to look up to the heavens and say to her mom, "Mom, you were so right about how hard it is to raise children and have a family and have work-life balance and be successful." I'd like to be able to tell her the same thing, that having a family and work-life balance and living life is a joy. But at the same time, I want to apologize to her for maybe all the hardships and hard times that I've given her. I'd also just like to share with her how her grandkids are doing. Because she was the glue of the family. She was the one who made sure that we were always getting together with grandparents and cousins and aunts and uncles. I really would just want to spend that time with her and show her how her grandkids have grown up over the last couple of years.

Stewart: That is really touching and sincere, and I really appreciate you sharing that. I can tell how much she means to you, and that is really awesome. Thank you so much for giving us a thorough walk through the fixed income garden on yield curve and positioning and Fed expectations and so on and so forth. I've really enjoyed it, and I've really enjoyed getting to know you as well. So thanks so much for being on.

Sam: Thank you. This was a lot of fun. Yeah, I'm not scared to do a second podcast after my original foray.

Stewart: Yeah, this is your debut. You did a great job, man. Everybody will think so. Well done. We've been joined today by Sam Kaplan, CFA, managing director and portfolio manager at Jennison Associates. Thanks for listening. We have a tremendously loyal fan base and appreciate each and every one of you. Thank you so much. If you have ideas for podcasts, please shoot me a note. It's stewart@insuranceaum.com. My name's Stewart Foley, and this is the InsuranceAUM.com podcast.

Sign Up Now for Full Access to Articles and Podcasts!

Unlock full access to our vast content library by registering as an institutional investor .

Create an account

Already have an account ? Sign in