Global fixed income allocations already include EM debt – why allocate separately?

The mighty ‘Global Agg’
Over the 50 years since they were conceived, Bloomberg’s Fixed Income Indices have grown to become a dominant force in fixed income markets – today they’re tracked by over US$5 trillion of assets globally. Within this suite of indices, the Bloomberg Global Aggregate (the ‘Global Agg’) – comprising debt issued by sovereigns and corporates – is the most widely followed global fixed income index, with a market value of US$59 trillion.
The Global Agg has a relatively sizable exposure to emerging market (EM) debt, with EM countries accounting for almost 16% of the index.1 This often leads investors to believe that their investments in funds tracking the Global Agg give them appropriate and adequate EM exposure, not least since most of the emerging markets in the Global Agg are also found in JP Morgan’s flagship EM debt indices. However, there are various ways in which the EM component of the Global Agg does not fully represent the breadth and diversification of EM issuers, suggesting that a dedicated EM allocation is vital for those seeking meaningful exposure to the full EM debt opportunity set, in our view.
Missing (EM) pieces
Credit-rating and concentration considerations
Perhaps the most obvious argument in favour of a dedicated EM allocation is that the Global Agg only includes investment-grade debt. In contrast, the leading pure EM debt indices span the credit-rating spectrum, thus providing greater opportunities for diversification and yield enhancement from high-yield markets.
Another important consideration relates to the way the benchmarks are built. The Global Agg is constructed based on the market capitalisation of the constituent bonds, resulting in a greater allocation to the most indebted issuers. In contrast, the JP Morgan indices tend to cap exposure to countries to reduce concentration risk, thus providing investors with more diversified exposure. The result is that the Global Agg does not give a very representative exposure to emerging markets, nor one which, in our opinion, truly captures the opportunities in EM debt.
Skewed towards Asia
To illustrate the impact of different index construction approaches, Figure 1 compares the EM portion of the Global Agg with JP Morgan’s Emerging Market Hard Currency/Local Currency 50-50 index (referred to in this paper as 'EM 50-50 Blend index'), which we feel is most representative of the broad EM debt universe.2 To make the comparison clearer, we have scaled up the EM portion of the Global Agg to 100%.
A key realisation when looking at the EM portion of the Global Agg is that China accounts for almost two thirds of the index, with Asia as a whole accounting for 83%. Meanwhile, the JP Morgan EM 50-50 Blend index has less than 8% exposure to China, and only 35% exposure to Asia. The Global Agg is therefore heavily overweight Asia and underweight other EM regions, particularly Latin America and the Middle East – which have very different return drivers to Asia and could offer significant diversification benefits.
Figure 1: Country breakdown of the EM exposure in the Global Agg relative to the JPMorgan EM 50-50 Blend index
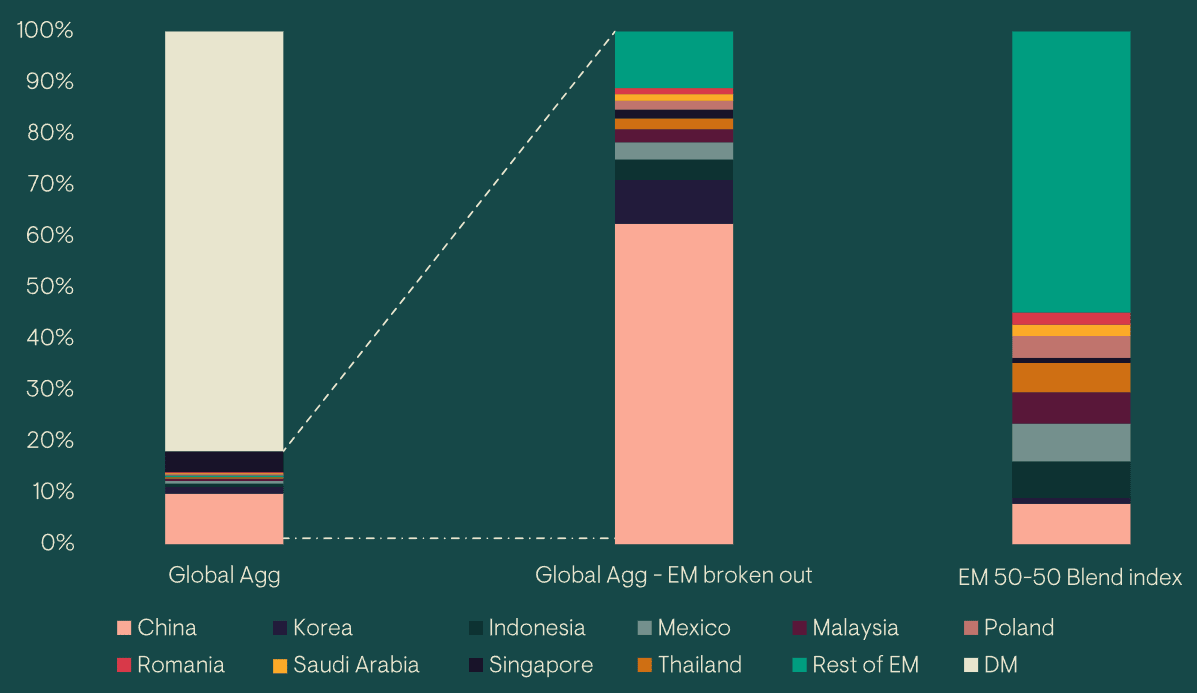
Source: Bloomberg, JP Morgan as at end October 2023. For further information on indices, please see the Important information section.
When it comes to currency exposure, the JP Morgan 50-50 EM Blend index we consider is, by definition, 50% exposed to US dollars, and (due to the way countries are capped in the JP Morgan index), the following currencies all come in between 4% and 5%: Chinese renminbi, Indonesian rupiah, Malaysian ringgit, Mexican peso, Thai baht, Brazilian real and South African rand. By contrast, within the Global Agg’s EM component, the largest currency exposure is Chinese renminbi (59%) followed by US dollars (14%), Korean won (7%), euro (4%) and Indonesian rupiah (3%). Again, there is a clear bias towards Asia within the currency exposure of the Global Agg. Particularly in a year like 2023, when Asian currencies underperformed the overall EM FX market, investors would have benefitted from more diversified FX exposure than that offered by the Global Agg.
Underweight corporates
A foible of the Global Agg is that it has not kept up with the rapid growth of the EM corporate debt universe. In the past decade, the market has become a lot more diversified — it now gives investors access to a broad range of opportunities, spanning sectors and covering regions as diverse as Latin America and the Middle East. While EM corporate debt makes up a large portion (25%) of the JP Morgan EM 50-50 Blend index, corporates make up less than 5% of the Global Agg’s EM exposure. Consequently, the Global Agg is significantly underexposed to a segment of the EM debt universe that has exhibited dramatic growth over the last decade and provides exposure to high-quality global companies, often with better credit metrics than their developed-market (DM) peers. Having lived through repeated periods of volatility, EM companies tend to adhere to a culture of retaining cash for a rainy day, while not overstretching themselves in terms of the debt they take on; as a result, they often have lower leverage than their DM peers at the same credit rating.
Implications for investors
Investment characteristics
To analyse the impact of the difference in composition between the two indices, we examined some characteristics at a total index level. Being an investment-grade only index with a developed-market skew, the yield on the Global Agg is significantly lower than the yield on the JP Morgan EM 50-50 Blend index. At the same time, the duration of the EM 50-50 blend index is lower, meaning that it is less exposed to interest-rate volatility. It is also worth noting that, despite the exposure to high-yield issuers, the EM 50-50 Blend index still has an overall credit rating that is investment grade.
Table 1: Index characteristics comparison
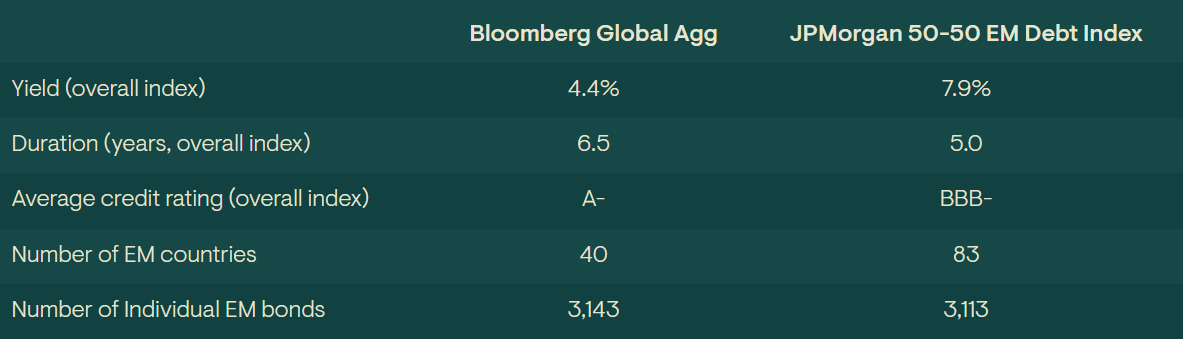
Source: Bloomberg, JP Morgan as at end October 2023. For further information on indices, please see the Important information section.
Returns
The factors above have also had a material impact on performance and, over the long term at least, the Global Agg’s performance has lagged that of the JP Morgan blend index. As Figure 2 shows, over the last two decades (the furthest back we can gather data for the EM 50-50 Blend index) the Global Agg has returned a cumulative 65% (2.4% per annum) while the EM 50-50 Blend index has returned 200% (5.4% per annum). Not only has the EM 50-50 Blend index outperformed the Global Agg over time, it has done so consistently, outperforming in 80% of rolling three-year periods using monthly observations. While volatility of the EM 50-50 Blend index has been higher, it has still outperformed the Global Agg on a risk-adjusted basis, achieving a Sharpe ratio of 0.54 versus 0.39 for the Global Agg.
Figure 2: Performance of the Bloomberg Global Aggregate and JP Morgan 50-50 EM Debt Indices (2002-2023)
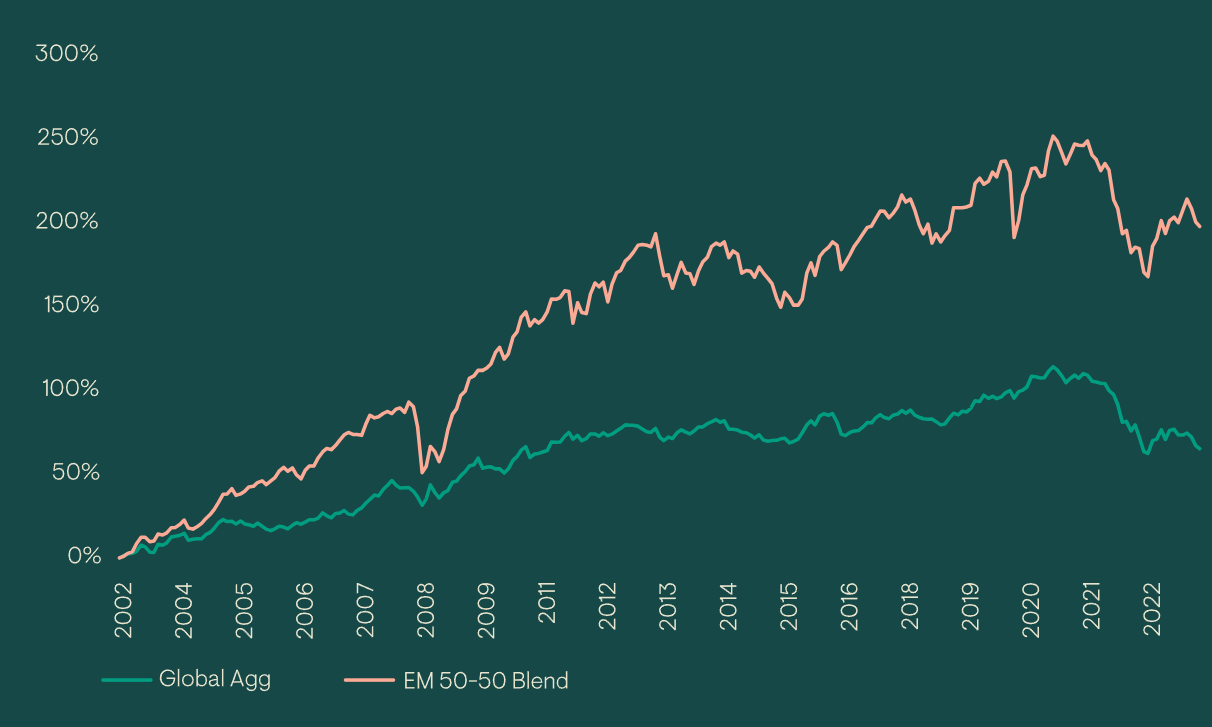
Source: Bloomberg, JP Morgan as at end October 2023.
Correlations
It is also instructive to consider correlations with major fixed income and equity markets. While both indices have relatively low correlations to high-yield corporate debt, global equities, and the S&P 500, the Global Agg naturally has a higher correlation to US and European government bonds. As a result, the 50-50 EM Blend index is likely to provide greater diversification benefits to a broad fixed income portfolio. The correlation of the 50-50 EM Blend Index to the Global Agg is also an important consideration. With a correlation of 0.89, the allocations behave in a similar enough manner to be considered in the same risk bucket, but the return outcomes are differentiated enough to warrant a stand alone allocation to EM.
Table 2: Correlations comparison
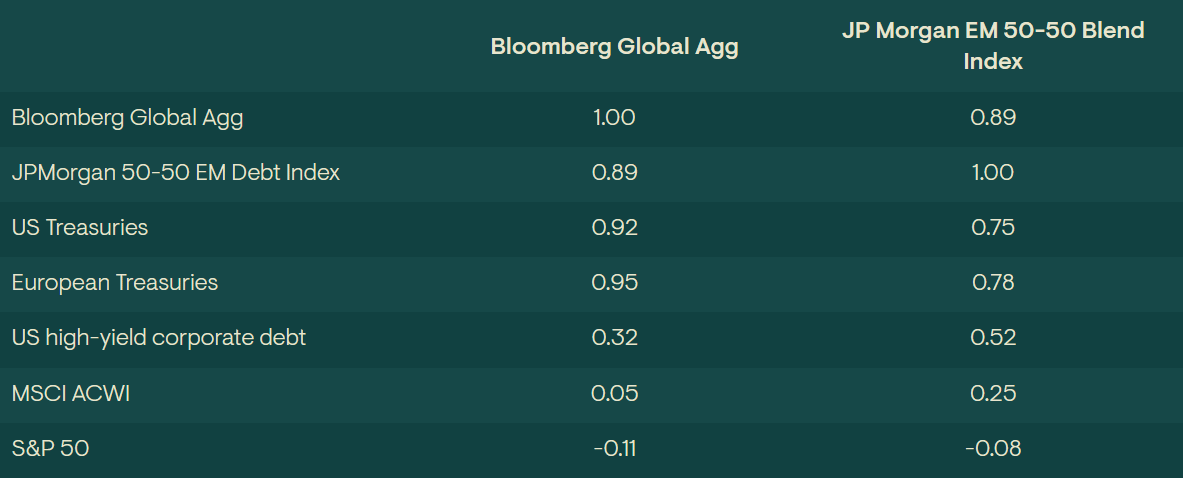
Source: Bloomberg, JP Morgan as at end October 2023. US Treasuries: Bloomberg US Treasury Index; European Treasuries: Bloomberg Pan European Aggregate Treasury Index; US high-yield corporate debt: Bloomberg US Corporate High Yield Index. For further information on indices, please see the Important information section.
Opportunities for active managers and tailored investable universes
While this paper has focused on an index comparison, it is important to note – as we argue in a separate paper – that an active approach is vital when investing in EM debt. Not only does this allow managers the flexibility to pursue the fullest opportunity set, it also offers multiple alpha capture opportunities across this inefficient and highly diverse investment universe. In particular, a blended debt portfolio – like the 50/50 universe considered in this paper – provides both top-down and bottom-up alpha capture opportunities for skilled active managers, given the varied behaviour of individual asset classes across the cycle and the large dispersion across markets that sit within these. In addition, the sheer breadth of the full EM debt opportunity set means investors can tailor the universe to exclude or cap exposure to certain countries of concern, according to their own investment policies.
In summary
Although the most widely followed global bond index – the Global Agg – includes various EM debt markets, investors seeking strategic EM debt exposure should be aware of the index’s shortcomings. Firstly, the EM component of the index is highly undiversified, with Asia accounting for over 80% and almost two thirds represented by China, while the renminbi makes up nearly 60% of the EM currency exposure. Secondly, the EM portion of the Global Agg is also heavily underexposed to corporate debt, and the majority of the allocation that it does have is in Asian and Chinese companies. Furthermore, the Global Agg is purely focused on investment-grade debt and so lacks the potential diversification and yield-enhancement benefits that high-yield markets can offer. All of these factors explain why the EM component of the Global Agg has significantly lagged the performance of the leading dedicated EM bond index and why it has exhibited higher correlations with US and European government bonds. In contrast, a dedicated allocation to the JPMorgan EM 50-50 Blend index would have provided greater diversification, higher yield, lower duration risk and superior long-term performance. Taken together, we believe that there are strong arguments for investors tracking the Global Agg to make a stand-alone allocation to EM debt which is more representative of the broader opportunity set and potential. However, an active approach is vital in this highly diverse investment universe, in our view.
1 All data in this paper, including both index stats and performance, is as of 31 October 2023.
2 The JP Morgan Hard Currency/Local Currency 50-50 index has a 50% exposure to EM Local Currency Debt (the JP Morgan GBI-EM GD equivalent), 25% exposure to Sovereign Hard Currency Debt (the JP Morgan EMBI GD equivalent) and 25% exposure to Corporate Hard Currency Debt (the JP Morgan CEMBI BD equivalent). EM local currency debt is by far the largest component of the universe and EM hard currency debt, while smaller, comprises a much wider range of countries and has a much longer history. Furthermore, the hard currency component is evenly split between sovereigns (including quasi-sovereign debt) and corporates which, again, is somewhat reflective of the general size of the sovereign and corporate universe.
General risks. The value of investments, and any income generated from them, can fall as well as rise. Past performance does not predict future returns, losses may be made. Environmental, social or governance related risk events or factors, if they occur, could cause a negative impact on the value of investments.
Specific risks. Default: There is a risk that the issuers of fixed income investments (e.g. bonds) may not be able to meet interest payments nor repay the money they have borrowed. The worse the credit quality of the issuer, the greater the risk of default and therefore investment loss. Interest rate: The value of fixed income investments (e.g. bonds) tends to decrease when interest rates rise. Emerging market (inc. China): These markets carry a higher risk of financial loss than more developed markets as they may have less developed legal, political, economic or other systems.
Sign Up Now for Full Access to Articles and Podcasts!
Unlock full access to our vast content library by registering as an institutional investor .
Create an accountAlready have an account ? Sign in