
Grabbing the Bull by the Tail: Assessing Tail Risks Amid Complexity

Views on the probability of a U.S. recession have rarely been so diverse, and market pricing continues to rapidly shift in response to surprising economic data and geopolitical events.
While this market dynamic encapsulates the rationale behind our scenario-based approach to forecasting, the complexity of the macro environment warrants a comprehensive assessment of the full distribution of market probabilities. Indeed, the new macro paradigm provides ongoing reminders that low-probability events—positive and negative—can materialize with game-changing effects.1
As a case study into our assessment of tail risks, the following discusses how the market-implied probability distribution for a recession has evolved over the past year. We consequently turn to the market pricing of potential outcomes and what that says about the likelihood of a recession going forward.
What can the U.S. bond market tell us? "Higher for longer” and other possible scenarios
After the Federal Reserve’s string of 75 bps rate hikes, it moderated the pace of its increases in the first half of 2023. That moderation marked an important inflection point: market volatility abated, credit spreads tightened, equities rallied, and 10-year Treasury yields stabilized between 3.5 and 4%.
As 2023 progressed, resilient data, increased Treasury issuance, shifting expectations for the term premium, and a repricing of the neutral rate boosted Treasury yields to new highs. Now, the Fed finds itself at or near the end of its aggressive tightening cycle, and investors have embraced the notion that rates may stay higher for longer. With that, they’ve priced out a return to the last decade’s ultra-low interest rates as they coalesce in the left tail of the market-implied probability distribution.
What can we glean from these market-based expectations?
Forward contracts provide a single-point estimate of the underlying asset price at a future date (contract expiry). By contrast, option markets reveal information at multiple strike prices, which allows us to extract a probability distribution of possible market outcomes.
For example, Figure 1a shows the option-implied probability distribution of 3-month Treasury bill yields one year ahead.2 The shift in the distribution not only demonstrates the declining expectations for a recession, but we can also extrapolate the factors driving the changing expectations.
- In October 2022, the fat tails of the distributions (light blue line) reflected high macroeconomic risk and poor market sentiment following the war in Ukraine.
- By February 2023, the distribution had narrowed (dark blue line). Despite Fed tightening, the U.S. economy remained resilient and the Fed had begun to signal more moderate rate hikes ahead.
- Tails widened again in March 2023 (yellow line) as the regional banking turmoil made investors consider whether market fragilities would push the U.S. economy into recession.
- As turmoil abated, investors gained confidence that the economy could weather higher levels of interest rates. Rates markets priced further Fed hikes. The implied distribution shifted to the right (shaded light blue), but with a clear skew to the left due to ongoing concerns about a U.S. recession and the associated policy rate cuts. It now implies marginally lower 3-month U.S. Treasury yields by October 2024 (Figure 1b).
Figure 1A: The right shift in the implied probability distribution for U.S. 3-month yields 1-year ahead (%).
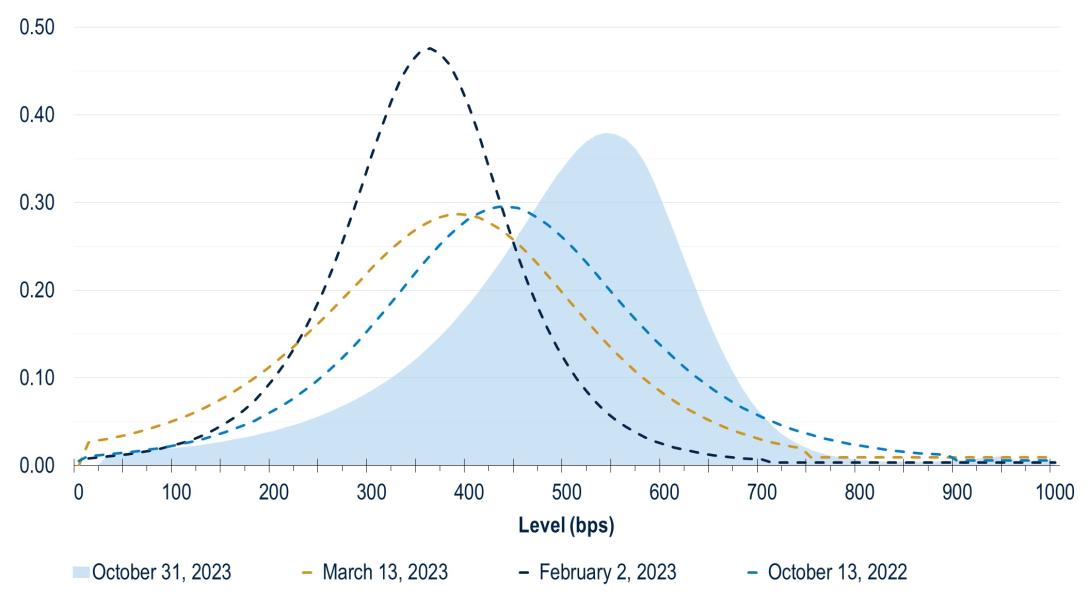
Figure 1B: The options market expects 3-month yields to fall slightly in the year ahead (%).
Source: Barclays, Bloomberg, PGIM Fixed Income as of October 31, 2023.
Looking further out on the curve, the probability distribution for 10-year yields (Figure 2a) has shifted in much the same way. Interestingly, however, changes in the 10-year distribution are more noticeable in the right tail.
- The October 2022 trough in risk appetite coincided with a 2022 high in real U.S. interest rates (light blue line).
- Between October 2022 and February 2023, investors gained confidence in the Fed’s ability to control inflation. That shifted the distribution of expected U.S. 10-year Treasury yields to the left, with a narrower right tail (dark blue line).
- Today, that distribution is again skewed more towards higher yields on the right (shaded light blue). We believe it’s a clear indication that the market is coming to terms with the new regime of higher rates and steeper yield curve.
Figure 2A: The implied distribution of expected U.S. 10-year yields has also shifted to the right, i.e., higher yields (%).
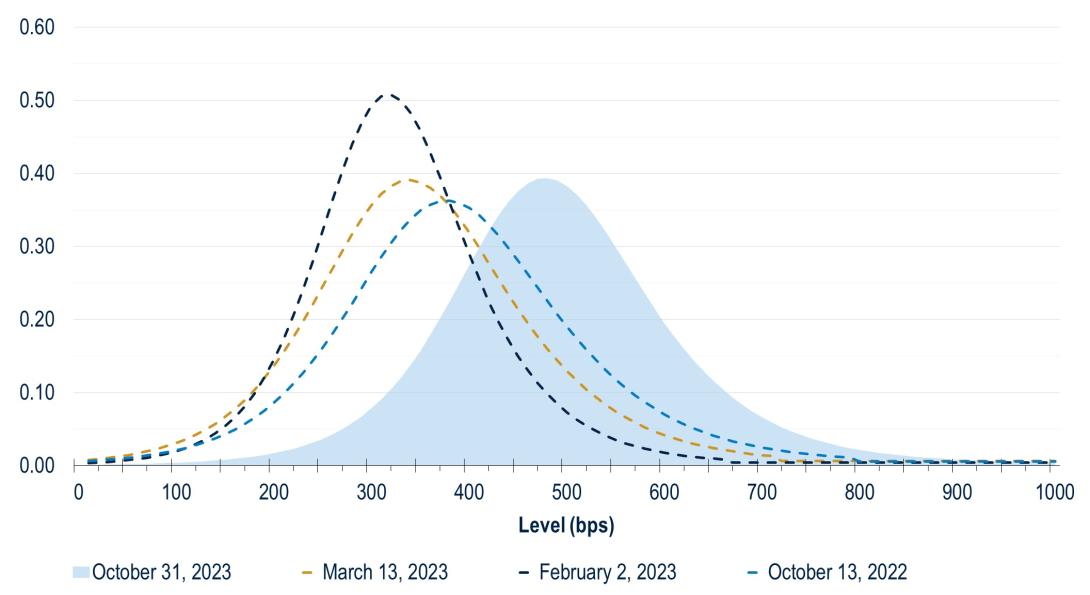
Figure 2B: The options market has embraced that U.S. 10-year rates may stay higher for longer and result in a steeper curve (%).

Source: Barclays, Bloomberg, PGIM Fixed Income as of October 31, 2023.
What does the U.S. bond market tell us about the risk of a recession?
Figure 3 looks at the behavior of 3-month Treasury bills around periods of U.S. recessions as defined by the National Bureau of Economic Research. At each of the past 11 recession start dates, we index the 3-month yield to 0. We then consider how that yield evolved around the start date for each recession.
Figure 3: The peak-to-trough decline in U.S. 3-month yields during recessions has been 233 bps on average.
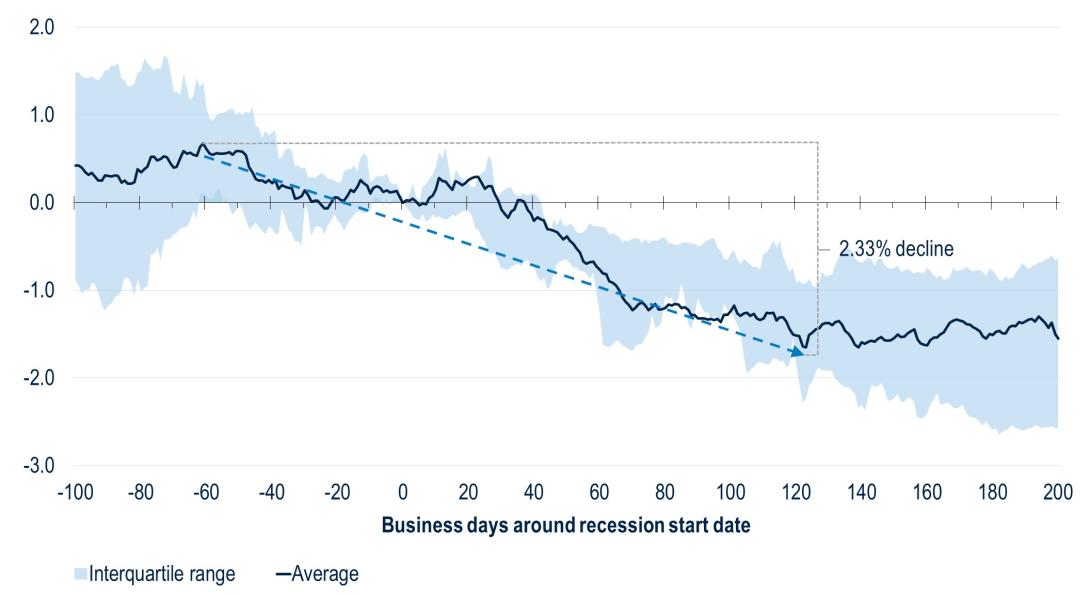
Source: Bloomberg, PGIM Fixed Income as of October 31, 2023.
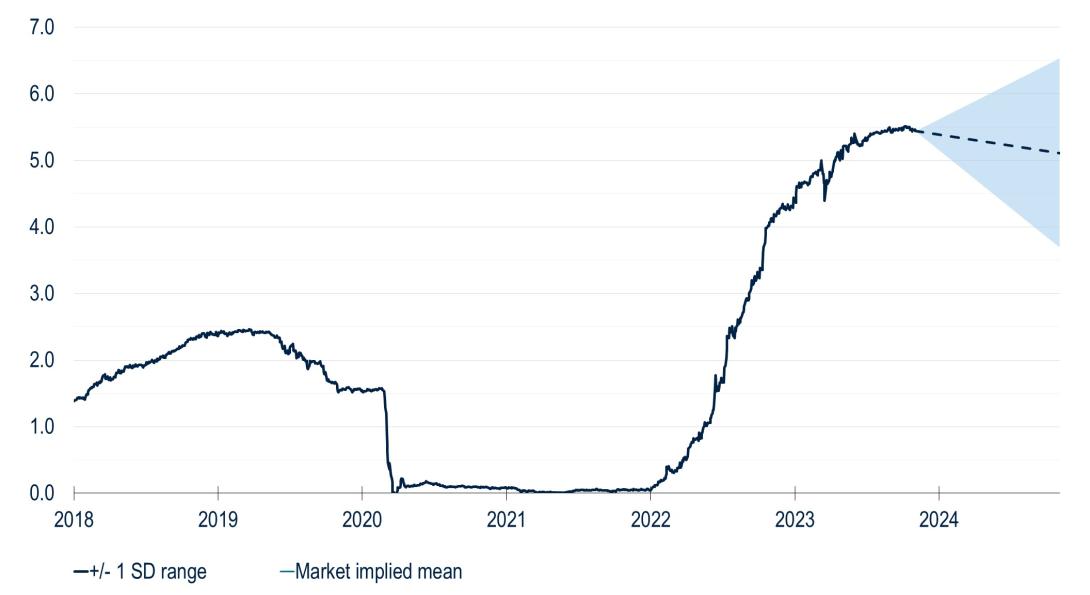
On average, the peak-to-trough decline in 3-month Treasury yields around recessions has been 233 bps. From the most recent peak level of 5.51%, this would imply a yield of 3.18%.
As per Figure 1a, however, markets attach a mere 15% probability to the 3-month Treasury yield falling below this 3.18% threshold, a drop of two-thirds from the 44% probability in early May (Figure 4). In other words, markets have “priced out” significant policy easing over the next 12 months.
Figure 4: The option-implied downside probability, based on 3-month Treasury yields, has fallen considerably since April (%).
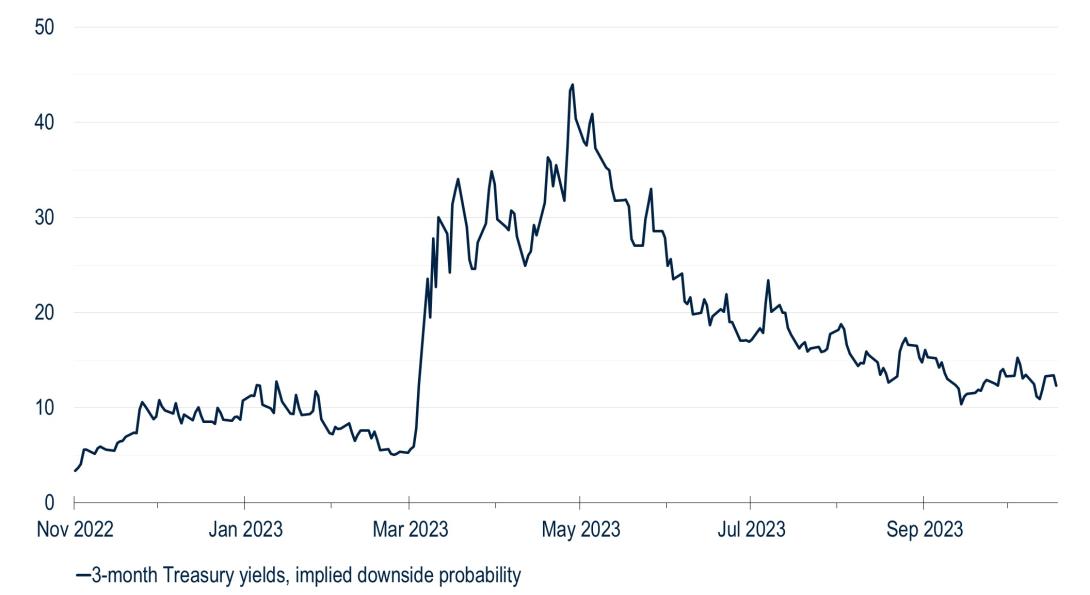
Source: PGIM Fixed Income as of October 31, 2023; Note: We compute the implied probability of a 233 bp fall in yields from the rolling 1-year peak.
A similar assessment for 10-year Treasury yields suggests that markets see a 27% chance that 10-year yields might fall to recessionary levels. That’s higher than the probability indicated by 3-month yields, but it still falls short of consensus among economists (Bloomberg consensus remains at a 55% recession probability).
What do other markets tell us about the risk of a recession?
Bond markets are traditionally a great bellwether of macroeconomic developments, including recessions. However, the current bond market cycle has been anything but typical: record inflation, unprecedented policy tightening, increases in term premia and the neutral rate, and quantitative tightening after years of quantitative easing. Altogether, it appears to indicate a structural shift across developed market rate complexes.
Yet, this raises the question of how other asset classes may price in tail risks, such as a recession. Thus, we can add further value to our assessment by looking at the tail-risk pricing across different asset classes.
Figure 5 summarizes moves in bond prices and those of other assets around past recessions as well as the market-implied probability of similar moves occurring in the next year. We consider the implied level (column D) if a recession were to occur and the probability (column E) that investors attribute to the underlying asset crossing this level at the option’s expiry.
We find that, beyond bonds, other markets have also “priced out” recession risks: risk assets’ market-implied moves into recessionary territory only stand within the range of 9-19%.
Of the five asset classes we consider, U.S. equities and the VIX volatility index appear particularly unlikely to move into recession levels. Of the asset classes in Figure 5, 10-year Treasury yields price the highest likelihood with a 27% probability of the yield falling by 94 bps one year from now.
Figure 5: Market-implied probabilities of recessionary moves.
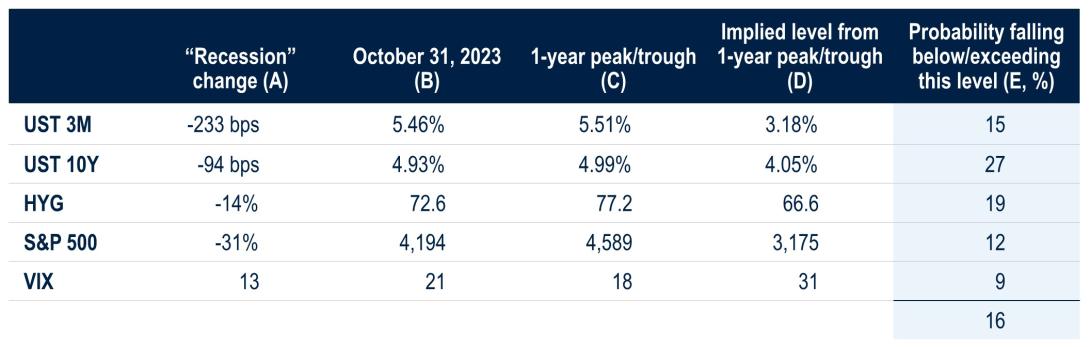
Source: Bloomberg, Barclays, PGIM Fixed Income as of October 31, 2023; Note: We consider one-year options except for VIX, where data availability limits us to a 6-month horizon. For VIX we use CBOE futures (UX6). High yield bonds are proxied by the HYG ETF. Column E represents the implied probability of a change (column A) from the 1-year peak (C).
Similar to our previous assessments of changing distributions and their respective drivers, Figure 6 shows how this pricing has evolved in the past year. We find that:
- Last October, Treasury markets expected a much lower probability of downside moves in yields than risk assets. The consensus downside scenario at that time was “stagflation,” in which central banks would keep interest rates high to combat inflation. This explains some of the difference between downside pricing across asset classes, which has now converged.
- A combination of wider spreads and higher government yields led HYG (which tracks the total return of the iBoxx HY index) to selloff by almost 20% between October 2021 and 2022. Such a move is akin to past recessions, so it is unsurprising that the options market would suggest a high “recession probability.”
- All asset classes share a spike in downside probability around the U.S. regional banking turmoil in March 2023 and a subsequent decline over the summer. The spike in U.S. 3-month Treasury yields lasted until May 2023, as rates markets gradually resumed pricing in further Fed tightening.
- The likelihood of lower government bond yields has stabilized since summer. By contrast, risk assets have seen an uptick in implied recession probabilities in recent weeks.
Figure 6: Market-implied probabilities of recessionary moves over time.

Source: Bloomberg, Barclays, PGIM Fixed Income as of October 31, 2023; Note: We consider one-year options expect for VIX, where data availability limits us to a 6-month horizon.
Conclusions
Market-implied probabilities have shifted considerably over the last 18 months. In October 2022, peak uncertainty manifested as probability distributions with fat tails and left skew. Today, markets have priced out those fat tails as the case for a soft landing has strengthened.
Since March 2023, market-implied probabilities of a recession have fallen and converged across asset classes. Equity and credit options suggest that prices for risk assets will be significantly more resilient than investors expected six months ago. Interest-rate options are also pricing in a lower probability of recession. That’s consistent with the bond market implying that government bond yields will remain higher for longer.
Observing how markets price shifts in the distribution across asset classes allows us to reflect on our own scenario framework. For some time, we have taken a probabilistic scenario-based approach to form our macro and market views in an attempt to avoid overreliance on point estimates and to be better prepared for a broader range of possible outcomes.
Evaluating market pricing within the tails of the distribution complements this framework. It allows us to compare our own views to that of the market, foster internal discussion, and ultimately help us make better investment decisions in one of the most complex backdrops in modern times.
Read More From PGIM Fixed Income
Appendix
Zooming in on the tail pricing of other assets than government bonds helps explain the dissonance between bonds and risk assets.
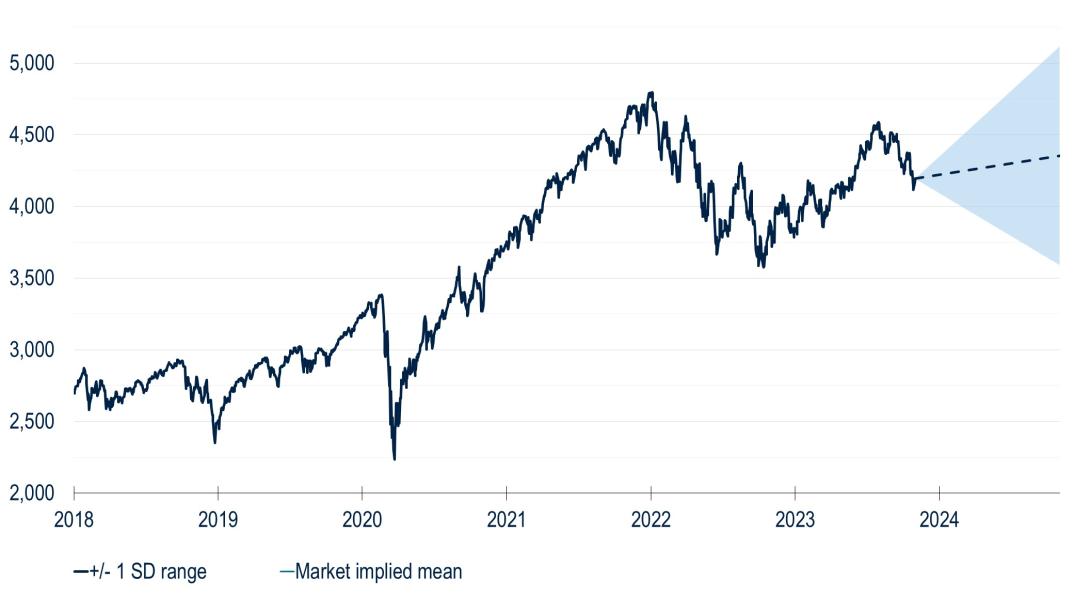
Changes in the distribution of equity market outcomes have been even more pronounced than those in bond markets this past year.
- October 2022 marked the post-pandemic trough in the S&P 500. The light-blue line in figure 7 shows high uncertainty, reflected in a flat distribution, with large tails, and downside skew.
- By February (yellow line), the distribution had narrowed and shifted to the right, as market sentiment improved.
- In March 2023 (grey), the regional banking turmoil led markets to price increased downside risks, albeit equity markets remained more resilient than bond markets.
- Today (shaded blue) markets expect US equities to rise over the next 12 months, but the distribution remains skewed to the downside.
Figure 7A: The probability distribution of U.S. equities has shifted right, and the large left tail has tapered.
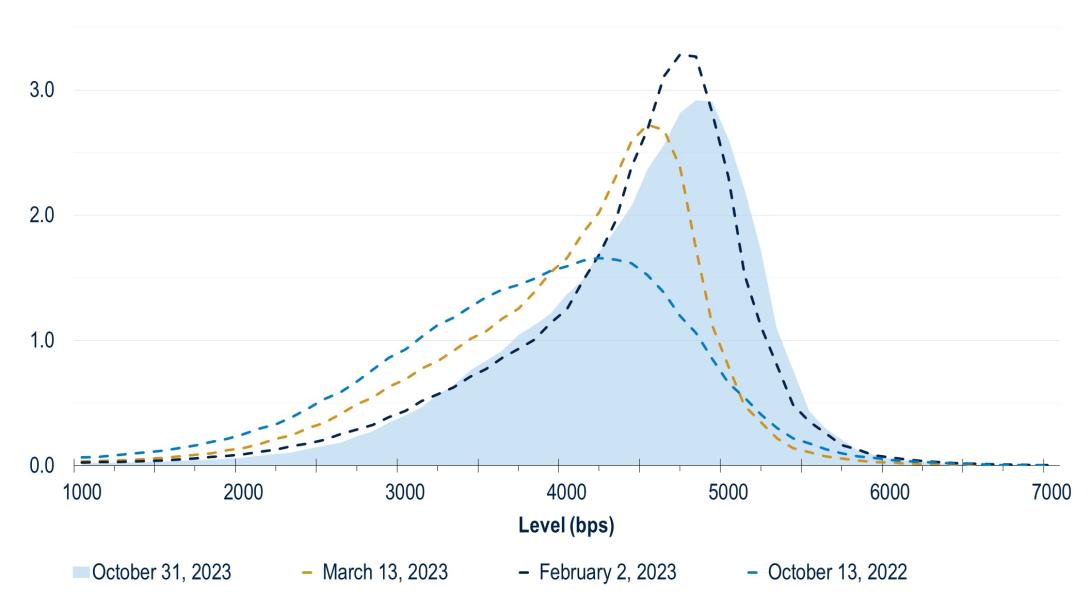
Figure 7B: Markets expect U.S. equities to rise over the next 12 months.
Source: Bloomberg, Citi, PGIM Fixed Income as of October 31, 2023.
For high-yield investors, total return expectations have also changed considerably over the past year:
- Moving into 2023, investor sentiment became more bullish, spreads tightened, and tail risks were priced out (yellow).
- The implied probability distribution for HYG today (shaded blue) exhibits narrower tails and limited skew.
Figure 8A: HYG investors are pricing narrower tails and limited skew
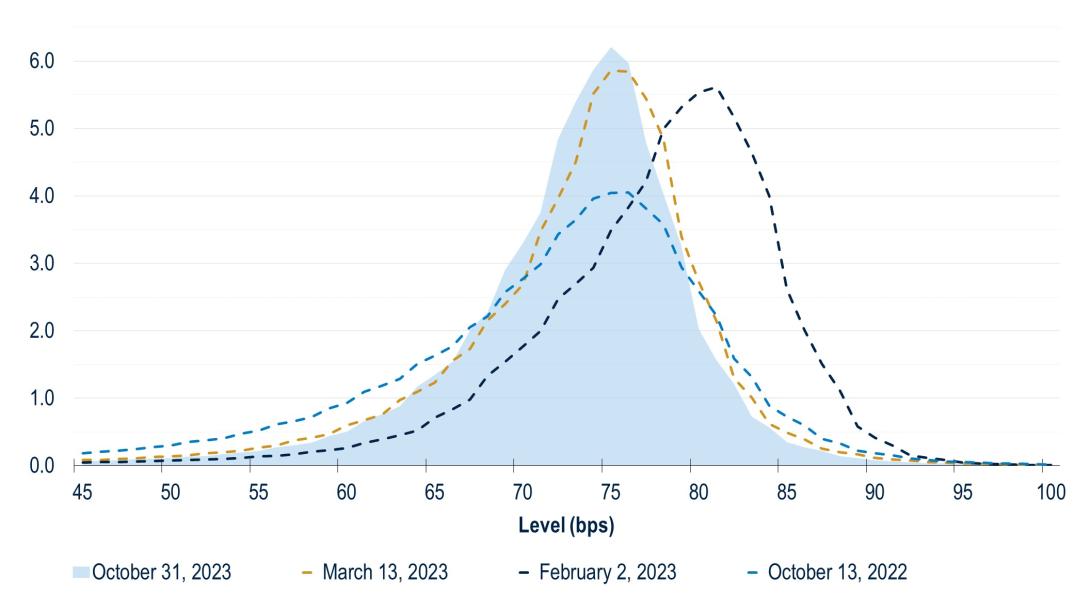
Figure 8B: Markets expect HYG prices to remain rangebound over the coming 12 months

Source: Bloomberg, Citi, PGIM Fixed Income as of October 31, 2023.
The probability distribution implied by options on the VIX volatility futures:
- shifted materially to the left between October 2022 and February 2023 (light blue to yellow).
- The regional banking turmoil then pushed investors back towards pricing high equity volatility (grey),
- before this summer’s rally led to benign volatility expectations from now over the next 6 months (shaded blue).
Figure 9A: The VIX implied probability distribution is skewed to the right
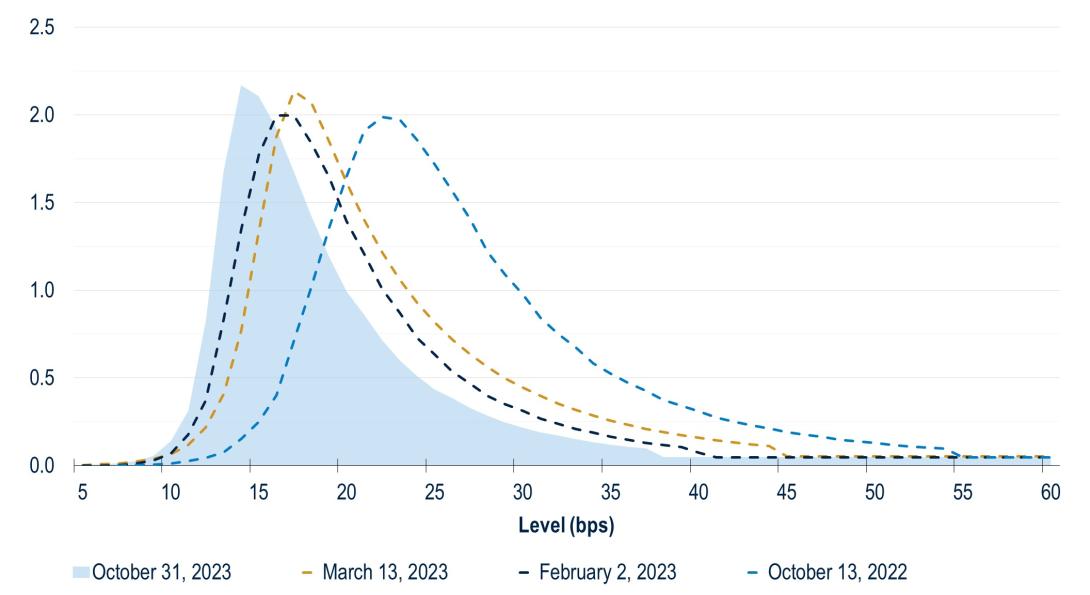
Figure 9B: Investors expect equity volatility to fall further
Source: Bloomberg, Citi, PGIM Fixed Income as of October 31, 2023; Note: For VIX we use CBOE futures.
1 Webcast Registration: Déjà New? Musings On The Next Normal
2 We focus on the following dates for calculating these distributions: 1) October 2022— the most recent equity market trough; 2) February 2023—the high point in equity markets before the failure of Silicon Valley Bank; 3) March 2023—the low point in equity markets after the failure of Silicon Valley Bank; and 4) today.
The comments, opinions, and estimates contained herein are based on and/or derived from publicly available information from sources that PGIM Fixed Income believes to be reliable. We do not guarantee the accuracy of such sources or information. This outlook, which is for informational purposes only, sets forth our views as of this date. The underlying assumptions and our views are subject to change. Past performance is not a guarantee or a reliable indicator of future results.
Source(s) of data (unless otherwise noted): PGIM Fixed Income, as of November 9, 2023.
For Professional Investors only. Past performance is not a guarantee or a reliable indicator of future results and an investment could lose value. All investments involve risk, including the possible loss of capital.
PGIM Fixed Income operates primarily through PGIM, Inc., a registered investment adviser under the U.S. Investment Advisers Act of 1940, as amended, and a Prudential Financial, Inc. (“PFI”) company. Registration as a registered investment adviser does not imply a certain level or skill or training. PGIM Fixed Income is headquartered in Newark, New Jersey and also includes the following businesses globally: (i) the public fixed income unit within PGIM Limited, located in London; (ii) PGIM Netherlands B.V., located in Amsterdam; (iii) PGIM Japan Co., Ltd. (“PGIM Japan”), located in Tokyo; (iv) the public fixed income unit within PGIM (Hong Kong) Ltd. located in Hong Kong; and (v) the public fixed income unit within PGIM (Singapore) Pte. Ltd., located in Singapore (“PGIM Singapore”). PFI of the United States is not affiliated in any manner with Prudential plc, incorporated in the United Kingdom or with Prudential Assurance Company, a subsidiary of M&G plc, incorporated in the United Kingdom. Prudential, PGIM, their respective logos, and the Rock symbol are service marks of PFI and its related entities, registered in many jurisdictions worldwide.
These materials are for informational or educational purposes only. The information is not intended as investment advice and is not a recommendation about managing or investing assets. In providing these materials, PGIM is not acting as your fiduciary. PGIM Fixed Income as a general matter provides services to qualified institutions, financial intermediaries and institutional investors. Investors seeking information regarding their particular investment needs should contact their own financial professional.
These materials represent the views and opinions of the author(s) regarding the economic conditions, asset classes, securities, issuers or financial instruments referenced herein. Distribution of this information to any person other than the person to whom it was originally delivered and to such person’s advisers is unauthorized, and any reproduction of these materials, in whole or in part, or the divulgence of any of the contents hereof, without prior consent of PGIM Fixed Income is prohibited. Certain information contained herein has been obtained from sources that PGIM Fixed Income believes to be reliable as of the date presented; however, PGIM Fixed Income cannot guarantee the accuracy of such information, assure its completeness, or warrant such information will not be changed. The information contained herein is current as of the date of issuance (or such earlier date as referenced herein) and is subject to change without notice. PGIM Fixed Income has no obligation to update any or all of such information; nor do we make any express or implied warranties or representations as to the completeness or accuracy.
Any forecasts, estimates and certain information contained herein are based upon proprietary research and should not be interpreted as investment advice, as an offer or solicitation, nor as the purchase or sale of any financial instrument. Forecasts and estimates have certain inherent limitations, and unlike an actual performance record, do not reflect actual trading, liquidity constraints, fee. These materials are not intended as an offer or solicitation with respect to the purchase or sale of any security or other financial instrument or any investment management services and should not be used as the basis for any investment decision. PGIM Fixed Income and its affiliates may make investment decisions that are inconsistent with the recommendations or views expressed herein, including for proprietary accounts of PGIM Fixed Income or its affiliates.
Investing in the bond market is subject to risks, including market, interest rate, issuer, credit, inflation risk, and liquidity risk. The value of most bonds and bond strategies are impacted by changes in interest rates. Bonds and bond strategies with longer durations tend to be more sensitive and volatile than those with shorter durations; bond prices generally fall as interest rates rise, and low interest rate environments increase this risk. Reductions in bond counterparty capacity may contribute to decreased market liquidity and increased price volatility. Bond investments may be worth more or less than the original cost when redeemed. Mortgage- and asset-backed securities may be sensitive to changes in interest rates, subject to early repayment risk, and while generally supported by a government, government agency or private guarantor, there is no assurance that the guarantor will meet its obligations. High yield, lower-rated securities involve greater risk than higher-rated securities; portfolios that invest in them may be subject to greater levels of credit and liquidity risk than portfolios that do not. Investing in foreign-denominated and/or -domiciled securities may involve heightened risk due to currency fluctuations, and economic and political risks, which may be enhanced in emerging markets. Currency rates may fluctuate significantly over short periods of time and may reduce the returns of a portfolio. Commodities contain heightened risk, including market, political, regulatory and natural conditions, and may not be suitable for all investors. Diversification does not ensure against loss.
In the United Kingdom, information is issued by PGIM Limited with registered office: Grand Buildings, 1-3 Strand, Trafalgar Square, London, WC2N 5HR.PGIM Limited is authorised and regulated by the Financial Conduct Authority (“FCA”) of the United Kingdom (Firm Reference Number 193418). In the European Economic Area (“EEA”), information is issued by PGIM Netherlands B.V., an entity authorised by the Autoriteit Financiële Markten (“AFM”) in the Netherlands and operating on the basis of a European passport. In certain EEA countries, information is, where permitted, presented by PGIM Limited in reliance of provisions, exemptions or licenses available to PGIM Limited including those available under temporary permission arrangements following the exit of the United Kingdom from the European Union. These materials are issued by PGIM Limited and/or PGIM Netherlands B.V. to persons who are professional clients as defined under the rules of the FCA and/or to persons who are professional clients as defined in the relevant local implementation of Directive 2014/65/EU (MiFID II). In Switzerland, information is issued by PGIM Limited, London, through its Representative Office in Zurich with registered office: Kappelergasse 14, CH-8001 Zurich, Switzerland. PGIM Limited, London, Representative Office in Zurich is authorised and regulated by the Swiss Financial Market Supervisory Authority FINMA and these materials are issued to persons who are professional or institutional clients within the meaning of Art.4 para 3 and 4 FinSA in Switzerland. In certain countries in Asia-Pacific, information is presented by PGIM (Singapore) Pte. Ltd., a regulated entity with the Monetary Authority of Singapore under a Capital Markets Services License to conduct fund management and an exempt financial adviser. In Japan, information is presented by PGIM Japan Co. Ltd., registered investment adviser with the Japanese Financial Services Agency. In South Korea, information is presented by PGIM, Inc., which is licensed to provide discretionary investment management services directly to South Korean investors. In Hong Kong, information is provided by PGIM (Hong Kong) Limited, a regulated entity with the Securities & Futures Commission in Hong Kong to professional investors as defined in Section 1 of Part 1 of Schedule 1 of the Securities and Futures Ordinance (Cap.571). In Australia, this information is presented by PGIM (Australia) Pty Ltd (“PGIM Australia”) for the general information of its “wholesale” customers (as defined in the Corporations Act 2001). PGIM Australia is a representative of PGIM Limited, which is exempt from the requirement to hold an Australian Financial Services License under the Australian Corporations Act 2001 in respect of financial services. PGIM Limited is exempt by virtue of its regulation by the FCA (Reg: 193418) under the laws of the United Kingdom and the application of ASIC Class Order 03/1099. The laws of the United Kingdom differ from Australian laws. In Canada, pursuant to the international adviser registration exemption in National Instrument 31-103, PGIM, Inc. is informing you that: (1) PGIM, Inc. is not registered in Canada and is advising you in reliance upon an exemption from the adviser registration requirement under National Instrument 31-103; (2) PGIM, Inc.’s jurisdiction of residence is New Jersey, U.S.A.; (3) there may be difficulty enforcing legal rights against PGIM, Inc. because it is resident outside of Canada and all or substantially all of its assets may be situated outside of Canada; and (4) the name and address of the agent for service of process of PGIM, Inc. in the applicable Provinces of Canada are as follows: in Québec: Borden Ladner Gervais LLP, 1000 de La Gauchetière Street West, Suite 900 Montréal, QC H3B 5H4; in British Columbia: Borden Ladner Gervais LLP, 1200 Waterfront Centre, 200 Burrard Street, Vancouver, BC V7X 1T2; in Ontario: Borden Ladner Gervais LLP, 22 Adelaide Street West, Suite 3400, Toronto, ON M5H 4E3; in Nova Scotia: Cox & Palmer, Q.C., 1100 Purdy’s Wharf Tower One, 1959 Upper Water Street, P.O. Box 2380 -Stn Central RPO, Halifax, NS B3J 3E5; in Alberta: Borden Ladner Gervais LLP, 530 Third Avenue S.W., Calgary, AB T2P R3.
© 2023 PFI and its related entities.
2023-8233
Sign Up Now for Full Access to Articles and Podcasts!
Unlock full access to our vast content library by registering as an institutional investor .
Create an accountAlready have an account ? Sign in