
Private Credit 4Q21 Update: Entering 2022 on the Heels of a Strong Year
Many segments of private credit posted strong activity in 2021: Private placement annual volume, for example, reached a ten-year high. We see the potential for 2022 to follow suit. However, macro developments and geopolitical risks certainly bear monitoring, as they have the potential to alter financial conditions. Asset selectivity with a focus on strong covenant & deal documentation can help investors mitigate risk.
Macro Picture
In late February 2022, Russia launched a full-scale invasion of Ukraine, with many nations responding with broad, coordinated sanctions. While the ultimate outcome was uncertain as of March 8th, the global economy was already feeling the impact through continued supply chain disruptions, rising commodity prices and significant price pressure to risk assets. On the other hand, the war could slow the pace of monetary policy tightening and spur new government spending and investment in some areas.
Middle Market Direct Lending
Through early 2022, sponsor M&A activity remained high in the private direct lending market. The execution of jumbo (greater than $1 billion) unitranche financings has contributed to the elevated activity; direct lenders are rapidly disintermediating investment banks and taking share from the broadly syndicated loan market.
These larger unitranche financings expand opportunities for scaled direct lenders, though these deals include many features of the broadly syndicated loans they’re looking to displace—such as weaker documentation and covenants. We’ll continue focusing on serving the needs of core middle-market financial sponsors while also leveraging our scale to execute up-market on a highly selective basis.
New issue yields in the fourth quarter were a touch lower; however, the illiquidity premium in direct lending remains above the historical average. Yields for middle market direct lending transactions averaged 7.1%, slightly lower quarter over quarter and about 35 basis points (b.p.) lower year over year. For large corporate loans, 4.5% new issue yields were also down quarter over quarter and down 76 b.p. year over year. Direct lending’s illiquidity premium expanded during 2021, averaging 280 b.p. The 260 b.p. fourthquarter yield was well above the long-term average of 195 b.p. since 2013. A critical point: we don’t believe investors are taking on more credit risk to capture this extra yield.
New Issue MMDL 1L VS. Corporate Term Loan Yields
Illiquidity Premium of 260 b.p. Well Above Long-Term Average of 195 b.p.
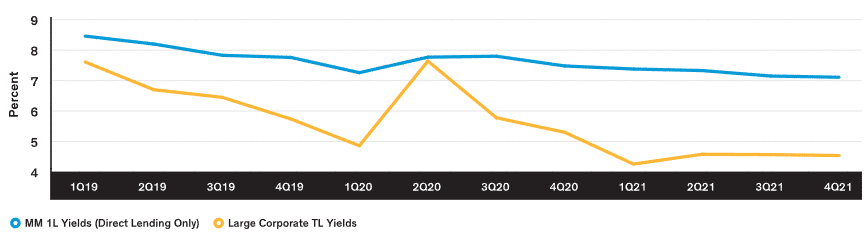
As of December 31, 2021 | Source: Refinitiv LPC
Direct lending volume in the sponsored middle market reached an all-time quarterly high for the second consecutive quarter, capping a record year at $131 billion—easily topping the prior record of $103 billion from 2018. Sponsor-related activity increased for both direct lending and syndicated solutions, though not at the same pace as direct lending continued to gain share in 2021.
The ratio of direct lending to syndicated volume reached an all-time quarterly record of 3.3x in 4Q21. Sponsor M&A activity was up 94% year over year in 2021, driving robust sponsor-related financing volume. This higher activity benefits our platform—which lends primarily to sponsor-backed companies—by allowing the team to be even more selective in its asset selection. Robust deal activity has carried into 1Q22, breaking the seasonal trend of muted volumes early in a given year.
US Commercial Real Estate Debt
Investors continue to keep a close eye on travel statistics as a way to gauge demand in certain sectors. US air travel, for instance, continued its rebound with Transportation Safety Administration throughput increasing for the third straight quarter in 4Q21. While 2021 throughput trailed pre-COVID-19 figures, the gap is tightening, with throughput up 124% year over year. The DJIA Hotel Index ended 2021 up 31.5%, a remarkable rebound from 2020 supported by a strong $44.5 billion in investment activity. During the last quarter of 2021, US hotel investment volume also experienced significant growth: single asset deal volume increased 162% compared to the same period on sales of $28.0 billion last year.
Transaction volume of US commercial real estate sales surpassed pre-COVID levels in FY2021, setting a record high of $808.7 billion that handily outpaced analysts’ projections of $600 billion. Multifamily (42%) and industrial (21%) dominated activity. Multifamily investment volume reached a high of $335.3 billion, up 128% year over year and 74% from 2019. Support was strong throughout the year, with average rents up by 13.4% and vacancy rates falling to 2.5%, a record low. Industrial set a record transaction volume in 2021, with asset prices up more than 80% from their pre-global financial crisis (GFC) peak.
Data centers took center stage through 2020 and 2021, remaining a major player in nontraditional real estate assets. Market capitalization rates fell to a historical low in the first half of 2021—analysts expect this trend to continue amid strong competition. Sustainability is a priority for all new construction; investors are placing more importance on clean-energy sources and alternative cooling solutions.
Distressed transaction volume was unexpectedly muted in 2021, as real estate proved resilient to COVID-19 and macroeconomic volatility. At the onset of the pandemic, managers believed that the downturn would be comparable to that surrounding the GFC; they raised billions in capital to revisit distressed investment strategies that proved successful after that downturn. However, the US government’s swift action ensured a continued flow of capital into debt markets.
European Commercial Real Estate Debt
Investors in the European commercial real estate market remain optimistic, and 2021 wrapped up with investment volumes up across almost every sector. The strong session confirms the resilience of both the European economy and real estate markets.
Total volume was up 25% year over year. Residential and multi-family were two of the main drivers, with a +42% year over year change on a trailing twelve-month basis. Industrials, hotels and office space saw strong increases during the year. Looking to 2022, we expect capital for investment in Europe to grow based on this strong performance, especially as international investors return to market.
Debt activity across Europe, historically concentrated in larger markets like the UK, has become more geographically diverse recently, with some secondary markets in the eurozone, such as the Nordics, receiving more attention. Banks remain the primary debt source in Europe, but alternative capital is slowly gaining market share, as regulations continue to tighten and banks’ risk appetite decelerates.
One theme that we’ve seen emerge is the uncertainty of future office use in Europe creating a positive force for the multi-family market, as pandemic lockdowns demonstrated the ability of people to work from home. Investors have shifted their focus and capital in response.
Within the prime-office sector, steady demand for both debt and equity investments has produced firm transaction volume. Loan-to-value ratios were mostly flat quarter over quarter, with certain sub-markets like Paris seeing moderate increases—hovering around 60%.
Residential real estate set a historical investing record in the third quarter of 2021, as 24.7€ billion of capital flooded into the market. Purpose Built Student Accommodation (PBSA) has yet to experience pricing tailwinds, with higher margins in multiple European markets suggesting less liquidity. We’re seeing a cautious tone from investors as they evaluate PBSA opportunities.
Private Placements
The private placement market enjoyed another strong year of issuance, continuing a decade of steady issuance growth. Full-year issuance was up 5% versus 2020 at just under $80 billion, with the fourth quarter one of the busiest.
An interesting theme in 2021 was a pickup in the short end of the curve, driven partially by the composition of industries that have been active in the market—namely financial institutions. Financials have historically accounted for a relatively low percentage of issuance versus public-debt markets, and are generally much shorter tenor issuers. Because most private placement buyers are life insurers with much longer liability-duration profiles than, say five years, we think those that can allocate a percentage of their portfolio to this shorter-maturity bucket should do so.
The short end of the curve has been relatively attractive, since traditional demand is in the 7–10 year cohort and even longer. However, we continue to emphasize that the composition of financial issuers in the private placement market differs from the public market. Banks rarely issue in the private market; typical financial issuers include asset managers, business-development companies and funds. We think these types of financial issuers offer an attractive way to diversify financial exposures within investment-grade portfolios.
Investor demand remained robust throughout 2021, contributing to lower spreads, especially among the more traditional industrial and utility issues that have been coming to market. That said, we’re still seeing at least a 15 b.p. spread pickup over public corporates in those standard issues. But we think it’s noteworthy that the dispersion of spreads in the market is wide, creating value in certain pockets including uniquely structured transactions and infrastructure deals.
Despite the strong demand—with most deals multiple times oversubscribed—we haven’t seen weakness in the covenant packages connected to deals, which we’ve historically avoided. In our view, investors’ unwillingness to accept weaker packages and documentation—which can be a differentiator when looking at private assets as a whole—is a sign of the market’s long-term health.
The credit quality landscape began returning to historical norms in 2021. BBB-rated issuance ended a touch under 60% of the total, in contrast to 2020’s tilt toward higher-quality investment-grade issuers coming to market—driven by the uptick in financial issuers, which typically carry AA or A ratings. Some high-yield issuance also returned, as investors’ appetite for lower-quality investment-grade and below investment-grade issuance is becoming more prevalent. As we look forward to 2022, we expect this trend to continue, and we wouldn’t be surprised by an uptick in high-yield issuance. However, this would still be only a fraction of total overall issuance.
Credit Quality of Private Placement New Issuance
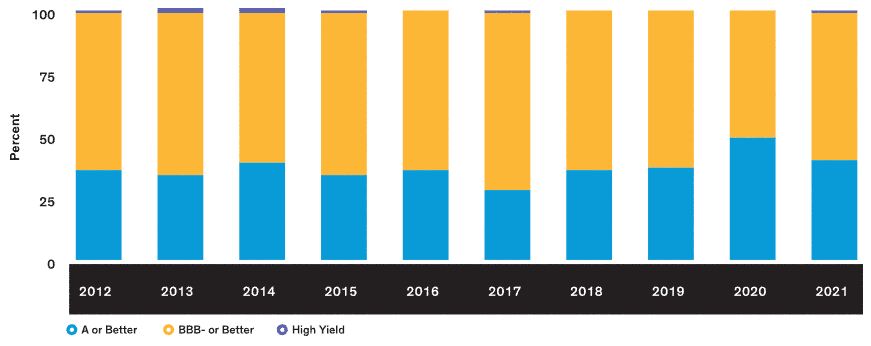
For illustrative purposes only.
New deals by dollar amount. Numbers may not total 100% due to rounding.
As of December 31, 2021
Source: Bank of America
US firms once again were the majority of the market in 2021, but not to the same degree as in 2020. In other geographies, government support to local companies in 2020 made it unnecessary to seek financing in other venues, such as the private placement market. But as the need for that support waned, foreign companies’ reliance on US private debt markets rebounded. Europe’s and Australia’s shares of global issuance each grew by 3% year over year, while US issuance dropped from 71% to 66%.
Despite this decline, US corporations’ share of the market is still above pre-COVID trends. As we think about 2022, one theme we’ll keep our eye on with respect to country issuance is emerging markets. Corporate issuance from entities domiciled in emerging markets was very slim during the pandemic, and it’s an area that we think could grow in the medium term.
All signs point to another year of strong volume in 2022, with three sectors likely to remain active issuers: infrastructure, real estate investment trusts and financials. With no signs of strong investor demand abating in the near-term, it won’t be surprising if spreads compress. Still, the private placement market offers investors value over public investment-grade portfolios via issuer and sector diversification, along with added risk mitigation from strong covenants and packages.
For Investment Professional use only. Not for inspection by, distribution or quotation to, the general public
The value of an investment can go down as well as up, and investors may not get back the full amount they invested. Capital is at risk. Past performance does not guarantee future results. There can be no assurance that any alternative investment objectives will be achieved. Investments in alternative strategies can be speculative and involve a high degree of risk and volatility. Performance compensation may create an incentive to make riskier investments. Alternative investments may involve higher fees and limit transferability and liquidity. AllianceBernstein and its affiliates have relationships and may engage in activities that may pose conflicts of interest.
Note to All Readers: The information contained herein reflects the views of AllianceBernstein L.P. or its affiliates and sources it believes are reliable as of the date of this publication. AllianceBernstein L.P. makes no representations or warranties concerning the accuracy of any data. There is no guarantee that any projection, forecast or opinion in this material will be realized. Past performance does not guarantee future results. The views expressed herein may change at any time after the date of this publication. This document is for informational purposes only and does not constitute investment advice. AllianceBernstein L.P. does not provide tax, legal or accounting advice. It does not take an investor’s personal investment objectives or financial situation into account; investors should discuss their individual circumstances with appropriate professionals before making any decisions. This information should not be construed as sales or marketing material or an offer or solicitation for the purchase or sale of any financial instrument, product or service sponsored by AllianceBernstein or its affiliates. References to specific securities are presented to illustrate the application of our investment philosophy only and are not to be considered recommendations by AB. The specific securities identified and described in this presentation do not represent all the securities purchased, sold or recommended for the portfolio, and it should not be assumed that investments in the securities identified were or will be profitable. Note to Readers in Canada: This publication has been provided by AllianceBernstein Canada, Inc. or Sanford C. Bernstein & Co., LLC and is for general information purposes only. It should not be construed as advice as to the investing in or the buying or selling of securities, or as an activity in furtherance of a trade in securities. Neither AllianceBernstein Institutional Investments nor AllianceBernstein L.P. provides investment advice or deals in securities in Canada. Note to Readers in the UK: This information is issued by AllianceBernstein Limited, 50 Berkeley Street, London W1J 8HA. Registered in England, No. 2551144. AllianceBernstein Limited is authorised and regulated in the UK by the Financial Conduct Authority (FCA—Reference No. 147956). It is provided for marketing purposes but does not constitute investment advice or an invitation to purchase any security or other investment. Note to Readers in Europe: This information is issued by AllianceBernstein (Luxembourg) S.à r.l. Société à responsabilité limitée, R.C.S. Luxembourg B 34 305, 2-4, rue Eugène Ruppert, L-2453 Luxembourg. Authorised in Luxembourg and regulated by the Commission de Surveillance du Secteur Financier (CSSF). Note to Qatari Readers: The document does not constitute an offer to the public and is for the use only of the named addressee and should not be given or shown to any other person (other than employees, agents or consultants in connection with the addressee’s consideration thereof). The fund has not been and will not be registered with the Qatar Central Bank or under any laws of the State of Qatar. Note to Readers in Australia and New Zealand: This document has been issued by AllianceBernstein Australia Limited (ABN 53 095 022 718 and AFSL 230698). Information in this document is intended only for persons who qualify as “wholesale clients,” as defined in the Corporations Act 2001 (Cth of Australia) or the Financial Advisers Act 2008 (New Zealand), and is general in nature and does not take into account any person’s objectives, financial situation or needs. Note to Readers in Vietnam, the Philippines, Brunei, Thailand, Indonesia, China, Taiwan and India: This document is provided solely for the informational purposes of institutional investors and is not investment advice, nor is it intended to be an offer or solicitation, and does not pertain to the specific investment objectives, financial situation or particular needs of any person to whom it is sent. This document is not an advertisement and is not intended for public use or additional distribution. AllianceBernstein L.P. is not licensed to, and does not purport to, conduct any business or offer any services in any of the above countries. Note to Readers in Singapore: This document has been issued by AllianceBernstein (Singapore) Ltd. (Company Registration No. 199703364C). AllianceBernstein (Singapore) Ltd. is regulated by the Monetary Authority of Singapore. The Strategy has not been registered for sale in Singapore and there is currently no public offering of the shares in Singapore. This document and any other material in connection with the offer, sale, or invitation for subscription or purchase of Interests may not be circulated or distributed, nor may Interests be offered for or sold, or be made the subject of an invitation for subscription or purchase, whether directly or indirectly, to persons in Singapore other than (i) an institutional investor (as defined in section 4A of the SFA) pursuant to Section 304 of the SFA, (ii) pursuant to and in accordance with section 302C or (iii) pursuant to and in accordance with the conditions of any other applicable offering exemption of the SFA. This advertisement has not been reviewed by the Monetary Authority of Singapore. Note to Readers in Taiwan: AllianceBernstein L.P. does not provide investment advice or portfolio-management services or deal in securities in Taiwan. The products/services illustrated here may not be available to Taiwan residents. Before proceeding with your investment decision, please consult your investment advisor. Note to Readers in Hong Kong: This document has been issued by AllianceBernstein Hong Kong Limited (聯博香港有限公司). This document has not been reviewed by the Securities and Futures Commission (“SFC”). The strategy has not been registered with the SFC for public distribution. The Strategy is only available to Professional Investors within the definition under the Securities and Futures Ordinance only. Note to Readers in Japan: This document has been provided by AllianceBernstein Japan Ltd. AllianceBernstein Japan Ltd. is a registered investment-management company (registration number: Kanto Local Financial Bureau no. 303). It is also a member of the Japan Investment Advisers Association; the Investment Trusts Association, Japan; the Japan Securities Dealers Association; and the Type II Financial Instruments Firms Association. The product/service may not be offered or sold in Japan; this document is not made to solicit investment.
The [A/B] logo is a service mark of AllianceBernstein and AllianceBernstein® is a registered trademark used by permission of the owner, AllianceBernstein L.P.
© 2022 AllianceBernstein L.P.
Sign Up Now for Full Access to Articles and Podcasts!
Unlock full access to our vast content library by registering as an institutional investor .
Create an accountAlready have an account ? Sign in