Providing opportunity for growth and diversification to fixed income portfolios

In the current environment, where there has been a reset in yields, we believe that Emerging Market (EM) corporate debt is a compelling, asset class offering attractive yields that warrants consideration when making an allocation to fixed income.
In this paper, we cover the evolution of the investment grade segment of the asset class, its current construct and attributes, and outline the benefits of allocating to EM IG corporate credit alongside traditional fixed income asset classes.
Asset class make-up and fundamentals
A large and diverse investment universe
As emerging markets have grown substantially over the past two decades, emerging market based corporations have turned to international capital markets to help fund and grow their businesses. As a result, JP Morgan launched a suite of emerging market corporate debt indices in 2008. From a market cap of less than US$500 billion in 2010, the investment-grade portion of the entire asset class has grown to c.US$1.6 trillion1 today across 31 countries. While asset class net issuance was negative in 2022 and 2023 - against a backdrop of rising rates – the actual path of growth is likely to return to an upward trajectory as rates normalise.
The investment universe is diversified globally across regions, countries, and sectors, with lower leverage than comparably rated developed market peers. We believe this fast-growing and increasingly diverse asset class – which has higher yields, lower duration and less leverage than US investment-grade debt for comparable credit quality – could provide a high-grade complementary solution for institutional investors.
Fig 1. Growth in EM IG corporate bonds (US dollar, billion)
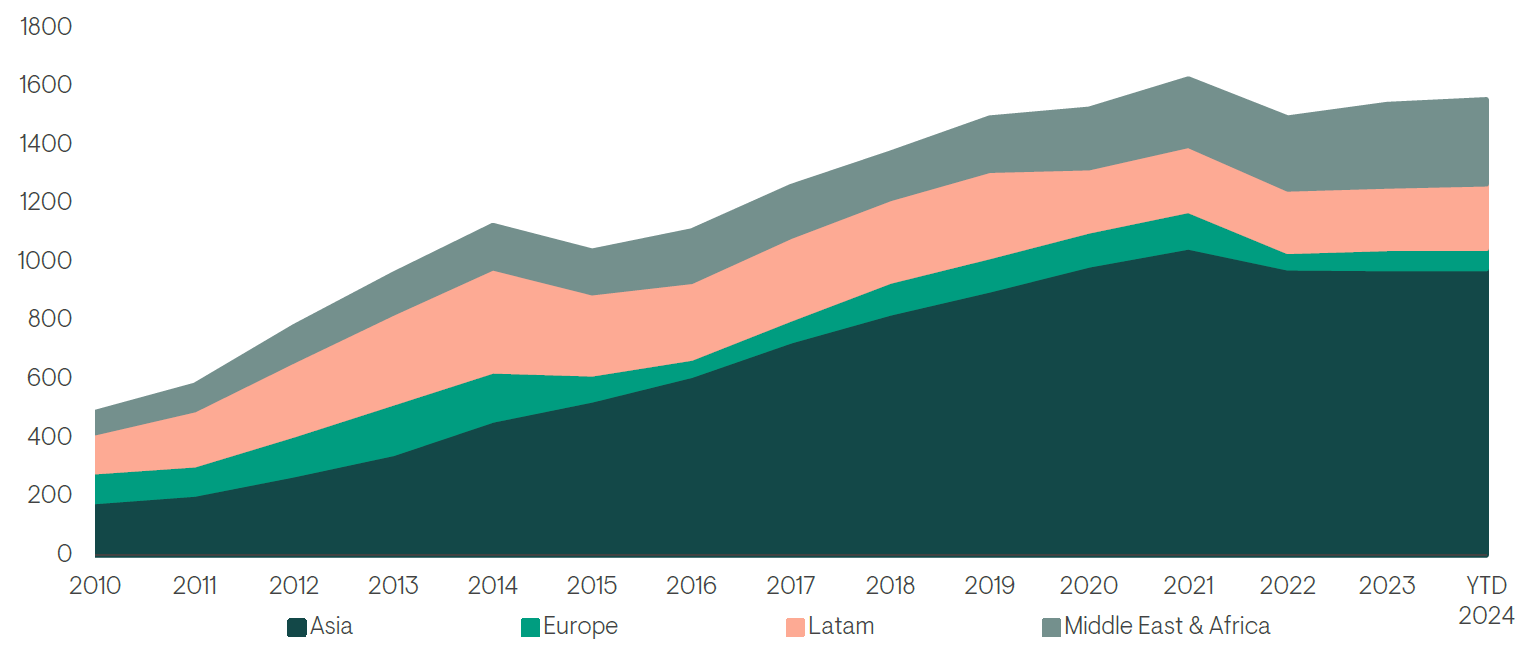
Source: Ninety One, JP Morgan, as at 20 February 2024. All comparative data for EM Investment Grade Corporate asset class is based on the JPMorgan Investment Grade CEMBI Broad Diversified Index. For further information on indices, please see the important information section.
There are over 1,100 bonds in the JP Morgan CEMBI IG alone, issued by almost 400 companies from a range of sectors. From an industry perspective, commodity and financial companies make up around half of the market, but that proportion has decreased over time as the market has grown and become more diversified. Maturities extend from less than a year to over 30 years, providing plenty of choice, including relative-value opportunities within individual issuers’ yield curves.
Fig 2. JPMorgan CEMBI IG rating, maturity, sector and regional breakdown
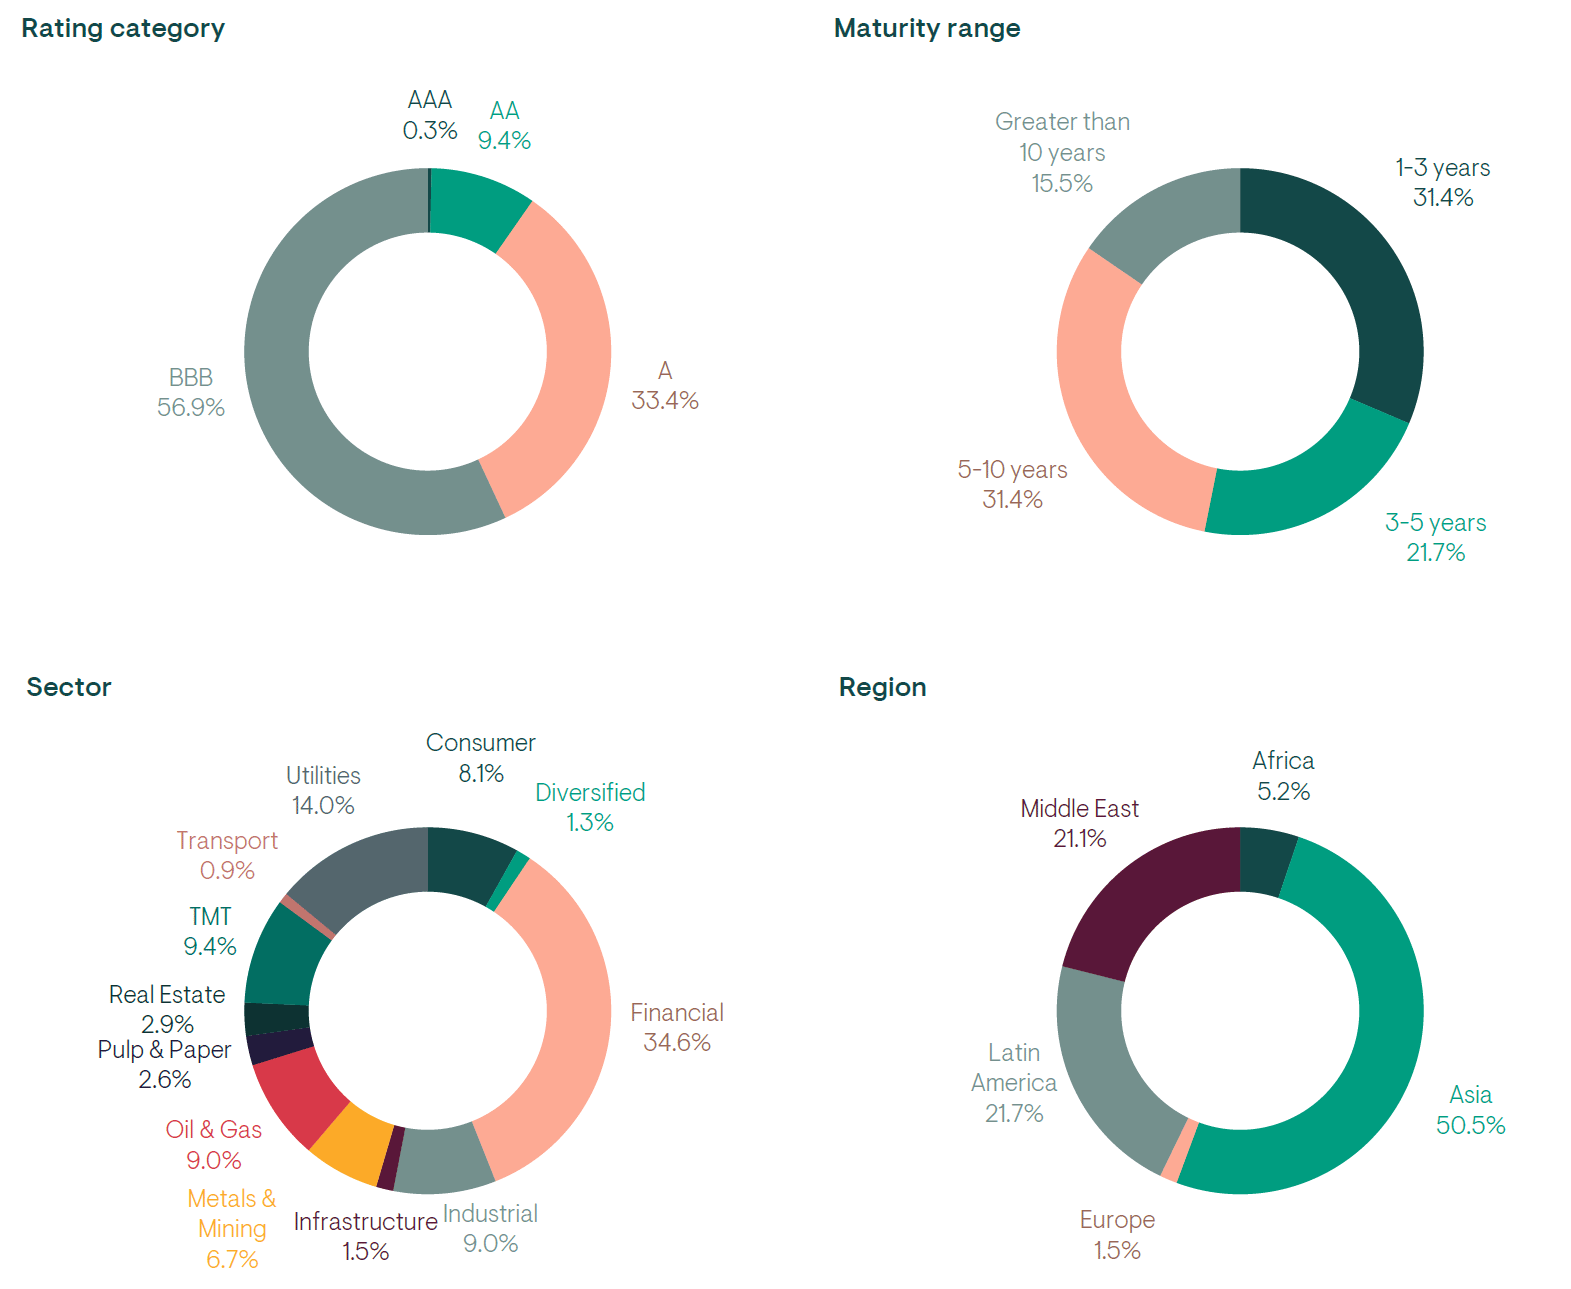
Source: Ninety One, JP Morgan as at 31 March 2024.
Fundamentally strong companies
Emerging market companies have, on average, maintained better credit fundamentals than their similarly rated developed market peers, as they have needed to maintain resilience during times of challenging macroeconomic backdrops.
Head-quartered and operating in emerging markets, these companies are familiar with volatility and have historically experienced periods when they struggled to finance themselves with longer-term debt. Thus, their short-term debt is higher as a percentage than it is in developed markets, and their refinancing risks have historically been higher. This has led to a culture of retaining cash while containing leverage. This has been particularly evident since the COVID-19 crisis, as many companies have pared back their expansion and capital expenditure, leaving them with healthy cash balances and strong buffers.
While higher refinancing risks would typically be a fundamental challenge in a rising rate environment – as there is a need to refinance at higher costs – such pressure on EM corporates is meaningfully lower in this cycle relative to prior cycles as most issuers have been able to pre-finance in the ultra-low interest rate regime that we saw in the period after COVID-19. This has left them well-placed from a financing perspective over the short and medium term.
Fig 3. EM vs. US and European IG net leverage comparison
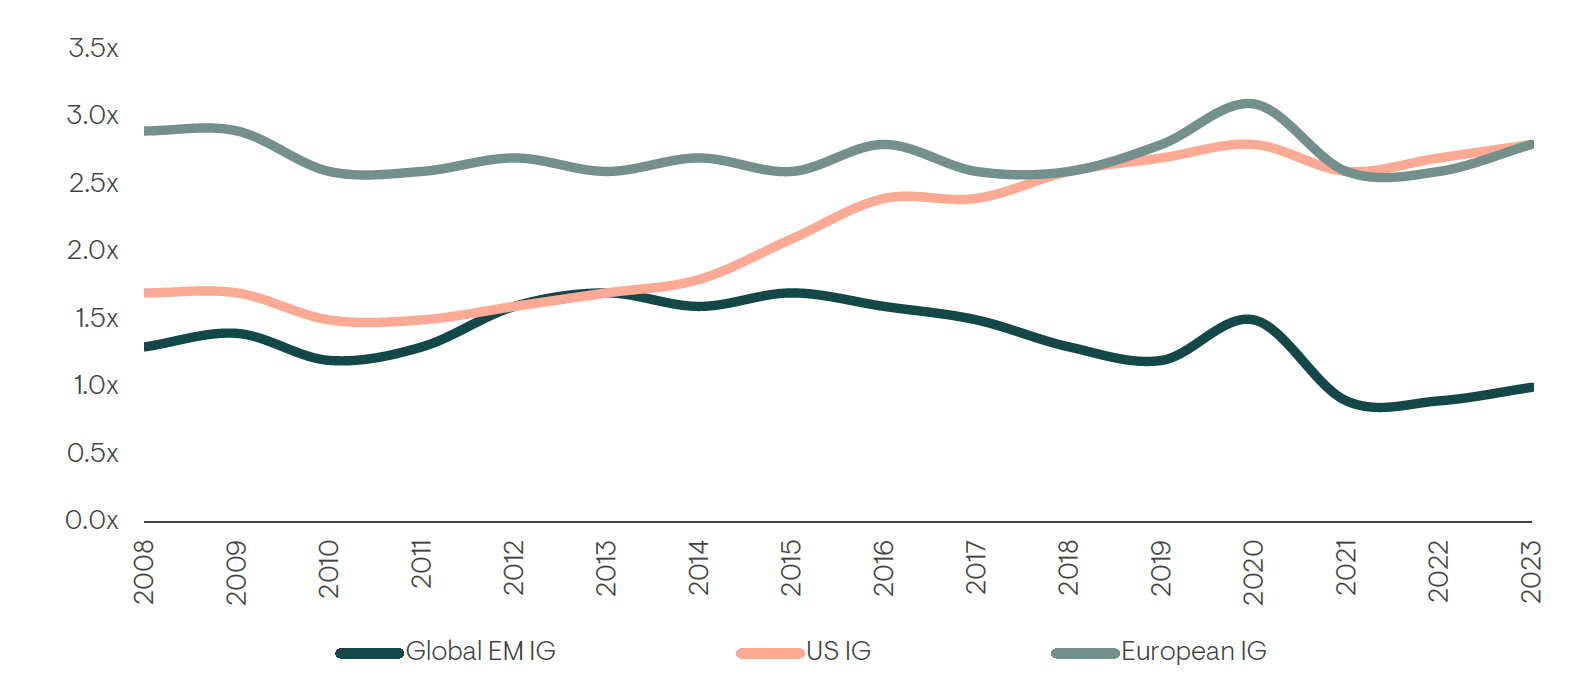
Source: JP Morgan as at 31 December 2023.
For further information on indices, please see the important information section.
The EM ‘zip-code’ premium creates opportunities
Investors often perceive emerging market companies to be riskier because of their domestic operating environments. Although rating agencies account for this, premiums still exist for EM companies with better credit metrics than developed market peers; in effect, a ‘zip-code premium’. Figure 5 shows this by comparing the spread-per-turn of leverage offered by emerging and developed market companies.
Fig 5. Spread per turn of net leverage
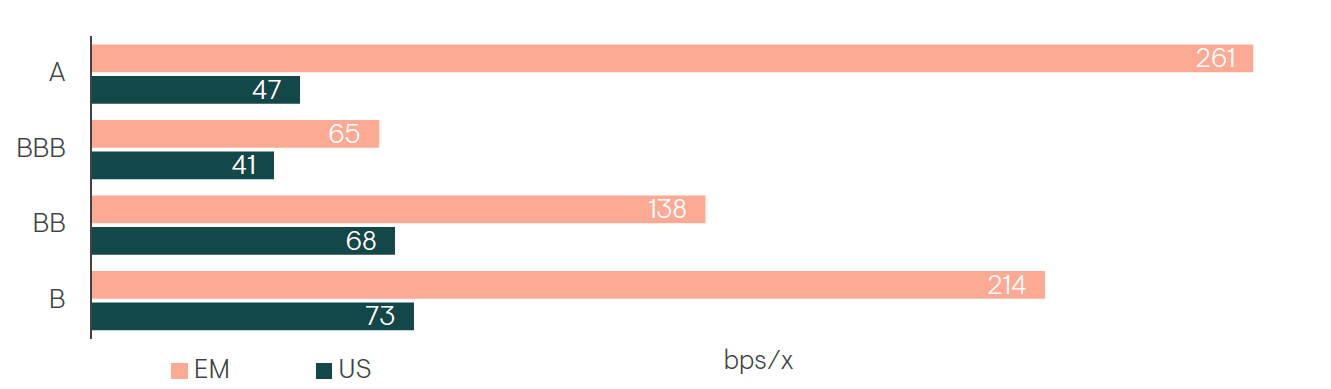
Source: Spreads as at 31 March 2024, BofA Merrill Lynch. Net Leverage as at 30 June 2023.
EM company financial strength has led to many improving credit stories, but sovereign credit deterioration/policy shifts have stymied some positive ratings actions and led to downgrades of corporates in some instances. EM companies retain access to multiple financing sources such as equity, local currency bonds and loans, yet many are capped by the rating of their governments; despite the superior fundamentals, their geography effectively drags down the rating. This creates compelling valuation opportunities for investors.
The temporary spike in leverage seen by EM companies in 2020 has reversed. Net leverage remains lower than it is in the US across rating buckets, and deleveraging through 2021 and beyond has resulted in many EM companies’ leverage metrics reaching multi-year lows.
Role in investor portfolios
Lower duration supports durability in different rate environments
Emerging market investment-grade corporate debt (EM IG) typically offers lower duration relative to its developed market counterparts. The lower duration of EM IG debt provides a bigger cushion than developed markets to mitigate the impact of a rise in rates or persistent rate volatility. We would, however, note that although EM IG has a lower duration than assets such US IG credit, it still has sufficient duration to benefit from a fall in interest rates. The favourable yield versus duration profile has contributed towards EM IG generating strong risk-adjusted returns compared to other traditional fixed income assets.
Table 1. EM IG yield and duration compared to other investment-grade asset classes
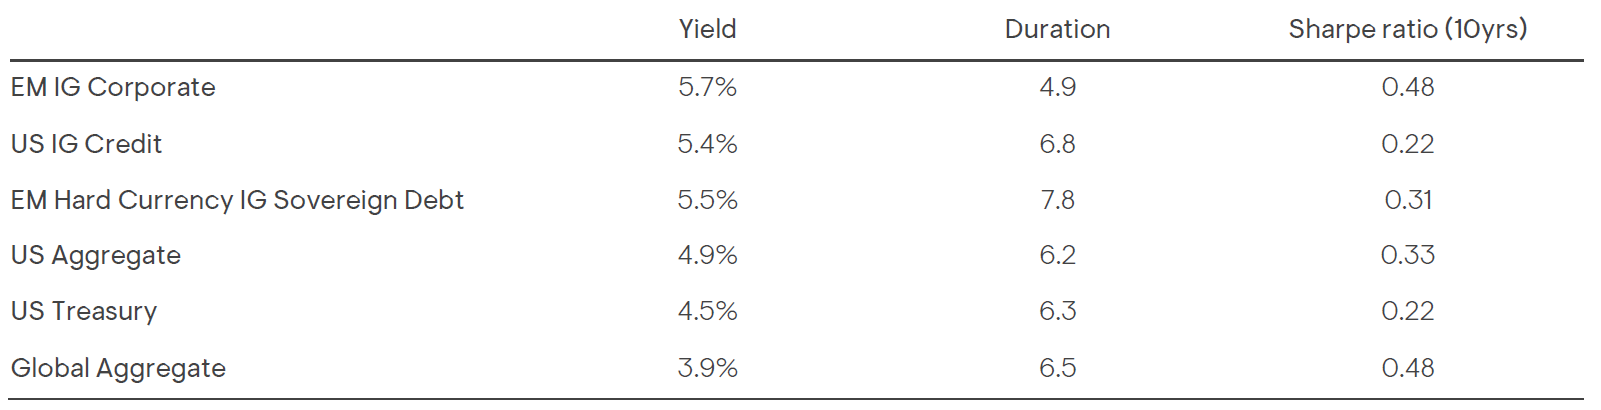
Source: Bloomberg, 31 March 2024. EM IG Corporate = JP Morgan CEMBI IG. US IG Credit = ICE BAML US Corporate Index. EM Hard Currency IG Sovereign Debt = JP Morgan EMBI IG. US Aggregate = ICE BAML US Broad Market Index. US Treasury = ICE BAML US Treasury Index. Global Aggregate = ICE BAML Global Broad Market Index. For further information on indices, please see the important information section.
Investors should also consider the advanced position of EM economies versus developed markets in their respective interest rate cycle. Many EM central banks were proactive in tackling inflation rather than chasing the US Federal Reserve, as was the case in prior periods. As a result, most EM central banks have now finished their hiking cycles, with some even beginning to cut interest rates, particularly in Latin America. Ultimately, this lends itself towards a more stable economic backdrop for EM companies.
Diversification properties relative to US Treasuries
One of the key attributes to consider when adding a new asset class to a portfolio mix is how it correlates with other asset classes. A look at the 10-year historical correlations across asset classes indicates that EM IG corporate debt offers additional diversification to US fixed income.
Table 2. Correlations – 10 years to end of March 2024
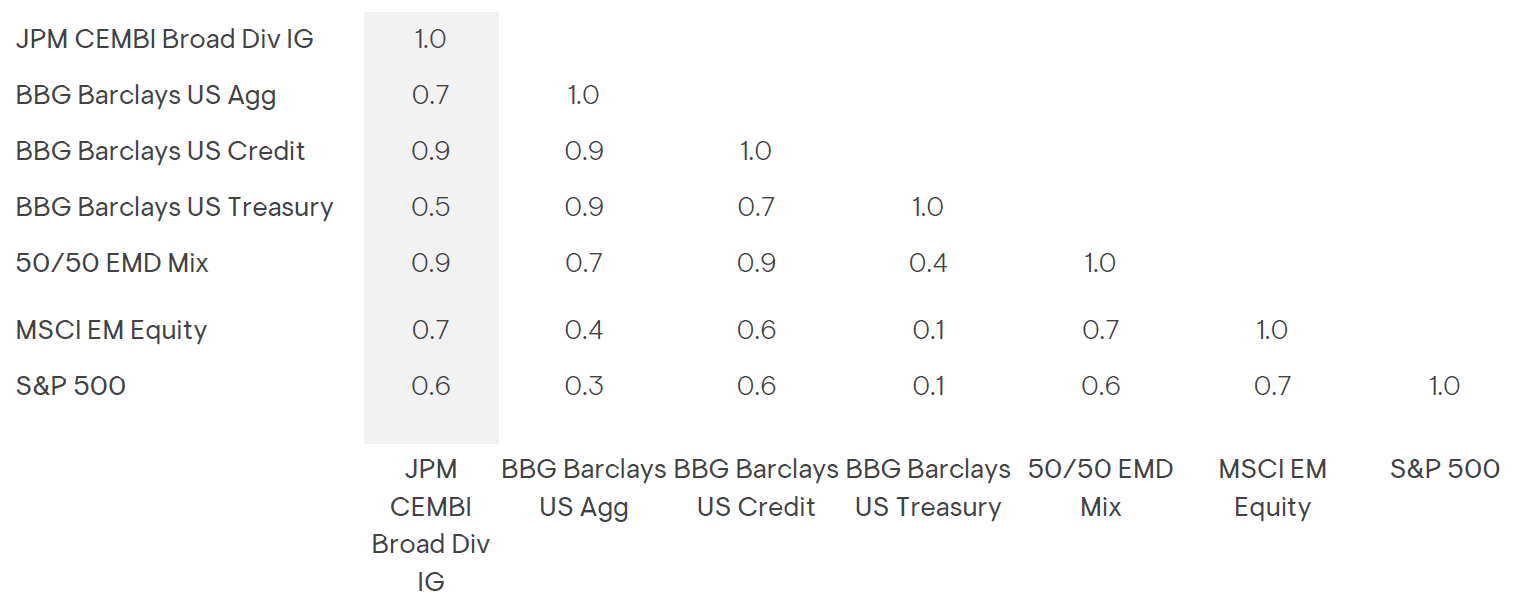
Source: JP Morgan, MSCI, S&P, Bloomberg, Ninety One as at 31 March 2024. 50/50 EMD Mix = 50% JP Morgan GBI-EM, 50% JP Morgan EMBI (JPEIDIVR Index). For further information on indices, please see the important information section.
Historical combinations of EM IG corporates and the US Aggregate over 10 years show how the diversification benefits play out on the efficient frontier. We believe the EM corporate universe is comparable enough to be considered within the same risk bucket but generates a differentiated enough return to warrant a standalone allocation. This is supported by the fact that the historical correlation (10 years) of EM and US IG credit spreads has been 0.85, reflecting the difference in growth cycles and supply & demand dynamics across the two markets. We find that adding EM IG can improve the overall risk-return outcome, with a 10-20% allocation optimal in this regard.
Fig 6. Efficient Frontier 10-year, JP Morgan CEMBI IG & US Agg
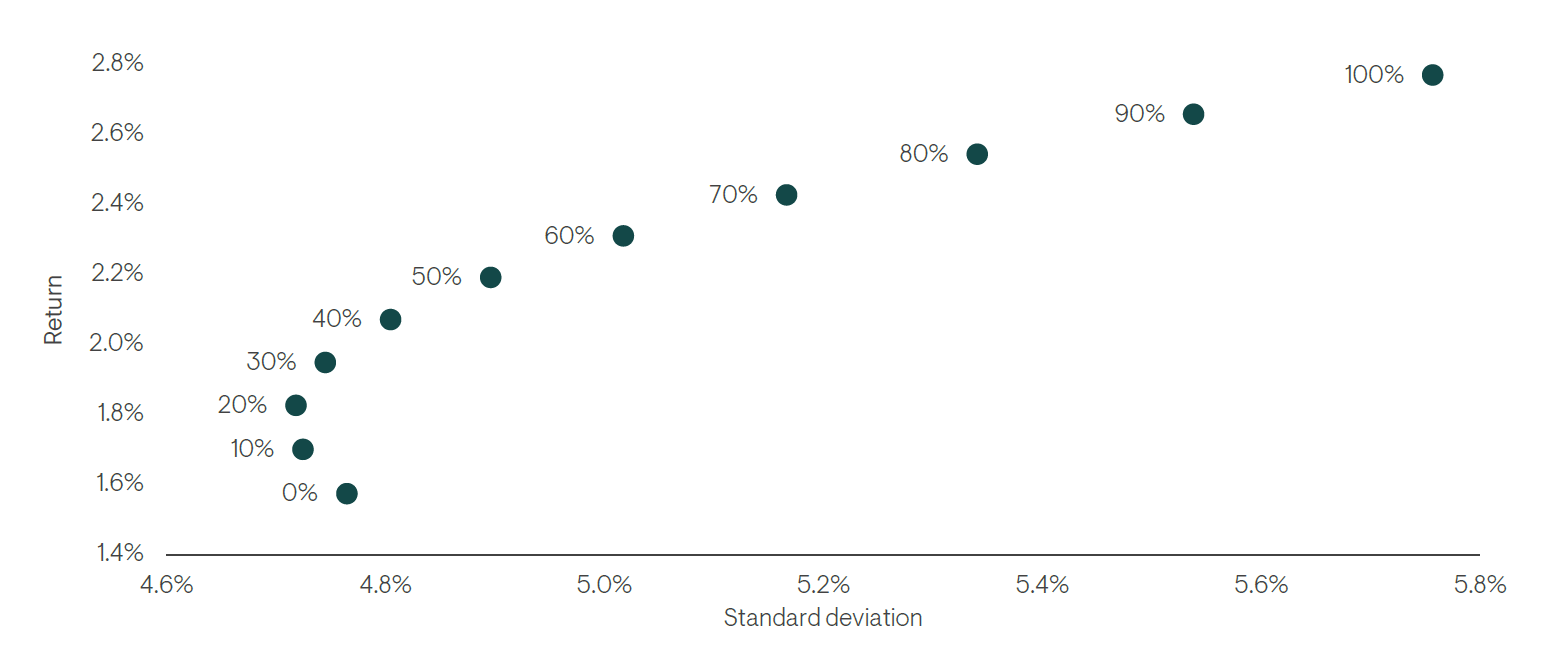
Past performance is not a reliable indicator of future results, losses may be made.
Sources: Ninety One, JP Morgan, Bloomberg; 31 March 2024 to 31 March 2024. X% in JP Morgan CEMBI IG, 1-X% in US Agg.
US Agg = ICE BAML US Broad Market Index, CEMBI IG = J.P. Morgan Corporate Broad EMBI Diversified High Grade Index (JBCDIGIG). Using monthly observations. For illustrative purposes. For further information on indices, please see the important information section.
Cyclical considerations
Macro themes are likely to continue to dominate as markets battle with the possibility of a global slowdown and question when interest rate cuts are likely to materialise, especially given the resilience of the US economy and stubborn inflation. However, US economic data continues to point towards a soft landing, which should be supportive for credit markets overall. Elsewhere, India, Indonesia, Malaysia and Philippines look set to have strong independent growth dynamics, while in Latin America interest rate cutting cycles seem set to continue into 2024 given easing in domestic inflation, albeit with more recent hawkishness from central banks. Ultimately, this should be supportive for emerging market credit spreads.
Solid fundamentals should facilitate a fall in default rates
Although EM corporate credit metrics such as leverage have come off their recent lows, company fundamentals remain healthy as companies put themselves in a strong position to navigate a tougher market environment by shoring up balance sheets. While rising costs have weighed on companies’ profit margins, leverage levels are manageable and FY2023 results released in the first quarter of 2024 paint a broadly resilient picture. Although more companies will have to refinance over 2024, low levels of leverage should limit the impact on corporate health; we expect default rates to continue to trend down. The more challenging backdrop is likely to widen the gap between winners and losers, supporting a more fundamentally driven investment approach.
Supportive supply/demand dynamics
We expect the tailwind of lower issuance rates to continue to support the asset class in 2024, and we have seen this dynamic play out at the start of the year. Issuance remained subdued in EM corporate markets in Q1, which is in stark contrast to developed markets, and US IG in particular, where there was a record quarter of issuance to end March. From a demand perspective, investors who have retreated from the asset class in recent years will need to see a turn in the US rate-hiking cycle and more evidence of a managed slowdown of the US economy and global economic resilience before returning. A calmer period in geopolitics will also be vital in helping support flows towards the asset class.
Yields continue to make the asset class compelling
Yields still look attractive, on both an absolute and relative basis, which is supportive of a stronger outlook for total returns. Sector and regional fundamentals vary, with bond prices reflecting substantially higher risk premia for lower-credit quality, especially negative cashflow businesses, where refinancing is more challenging. Income is what really matters to credit investors and the compounding effect on returns when reinvesting coupons at high yields is compelling. The chart below shows that when absolute yields are at their current levels, then the 12 month forward looking returns look attractive.
Fig 7. Distribution of 12 month forward returns when JP Morgan CEMBI BD Investment Grade yields are over 4.5%
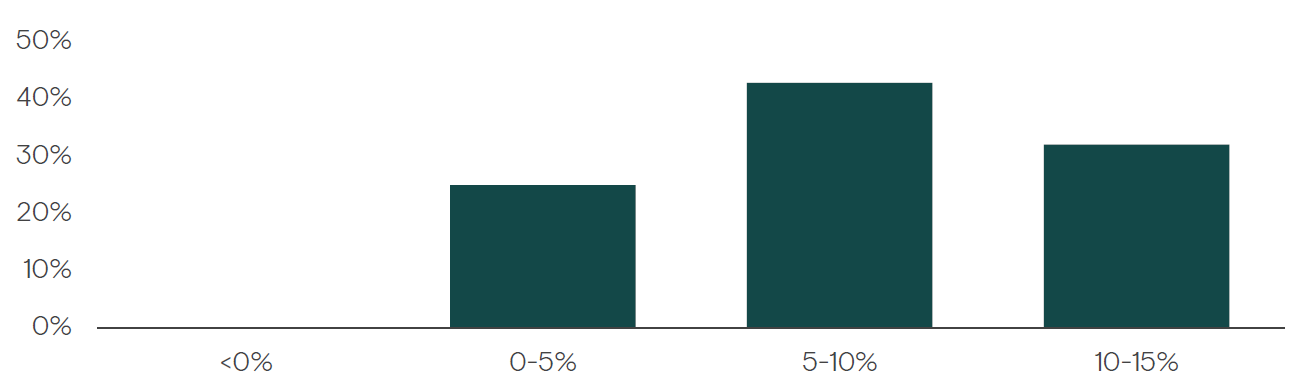
Source: JP Morgan, 31 March 2024. Represents the 12 month forward total return distribution in periods where the JP Morgan CEMBI IG has a yield to worst (YTW) over 4.5% (28 observations) over the last 10 years.
Conclusion
Investment-grade corporate bonds issued by emerging market companies offer investors a compelling way to meet their objectives without taking on excessive risk. The market spans a diverse range of regions and companies – with many of these market-leading global businesses.
We believe this fast-growing and increasingly diverse asset class, which has higher yields, lower duration and less leverage than US investment-grade debt for comparable credit quality, could provide a high-grade complementary solution to address investor’s needs.
This is an exciting and increasingly relevant opportunity for investors with the relevant expertise.
General risks: The value of investments, and any income generated from them, can fall as well as rise. Where charges are taken from capital, this may constrain future growth. Past performance is not a reliable indicator of future results. If any currency differs from the investor's home currency, returns may increase or decrease as a result of currency fluctuations. Investment objectives and performance targets are subject to change and may not necessarily be achieved, losses may be made. Environmental, social or governance related risk events or factors, if they occur, could cause a negative impact on the value of investments.
Specific risks: Currency exchange: Changes in the relative values of different currencies may adversely affect the value of investments and any related income. Default: There is a risk that the issuers of fixed income investments (e.g. bonds) may not be able to meet interest payments nor repay the money they have borrowed. The worse the credit quality of the issuer, the greater the risk of default and therefore investment loss. Derivatives: The use of derivatives may increase overall risk by magnifying the effect of both gains and losses leading to large changes in value and potentially large financial loss. A counterparty to a derivative transaction may fail to meet its obligations which may also lead to a financial loss. Interest rate: The value of fixed income investments (e.g. bonds) tends to decrease when interest rates rise. Liquidity: There may be insufficient buyers or sellers of particular investments giving rise to delays in trading and being able to make settlements, and/or large fluctuations in value. This may lead to larger financial losses than might be anticipated. Emerging market (inc. China): These markets carry a higher risk of financial loss than more developed markets as they may have less developed legal, political, economic or other systems.
Important information
This communication is for institutional investors and financial advisors only. It is not to be distributed to the public or within a country where such distribution would be contrary to applicable law or regulations.
The information may discuss general market activity or industry trends and is not intended to be relied upon as a forecast, research or investment advice. The economic and market views presented herein reflect Ninety One’s judgment as at the date shown and are subject to change without notice. There is no guarantee that views and opinions expressed will be correct and may not reflect those of Ninety One as a whole, different views may be expressed based on different investment objectives. Although we believe any information obtained from external sources to be reliable, we have not independently verified it, and we cannot guarantee its accuracy or completeness (ESG-related data is still at an early stage with considerable variation in estimates and disclosure across companies. Double counting is inherent in all aggregate carbon data). Ninety One’s internal data may not be audited. Ninety One does not provide legal or tax advice. Prospective investors should consult their tax advisors before making tax-related investment decisions.
Nothing herein should be construed as an offer to enter into any contract, investment advice, a recommendation of any kind, a solicitation of clients, or an offer to invest in any particular fund, product, investment vehicle or derivative. Investment involves risks. Past performance is not indicative of future performance. Any decision to invest in strategies described herein should be made after reviewing the offering document and conducting such investigation as an investor deems necessary and consulting its own legal, accounting and tax advisors in order to make an independent determination of suitability and consequences of such an investment. This material does not purport to be a complete summary of all the risks associated with this Strategy. A description of risks associated with this Strategy can be found in the offering or other disclosure documents. Copies of such documents are available free of charge upon request.
In the US, this communication should only be read by Institutional Investors (Accredited Investors and Qualified Purchasers), Financial Advisors (FINRA-registered Broker Dealers) and, at their exclusive discretion, their eligible clients. It must not be distributed to US Persons apart from the aforementioned recipients. THIS INVESTMENT IS NOT FOR SALE TO US PERSONS EXCEPT ACCREDITED INVESTORS AND QUALIFIED PURCHASERS. Note that returns will be reduced by management fees and that investment advisory fees can be found in Form ADV Part 2A.
Except as otherwise authorised, this information may not be shown, copied, transmitted, or otherwise given to any third party without Ninety One’s prior written consent. © 2024 Ninety One. All rights reserved. Issued by Ninety One, May 2024.
Additional information on our investment strategies can be provided on request.
Indices
Indices are shown for illustrative purposes only, are unmanaged and do not take into account market conditions or the costs associated with investing. Further, the manager’s strategy may deploy investment techniques and instruments not used to generate Index performance. For this reason, the performance of the manager and the Indices are not directly comparable.
If applicable MSCI data is sourced from MSCI Inc. MSCI makes no express or implied warranties or representations and shall have no liability whatsoever with respect to any MSCI data contained herein. The MSCI data may not be further redistributed or used as a basis for other indices or any securities or financial products. This report is not approved, endorsed, reviewed or produced by MSCI. None of the MSCI data is intended to constitute investment advice or a recommendation to make (or refrain from making) any kind of investment decision and may not be relied on as such.
If applicable FTSE data is sourced from FTSE International Limited (‘FTSE’) © FTSE 2024. Please note a disclaimer applies to FTSE data and can be found at www.ftse.com/products/downloads/FTSE_Wholly_Owned_Non-Partner.pdf
Sign Up Now for Full Access to Articles and Podcasts!
Unlock full access to our vast content library by registering as an institutional investor .
Create an accountAlready have an account ? Sign in