
AEW Capital Management -

Seniors Housing Market Perspective

IAUM_Article_Banner_AEW-SeniorsHousingMarketPerspective_1004x422

Michael Acton, CFA®
Managing Director, Head of Research & Strategy, North America


The seniors housing sector continues to benefit from a favorable combination of strengthening fundamentals, limited new supply, and improving capital market conditions. Revenue and NOI growth remained strong through the first half of 2026 as occupancy gains, healthy rent increases, and moderating expense pressures supported robust operating performance. At the same time, investment activity accelerated, reflecting growing confidence in the sector's long-term outlook.

Demand remains supported by needs-based occupancy drivers that are less sensitive to broader economic conditions than many other commercial real estate sectors. Resident move-ins continue to exceed move-outs, with net absorption remaining above its long-term average according to the National Investment Center for Seniors Housing & Care (NIC)1. Occupancy in NIC-tracked primary and secondary markets reached 90.1% during the second quarter, the highest level since late 2014 and 280 basis points above the pre-pandemic rate of 87.3%2. Performance improvements were broad-based across property types, with lower-acuity communities approaching 92% occupancy and higher-acuity properties reaching 89%, demonstrating continued recovery across the care continuum.

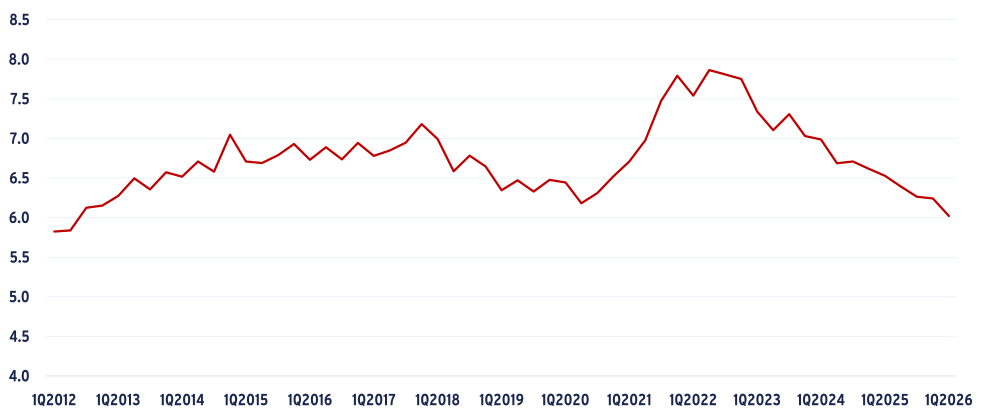
FIGURE 1: YEARS OF RENT - MEDIAN EXISTING HOME SALES PRICE/ANNUAL SENIORS HOUSING RENT

Figure 1 showing years of rent based on median existing home sales price and annual seniors housing rent

Source: NICMAP, Oxford Economics

Revenue growth remains healthy despite a moderation in rent increases from the inflation-driven peaks experienced in recent years. Operators continue to achieve mid- to high-single-digit rent growth while maintaining occupancy gains. The “Years-of-Rent” measure for a median home3 has declined to 6.0 years, a level last seen in 2012, compared with a peak of 7.9 years in mid-2022.

Revenue performance continues to meet or exceed budget expectations, and pricing power is expected to remain intact through the remainder of 2026. As operating cost pressures have eased, many portfolios continue to generate double-digit NOI growth. Labor remains the sector's primary operational challenge, both from a cost perspective and due to workforce shortages in certain markets where population outmigration has reduced the available pool of caregivers and support staff.

Supply conditions remain highly favorable for existing owners and operators. Development starts are at a record-low level as a percentage of inventory, constrained by limited financing availability and challenging construction economics. While recent increases in asset values have pushed some high-quality and stabilized properties above replacement cost, renewing developer interest, any meaningful addition to supply remains several years away. Over the past four quarters, groundbreakings totaled just over 9,000 units, representing less than 1.0% of inventory, the slowest pace ever recorded by NIC. At the same time, approximately half of the nation's seniors housing stock is now more than 25 years old, with functional obsolescence increasingly outpacing new supply additions. Only 2.2% of inventory is currently under construction, compared with annual absorption of 2.3%, continuing to support occupancy growth and pricing fundamentals.

Capital markets activity remained constructive as liquidity improved and lenders expanded their participation. Second-quarter transaction volume totaled $4.6 billion, marking the strongest second quarter of the past decade, driven largely by acquisition activity from publicly traded REITs. On a rolling four-quarter basis, transaction volume reached a ten-year high, reflecting increased market liquidity and investor confidence. Demand remained concentrated in institutional-quality assets located in primary markets, although the pricing gap between top-tier and lower-quality properties has started to narrow. Cap rates for institutional-quality assets generally range from the low-5% to mid-6% area, while pricing on a per-unit basis continues to trend higher.

Debt markets continue to become more supportive. Agency lenders, including Fannie Mae and Freddie Mac, remain active, banks have expanded lending activity, and debt funds have become more competitive, particularly for transitional and value-add investments. Refinancing markets remain constructive for borrowers with a clear path to stabilization. While construction financing continues to face resistance given replacement-cost challenges, publicly traded REITs have maintained access to unsecured debt markets on increasingly favorable terms.

Looking ahead, the sector is entering one of the strongest demographic growth periods in its history. The leading edge of the Baby Boomer generation is approximately 60% larger than the current resident base, creating a substantial increase in future demand that current inventory levels and the development pipeline are unlikely to fully accommodate. Combined with limited new construction, these trends are expected to support occupancy growth, rent increases, and investment performance over the coming decade. While labor constraints, aging inventory, and selective financing challenges remain important considerations, seniors housing may present attractive opportunities for some investors depending on objectives and risk tolerance.

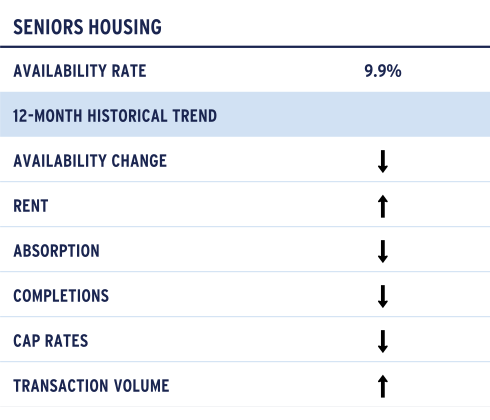
AEW seniors housing market summary showing vacancy, rent growth, absorption, completions, cap rates and transaction volume trends


 READ MORE FROM AEW

1 Across the primary and secondary markets tracked by NICMAP
2 As of Q4 2019
3 Median Existing Home Sales Price / Average NIC99 Seniors Housing Rent

This material is intended for information purposes only and does not constitute investment advice or a recommendation. The information and opinions contained in the material have been compiled or arrived at based upon information obtained from sources believed to be reliable, but we do not guarantee its accuracy, completeness or fairness. Opinions expressed reflect prevailing market conditions and are subject to change. Neither this material, nor any of its contents, may be used for any purpose without the consent and knowledge of AEW. There is no assurance that any prediction, projection or forecast will be realized.

Share this post

Sign Up Now for Full Access to Articles and Podcasts!

Unlock full access to our vast content library by registering as an institutional investor

Register

Contacts


AEW Capital Management

For 45 years, AEW Capital Management, L.P. (“AEW”) has provided real estate investment management services to investors worldwide. As one of the world’s largest real estate investment advisors¹, AEW and its affiliates manage $83.7 billion in private real estate equity, debt and listed securities across North America, Europe and Asia, as of June 30, 2026. Grounded in research and experienced in the complexities of the real estate and capital markets, AEW actively manages portfolios in both the public and private property markets and across the risk-return spectrum. AEW and its affiliates have offices in Boston, Los Angeles, Denver, London, Paris, Hong Kong, Seoul, Singapore, Sydney and Tokyo, as well as additional offices in eight European cities. 
For more information, visit www.aew.com.

¹Source: “2026 IREI.Q Real Estate Managers Guide”. The Guide, published annually by Institutional Real Estate, Inc., ranks real estate managers based on the gross value of real estate AUM ($m) as of December 31, 2025.  As of June 30, 2026. AEW includes (i) AEW Capital Management, L.P. and its subsidiaries and (ii) affiliated company AEW Europe and its subsidiaries. AEW Europe and AEW Capital Management, L.P. are commonly owned by Natixis Investment Managers and operate independently from each other.  Total AEW AUM of $83.7 billion includes $39.7 billion in assets managed by AEW Europe and its affiliates, $2.8 billion in regulatory assets under management of AEW Capital Management, L.P., and $41.2 billion in assets for which AEW Capital Management, L.P. and its affiliates provide (i) investment management services to a fund or other vehicle that is not primarily investing in securities (e.g., real estate), (ii) non-discretionary investment advisory services (e.g., model portfolios) or (iii) fund management services that do not include providing investment advice.  These figures are subject to minor variations due to rounding.  Exact figures are available upon request. 

Chad Nettleship
Insurance, Investor Relations
chad.nettleship@aew.com

617.261.9485


2 Seaport Lane
Boston, MA 02210


View the contributor page

Image
AEW.png

Sign Up Now for Full Access to Articles and Podcasts!

Unlock full access to our vast content library by registering as an institutional investor .

Create an account

Already have an account ? Sign in

Ѐ Ё Ђ Ѓ Є Ѕ І Ї Ј Љ Њ Ћ Ќ Ѝ Ў Џ А Б В Г Д Е Ж З И Й К Л М Н О П Р С ΄ ΅ Ά · Έ Ή Ί Ό Ύ Ώ ΐ Α Β Γ Δ Ε Ζ Η Θ Ι Κ Λ Μ Ν Ξ Ο Π Ρ Ё Ђ Ѓ Є Ѕ І Ї Ј Љ Њ Ћ Ќ Ў Џ А Б В Г Д Е Ж З И Й К Л М Н О П Р С Т У Ф Х Ц Ч Ш Ā ā Ă ă Ą ą Ć ć Ĉ ĉ Ċ ċ Č č Ď ď Đ đ Ē ē Ĕ ĕ Ė fi fl œ æ ß