Key Insights
- Active management of high yield bonds offers several advantages over a passive approach, in our view.
- Relative to equities, there are inherent complexities in bond markets that make it difficult and expensive to replicate the composition of an index.
- Active management allows for fundamental analysis across the full high yield universe as well as the ability to nimbly reposition a portfolio.
There is a strong case to be made for active management in high yield bonds, in our view, with an active approach offering several important advantages. Active management allows for fundamental analysis and security selection across the full high yield universe as well as the ability to nimbly reposition a portfolio to take advantage of macro trends or to capitalize on relative value opportunities.
We take an active, flexible, concentrated approach to the high yield market and seek to generate alpha1 through a high-conviction portfolio of best ideas. Our active approach is supported by proprietary fundamental credit research performed by a seasoned and collaborative team of investment professionals who focus exclusively on the high yield market. We believe our active approach to high yield can help improve investor outcomes and mitigate downside risks over the long term.
High Yield Indexes Are Difficult to Replicate
There are drawbacks associated with passive high yield investing. Particularly relative to equities, there are inherent complexities in bond markets that make it difficult and expensive to replicate the composition of an index or its returns:
- Large, Complex Investment Universe: Unlike stocks, which each have a single ticker symbol, bond issuers typically have multiple issues in the market. While the S&P 500 Index has roughly 500 constituents, the ICE BofA U.S. High Yield Constrained Index consists of 1,961 issues from about 925 issuers.2 As a result, investment decisions not only boil down to which companies to own but also which specific issues.
- Trading Costs and Complexities: High yield fixed income trading continues to be largely conducted over the counter rather than on an exchange like equities. As a result, trading costs are relatively high, making it expensive to build and manage a passive portfolio containing hundreds of issues. This is particularly challenging for passive exchange‑traded funds (ETFs) as many investors tend to use such vehicles for short-term tactical positioning, which involves trading in and out of the market frequently and at higher cost.
- High Turnover: Bond benchmark indexes have experienced significantly higher turnover than most equity indexes. New issuance, bond maturities, corporate actions such as tender offers, and credit rating upgrades and downgrades are all contributing factors that have caused the composition of the ICE BofA U.S. High Yield Constrained Index to continually change, resulting in higher index turnover relative to equities.
- Minimum Size Requirements: Most large passive ETFs impose minimum size requirements such as a minimum USD 1 billion outstanding face amount at the issuer level or a USD 400 million outstanding face value at the issue level. These restrictions can greatly reduce the investable universe and can result in passive ETF holdings being concentrated on the largest, most liquid bonds within the index.
As a result, tracking error for passively managed high yield strategies tends to be high relative to equities, and it has been very difficult for passive strategies to outperform over longer time periods.
How Active Managers Can Add Value
The high yield market provides a variety of compelling opportunities for active managers to add value. Here we highlight just some of the ways we seek to add value through active management:
- Security Selection Based on Fundamental Research
We believe the high yield market is inherently inefficient, and we rely heavily on proprietary fundamental research to identify and take advantage of various market inefficiencies. Our fundamental research enables us to find the specific securities that we believe to be mispriced or mis-rated. This can provide us with opportunities to anticipate credit rating upgrades or downgrades, which can materially impact performance. We are also able to incorporate a variety of environmental, social, and governance (ESG) factors in our research through this proprietary analysis. Finally, we take a concentrated approach to portfolio construction, giving clients a greater opportunity to benefit from our team’s best ideas.
- Utilization of the Full Opportunity Set…and More
As an active manager, we are not limited by the minimum issue size requirements that many passive ETFs are. Rather, we can invest across the entire universe of high yield names in looking to take advantage of opportunities among large‑, mid-, and small-cap issuers, both public and private, where market inefficiencies tend to abound due to limited research coverage or lack of broad market participation. Additionally, as an active manager we can opportunistically add out-of-benchmark exposures, such as bank loans or preferred securities.3
- Nimble Positioning and Relative Value Considerations
As an active manager, we can construct and position our portfolio to better align with our market outlook by overweighting or underweighting specific credit rating categories, industries, or securities based on economic trends, our relative value assessments, and our expectations for future risk-adjusted returns. This flexibility and nimbleness can be particularly important in periods characterized by rapidly changing market conditions or when certain sectors of the market are heavily in or out of favor. In contrast, passive strategies may be forced to own less attractive parts of the market at unjustifiable levels.Furthermore, we can be more opportunistic about the price at which we buy or sell a security and will only do so if we determine that a compelling entry point or total return opportunity for our portfolio exists. Passive investors tend to be “price takers,” automatically purchasing bonds at issuance or transacting when a security enters or leaves the index. This can also mean buying or selling securities at inopportune times, while as active managers we can buy at lower prices and sell at higher levels.
- Trading and Relationships With Wall Street Dealers
High yield fixed income trading continues to be largely conducted over the counter rather than on an exchange. Liquidity in the high yield bond market can be a challenge as individual bonds tend to trade much less actively than the typical stock and some may not even trade if held to maturity. As a result, specific bond issues are often not available in the desired amounts, and trading costs can be punitive. Also, issuers tend to sell limited quantities of new issues, so demand for attractively priced deals can be intense. As an active manager, we leverage our experience and long-term relationships with Wall Street bond dealers to source the specific deals and assets we want as well as to try to gain valuable market insights.
- Risk Management
Given the asymmetric risks associated with defaults in the high yield market—upside capped at par while downside from default is unlimited—it is important to note that an active approach permits more thorough risk management. Passive strategies typically weight holdings based on the market value of an issuer’s outstanding bonds. Thus, companies with the heaviest debt loads, which often are more likely to default, typically garner the largest weights in passive strategies.Through an active approach, we can assess the full corporate balance sheet, including current and future sources of revenues and cash flows, to determine which companies may be best positioned to meet both their current and future debt obligations. This assessment is particularly important when rates rise and the cost of debt funding increases. We also assess companies with respect to their willingness and ability to potentially engage in behaviors that could prove detrimental to bondholders, such as issuing new debt to buy back stock. We take an active and prudent approach to risk management. Our consistent and repeatable investment process has resulted in a strong default track record relative to the index over time.
Passive ETFs As Temporary Cash Management Allocation
While we certainly believe that we can add value within high yield through active management, there are times and places where utilizing a passive high yield ETF can make sense. We occasionally utilize passive high yield ETFs to gain broad market exposure on a short-term, temporary basis for the purposes of liquidity and cash management. That said, passive ETFs are not a primary part of our investment approach, nor do they typically serve as a mainstay allocation in our portfolio.
Our Philosophy and Approach
The US High Yield Bond Strategy objective is total return, and secondarily, current income. It seeks to generate a total return in excess of that of the index by investing primarily in U.S. dollar‑denominated high yield corporate bonds and other fixed‑ and floating-rate corporate securities. The strategy is designed to provide a concentrated yet balanced portfolio primarily focused on the traditional U.S. high yield bond investment opportunity set. We aim to actively deliver alpha in three primary ways:
- Experienced Team
Our strategy is managed by a seasoned team of experienced high yield professionals, the core of which has been together for over 15 years and has managed through multiple market cycles. Our team focuses exclusively on the high yield market and takes a collaborative approach to the portfolio, ensuring that every idea that makes it into the portfolio has been heavily vetted by the entire team and considered from multiple perspectives.
- Proprietary Fundamental Research
We rely on proprietary fundamental bottom-up research to uncover inefficiencies in the high yield market and identify high-conviction total return opportunities for our portfolio. We assign a proprietary credit rating, spread4 target, and ESG score5 to each name that we assess. These metrics force us to identify specific catalysts for future spread compression and total return, creating a natural sell discipline in our portfolio.
- Concentrated Portfolio of Best Ideas
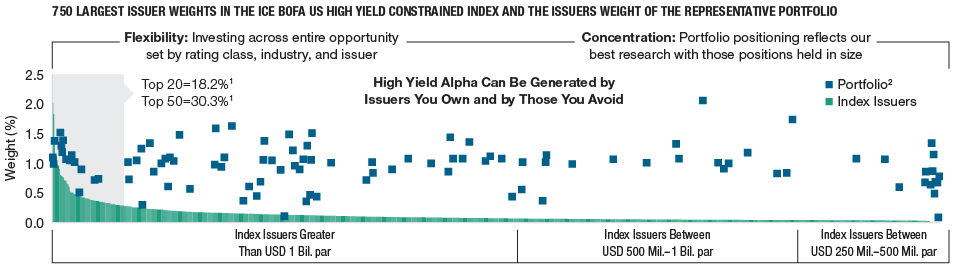
We invest flexibly across the entire universe of U.S. high yield names, including all industries, ratings, and market caps. As we identify investment opportunities, we look to own positions in size. We believe our concentrated approach (maximum of 200 issuers, with roughly 100 holdings in the portfolio as of 11/30/2022) strikes the right balance between providing appropriate diversification while also delivering a portfolio of best ideas to our clients. Our size and concentrated approach allow us to be flexible and nimble in adjusting the portfolio as market conditions change.
High Yield Index Investing Not Optimal
(Fig. 1) We take a concentrated “best ideas” approach
As of September 30, 2022.
1 Top 20 and Top 50 percentages are for the index.
2 US High Yield Bond Representative Portfolio.
The representative portfolio is an account in the composite we believe most closely reflects current portfolio management style for the strategy. Performance is not a consideration in the selection of the representative portfolio. The characteristics of the representative portfolio shown may differ from those of other accounts in the strategy. The GIPS® Composite Report is available upon request.
Please see Additional Disclosure page for information about this ICE BofA information.
Sources: ICE BofA, T. Rowe Price.
Active Credit Quality Positioning
(Fig. 2) US High Yield Bond Representative Portfolio—The portfolio’s credit quality stance has evolved
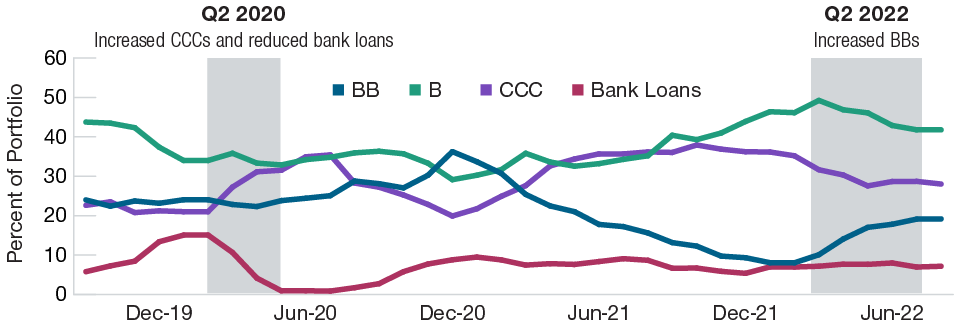
As of September 30, 2022.
Credit ratings for the securities held in the portfolio are provided by Moody’s, Standard & Poor’s and Fitch and are converted to the Standard & Poor’s nomenclature. A rating of “AAA” represents the highest-rated securities, and a rating of “D” represents the lowest rated securities. When a rating is available from all three agencies, the median rating is used. If there are two ratings, the lower rating is used and if only one rating is available, that rating is used. If a rating is not available, the security is classified as Not Rated (NR). The rating of the underlying investment vehicle is used to determine the creditworthiness of credit default swaps and sovereign securities. The portfolio is not rated by any agency.
The representative portfolio is an account in the composite we believe most closely reflects current portfolio management style for the strategy. Performance is not a consideration in the selection of the representative portfolio. The characteristics of the representative portfolio shown may differ from those of other accounts in the strategy. The GIPS® Composite Report is available upon request.
Source: T. Rowe Price.
Active Management in Action
Example 1: Credit Quality Positioning
We aggressively added risk in the form of CCC rated exposure in the second quarter of 2020 during the height of COVID-19 lockdowns in aiming to take advantage of very compelling entry points in names that we believed ultimately would recover. We also reduced bank loan exposure when it became apparent that the Federal Reserve would aggressively cut rates. In 2022, we added exposure to the BB rated segment as we were finding good opportunities to invest in higher‑quality high yield names at attractive dollar prices resulting from a primarily rates‑driven sell-off and in anticipation of a slowdown in growth.
Example 2: Energy Weight Relative to Index
We underweighted the energy sector by as much as 800–900 basis points6 relative to the benchmark during the downturn in energy prices in 2014–2016, which turned out to be a good decision at what was a very bad time for the energy sector. A passive approach might have resulted in a double-digit market weight position in energy at exactly the time when energy prices plummeted. Coming out of the pandemic, we shifted to an overweight position in the sector given strong industry tailwinds. In late 2022, we began to actively reduce our energy exposure based on valuations and as spreads within the sector have tightened significantly.
Energy Exposure Adapts to Outlook
(Fig. 3) Energy weighting relative to benchmark index*
As of September 30, 2022.
*US High Yield Bond Representative Portfolio vs. ICE BofA U.S. High Yield Constrained Index.
Industry classification was determined by ICE BofA.
The representative portfolio is an account in the composite we believe most closely reflects current portfolio management style for the strategy. Performance is not a consideration in the selection of the representative portfolio. The characteristics of the representative portfolio shown may differ from those of other accounts in the strategy. The GIPS® Composite Report is available upon request.
Sources: T. Rowe Price and ICE BofA. Please see Additional Disclosure page for information about this
ICE BofA information.
Example 3: “Best Ideas Portfolio” Driven by Fundamental Research
The cruise line subsector represents a roughly 2% market weight in the ICE BofA U.S. High Yield Constrained Index across five distinct issuers as of November 30, 2022. Rather than taking an index‑weight position in all five, we performed fundamental analysis to identify our single highest-conviction issuer within the sector, ultimately selecting the one with the greatest scale and diversification relative to peers.
We then selected the issuance that we believed offered the greatest relative value and risk-adjusted return potential. We established a position and then opportunistically added to it over time as market events and news flow created attractive entry points in the name.
1 Alpha is the excess return of an investment relative to its benchmark.
2 As of September 30, 2022.
3 Preferred stock pays a set fixed or floating dividend, giving it characteristics of both bonds and equities.
4 Credit spreads measure the additional yield that investors demand for holding a bond with credit risk over a similar-maturity, high-quality government security.
5 We focus on the ESG factors we consider most likely to have a material impact on the performance of the holdings in the portfolio.
6 A basis point is 0.01 percentage point.
Download PDF
Authors
Kevin Loome, CFA
Portfolio Manager, U.S. High Yield Bond Strategy
Ashley Wiersma
Portfolio Specialist
Important Information
This material is being furnished for general informational and/or marketing purposes only. The material does not constitute or undertake to give advice of any nature, including fiduciary investment advice, nor is it intended to serve as the primary basis for an investment decision. Prospective investors are recommended to seek independent legal, financial and tax advice before making any investment decision. T. Rowe Price group of companies including T. Rowe Price Associates, Inc. and/or its affiliates receive revenue from T. Rowe Price investment products and services. Past performance is not a reliable indicator of future performance. The value of an investment and any income from it can go down as well as up. Investors may get back less than the amount invested.
The material does not constitute a distribution, an offer, an invitation, a personal or general recommendation or solicitation to sell or buy any securities in any jurisdiction or to conduct any particular investment activity. The material has not been reviewed by any regulatory authority in any jurisdiction.
Information and opinions presented have been obtained or derived from sources believed to be reliable and current; however, we cannot guarantee the sources’ accuracy or completeness. There is no guarantee that any forecasts made will come to pass. The views contained herein are as of the date written and are subject to change without notice; these views may differ from those of other T. Rowe Price group companies and/or associates. Under no circumstances should the material, in whole or in part, be copied or redistributed without consent from T. Rowe Price.
The material is not intended for use by persons in jurisdictions which prohibit or restrict the distribution of the material and in certain countries the material is provided upon specific request. It is not intended for distribution to retail investors in any jurisdiction.
USA—Issued in the USA by T. Rowe Price Associates, Inc., 100 East Pratt Street, Baltimore, MD, 21202, which is regulated by the U.S. Securities and Exchange Commission. For Institutional Investors only.
© 2023 T. Rowe Price. All Rights Reserved. T. ROWE PRICE, INVEST WITH CONFIDENCE, and the Bighorn Sheep design are, collectively and/or apart, trademarks of T. Rowe Price Group, Inc.
ID0005579 (01/2023)
202212-2647900