
The End of the Great Moderation: Forecasting in Elevated Uncertainty

Testifying to Congress in February 2005, then Federal Reserve Chair Alan Greenspan famously described the U.S. bond market as a “conundrum.” Although the Fed raised its policy rate at each meeting over the previous year, Chair Greenspan observed, the yield on the 10-year Treasury note was essentially unchanged—and the yield curve was flat as a pancake.
Of course, when the leader of the world’s most important central bank scratches his head in public, many people get to work. One of those people was then Fed Governor Ben Bernanke. He delivered a speech soon after Greenspan’s testimony, arguing that low long-term bond yields were largely due to elevated global savings. This was especially true, Governor Bernanke noted, in fast-growing Asian economies, such as China, that were generating massive trade surpluses (denominated in dollars) and recycling those surpluses into the U.S. bond market as a store of value—under the expectation that the prevailing equilibrium of low growth, low inflation, and low interest rates would persist.
It was a fair assumption to make. After all, this was the heyday of “Great Moderation” in the global economy and a unipolar moment in world history. Inflation had been falling for 25 years. Growth was low but stable. Financial crises were a fading memory. The U.S. federal government’s budget had been in surplus earlier in the decade, after which Treasury stopped issuing the 30-year bond. Central banks across the globe had earned unprecedented credibility to fine tune the economy like a machine. In fact, the mainstream press lionized Chair Greenspan as a maestro.
Meanwhile, political and geopolitical cross currents were calm. In the U.S., the central players in both the Republican and Democratic parties were centrists. Voting patterns in Congress across the aisle only differed at the margin. At a global level, the world was still reaping dividends from the end of the cold war. Francis Fukuyama’s best-selling book, The End of History, captured the zeitgeist of the moment. Many believed the contest of ideologies was over. The notorious “isms” of the 20th century—communism, nationalism, and totalitarianism—were out. Democratic capitalism and global supply chains were in. Indeed, China joined the World Trade Organization in 2001, fulfilling Deng Xiaoping’s dream from two decades prior. Russia joined the rich club of democracies in 1997 to make the G7 the G8. The BRICS were the equivalent of the Beatles among emerging economies, lifting hundreds of millions out of poverty. Europe was forging a path towards union with the introduction of a common currency in 1999. And the entire world was being lifted by a technology-led productivity boom.
Not even two decades later, it’s a laughable understatement to quip that “things have changed.” It might be more accurate to say, “things have fallen apart.” We’re now in a global environment with more complexity and uncertainty than the world has experienced in at least three decades and arguably since the end of World War II. Unlike the era of Great Moderation, when growth, inflation, and rates settled into a low-volatility equilibrium, we must now acknowledge the possibility of vastly different combinations of growth and inflation outcomes—with vastly different policy implications—plus more frequent regime shifts across these macroeconomic paradigms. Figure 1 reflects the shift from the era of Great Moderation to a far more uncertain macroeconomic environment.
Figure 1: Regime Shift—The end of the Great Moderation introduces an era of volatility in U.S. growth and inflation (z-score)
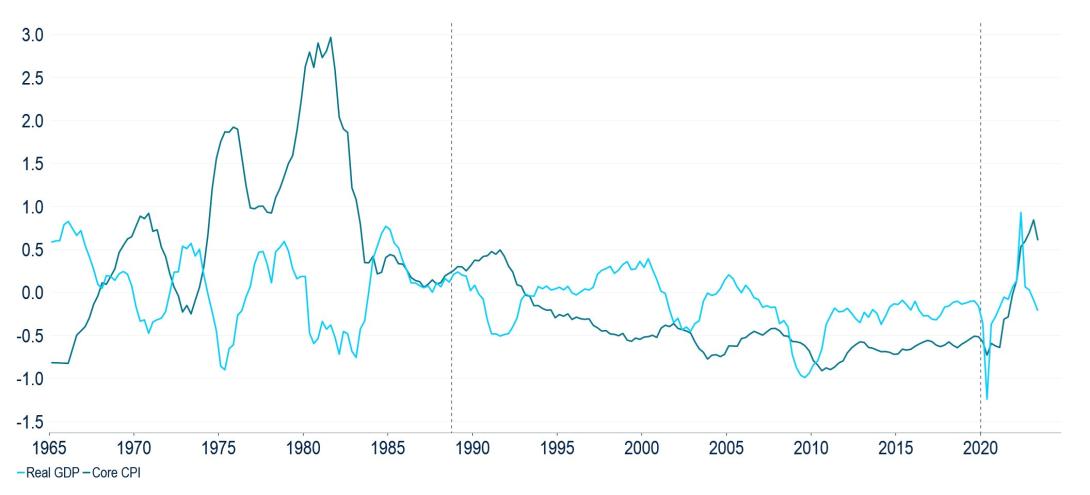
Source: PGIM Fixed Income and Macrobond. Volatility measured as the two-year moving average of the deviations of annualized quarterly changes from the mean.
Against this backdrop, we’ve explicitly adopted a probabilistic, scenario-based approach to forecasting macroeconomic and market outcomes. After all, market prices are themselves nothing more than a weighted synthesis of expectations formed by millions of market participants. Our objective is to anticipate how shifts in expectations may reprice markets over the forecast horizon. The output is a set of projections for how portfolios are likely to perform—particularly to the upside and downside—under a range of macroeconomic scenarios.
We’re taking this approach for two reasons. First, to avoid over-reliance on a single base-case scenario and the false precision of point forecasts. Second, to incorporate a sense of humility into forecasting by forcing us to imagine a full distribution of potential outcomes.
Implementing a Scenario-Based Approach
In terms of how we implement the framework, we start by designing and assigning probabilities to a handful of macroeconomic scenarios that we think markets may price over our forecast horizon.1 The primary value in this step is the process of identifying the relative probabilities across scenarios; the specific probabilities assigned to each scenario are secondary (for most recent scenarios, see our Quarterly Outlook and the Appendix to this post). We then translate our probability distribution of macroeconomic scenarios to expected returns for a set of asset classes. When our probability-weighed return expectations differ from market pricing of these asset classes, we see investment opportunity.
As we map out macroeconomic scenarios, we aim for them to be distinct enough to capture potential regime shifts, without seeking to be fully exhaustive of all possible outcomes. Our assessment of the macroeconomic outlook, which is based on analysis of demand- and supply-side factors that drive growth and inflation outcomes, anchors the probabilities that we assign to each scenario. But our approach also incorporates other important drivers, such as monetary and fiscal policy reaction functions as well as geopolitical developments, to reflect the complexity of the market environment.
Building on our probability distribution of scenarios, we can then consider a broad range of “what if” risks, including those with “fat” tails, as an overlay to the symmetry of risks. Indeed, there will always be very low-probability events—both positive and negative—with potentially game-changing macroeconomic and market-related effects. While we tend not to incorporate these tails explicitly as standalone scenarios in our framework (unless their probability exceeds a minimal threshold, usually around 5%), we force ourselves to imagine and flesh out how these scenarios might unfold with tabletop and “pre-mortem” exercises that seek to identify leading indicators for disruptive events.
From Macroeconomic Scenarios to Asset Class Views
Our asset class views are a collection of price forecasts and expected returns under each scenario over one year, using probability-weighted macroeconomic assumptions as the key input to generating fair value estimates. In most cases, our fair value models rely on regression analysis that links asset prices to a variety of macro and market variables with which they have an intuitive statistical relationship.2 We complement the fair value analysis with other potential drivers (e.g., secular factors, financial imbalances, and market technicals) that we think also influence asset prices over our forecast horizon. The model output consists of asset prices and expected returns for each asset class across all scenarios—in other words, a probability distribution of asset prices and expected returns across scenarios (Figure 2).
Figure 2: Macro scenarios and other inputs form the basis of our probabilistic assessment of expected returns.
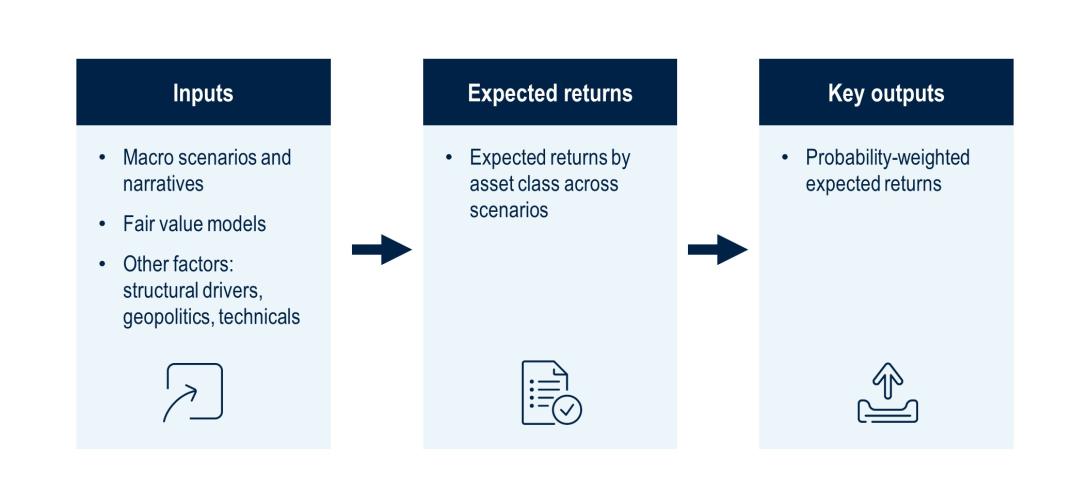
Source: PGIM Fixed Income
The resulting distribution of asset prices has rich information content that we use to inform our market views. For example, we can summarize the information with a measure of central tendency, such as the probability-weighted average of asset prices. This constitutes our “best guess” forecast for each of the asset classes that we follow. This measure may deviate from our base case forecast if the alternative scenarios have a significant upside or downside skew relative to it. By comparing our “probability-weighted” forecast with market prices, we can immediately see whether our views are bullish or bearish relative to the market. And we can also assess factors behind the views. For example, is it a high-conviction, directional view reflected in our base case? Or is it a view mostly derived from the balance of risks of our scenarios? Finally, our framework also allows us to study the potential upside or downside in asset prices associated with our scenarios.
Figure 3 helps illustrate some of these concepts using our probability distribution of option-adjusted spreads (OAS) for European high yield. Our base case has a 40% probability and our OAS forecast associated with it is not very different from the market spread. Our probability-weighted average OAS is wider than in the base case because it is “skewed” to the right by two bearish (wider spreads) scenarios (Recession and Stagflation) that have 25% and 10% probability mass, respectively. This suggests that our bearish view on European high yield credit spreads is driven by this scenario “asymmetry,” rather than by the base case forecast. In other words, our scenarios flag a 35% chance of wider spreads that we would be ignoring had we only presented a point estimate based on our base case. Finally, and critically, Figure 3 also gives us a sense of the upside-downside potential for spreads across scenarios. Our widest spread level (between 800-900 bps) is more extreme, relative to market pricing, than our tightest one (between 200-300 bps).
Figure 3: Example of a Base Case and Alternative Scenarios for a Spread Product (probability, %)
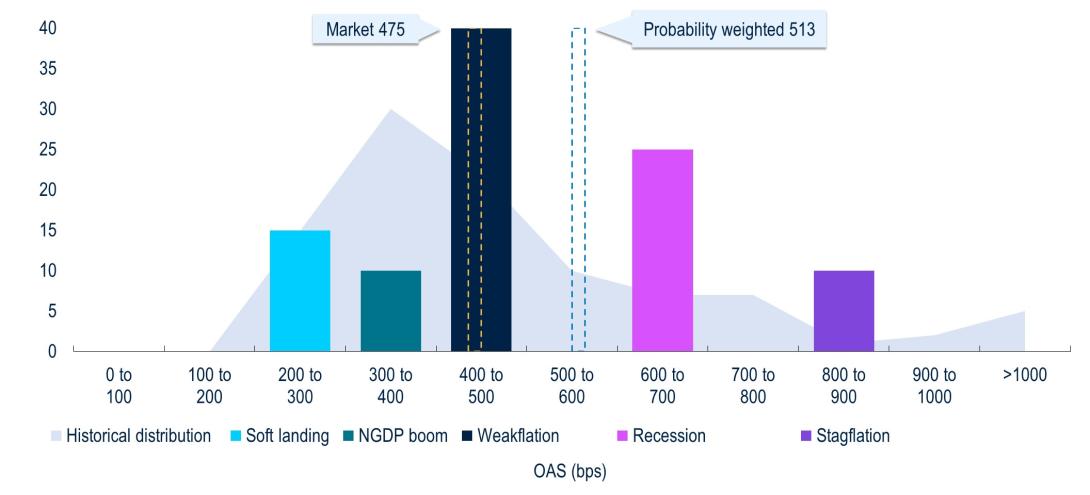
Source: PGIM Fixed Income as of June 2023.
Updating our Views
We update our forecasts periodically (at least quarterly) to reflect relevant incoming information. This means that our views evolve over time as we assess and incorporate relevant macroeconomic and market developments. In the current data-dependent environment, these updates could include more changes to the scenarios relative to expectations under less-volatile conditions.
That said, as long-term investors, we strive not to change our scenario assumptions unless warranted by a shift in the assumptions, risks, and /or implications of macroeconomic fundamentals. Moreover, it’s important to emphasize that adjustments to our forecasts are independent of current market pricing and reflect changes to the outlook over the forecast horizon based on incoming information.
Applying our Framework at a Portfolio Level
Our framework allows us to carry out sensitivity analysis at a portfolio level. Our tools allow us to extend our “what if” analysis to track the expected performance of complex, multi-sector portfolios in each of our scenarios. We have designed these tools to be interactive, so our portfolio managers can also assess the sensitivity of their portfolios to different assumptions in the scenario probabilities, as well as to changes in portfolio allocations. Finally, as with the asset class-specific analysis, these tools also allow us to assess the upside and downside in potential portfolio performance across all scenarios (Figure 4).
Figure 4: Example of Potential Active Returns Across Scenarios in a Multi-sector Portfolio3
 Source: PGIM Fixed Income as of June 2023.
Concluding Thoughts
The uncertainty inherent in a paradigm shift is two-fold: it’s not only the unknown that lies ahead, but it’s the familiarity of what’s left behind. As the global economy moves past the relative stability of the Great Moderation, it’s now progressing through an era of historic complexity where point forecasts simply fail to capture the range of potential outcomes. By assigning probabilities to macroeconomic scenarios and market outcomes, we can readily identify investment opportunities when our probability-weighted return estimates differ from market pricing, and our portfolio managers can test the sensitivity of their portfolios under various macro scenarios.
Indeed, in this environment, the biggest shortcomings of risk management will not be failures of memory, but rather those of imagination. Our North Star is to continually ask “what if?” in an effort to avoid surprises and to be prepared when the unexpected inevitably arises.
Appendix
United States - Potential Scenarios and Probability
Weakflation (35%)
Tight monetary, fiscal, and credit conditions combine to weaken growth to just above flat. Meanwhile, the labor market remains solid enough to keep services inflation too high and persistent for the Fed to reduce policy rates from the peak by more than 50-75 basis points. Risk assets perform reasonably well, though high inflation prevents longer-maturity yields from rallying.
Recession (25%)
The labor market runs out of steam, denting income and spending just when the combined weight of tight monetary, fiscal, and credit conditions begins to mount. Unemployment rises abruptly and inflation falls with a lag, leading to a substantial Fed easing cycle starting in Q4 2023 and extending to below neutral rates. U.S. rates rally and risky assets correct lower.
Soft Landing (25%)
Growth remains resilient near or even above trend levels (1.6-1.8%), while inflation converges decisively towards the 2% PCE target. Banking woes ease and the labor market softens but remains robust enough to power consumption. The Fed cuts rates as inflation cools and growth remains resilient. Favorable environment for interest rates and risk assets.
Nominal GDP Boom (10%)
The economy demonstrates historic levels of insensitivity to interest rates, with growth re-accelerating above trend while inflation stays well above 2%. Above-target inflation means the Fed keeps nudging policy towards a tighter stance, leading to higher rates relative to forwards. Rates curve stays inverted. Mixed performance by risky assets.
Roaring 2020s (5%)
U.S. growth accelerates above trend, supported by high productivity growth as the dividend of public investments, and diffusion of AI and other technologies. Inflation drops rapidly as productivity gains ease labor shortages and generate a positive supply shock, allowing the Fed to ease policy towards a neutral stance. All financial assets rally strongly.
1 While we are investors who seek to deliver strong performance over long-term horizons, for the purpose of our scenario analysis, we use a one-year forecast horizon.
2 These include, for example, the Fed policy rate as well as inflation and growth forecasts for our U.S. 10-year Treasury model.
3 See the Appendix for definitions of the scenarios listed.
Read More From PGIM Fixed Income
Source(s) of data (unless otherwise noted): PGIM Fixed Income, as August 1, 2023.
For Professional Investors only. Past performance is not a guarantee or a reliable indicator of future results and an investment could lose value. All investments involve risk, including the possible loss of capital.
PGIM Fixed Income operates primarily through PGIM, Inc., a registered investment adviser under the U.S. Investment Advisers Act of 1940, as amended, and a Prudential Financial, Inc. (“PFI”) company. Registration as a registered investment adviser does not imply a certain level or skill or training. PGIM Fixed Income is headquartered in Newark, New Jersey and also includes the following businesses globally: (i) the public fixed income unit within PGIM Limited, located in London; (ii) PGIM Netherlands B.V., located in Amsterdam; (iii) PGIM Japan Co., Ltd. (“PGIM Japan”), located in Tokyo; (iv) the public fixed income unit within PGIM (Hong Kong) Ltd. located in Hong Kong; and (v) the public fixed income unit within PGIM (Singapore) Pte. Ltd., located in Singapore (“PGIM Singapore”). PFI of the United States is not affiliated in any manner with Prudential plc, incorporated in the United Kingdom or with Prudential Assurance Company, a subsidiary of M&G plc, incorporated in the United Kingdom. Prudential, PGIM, their respective logos, and the Rock symbol are service marks of PFI and its related entities, registered in many jurisdictions worldwide.
These materials are for informational or educational purposes only. The information is not intended as investment advice and is not a recommendation about managing or investing assets. In providing these materials, PGIM is not acting as your fiduciary. PGIM Fixed Income as a general matter provides services to qualified institutions, financial intermediaries and institutional investors. Investors seeking information regarding their particular investment needs should contact their own financial professional.
These materials represent the views and opinions of the author(s) regarding the economic conditions, asset classes, securities, issuers or financial instruments referenced herein. Distribution of this information to any person other than the person to whom it was originally delivered and to such person’s advisers is unauthorized, and any reproduction of these materials, in whole or in part, or the divulgence of any of the contents hereof, without prior consent of PGIM Fixed Income is prohibited. Certain information contained herein has been obtained from sources that PGIM Fixed Income believes to be reliable as of the date presented; however, PGIM Fixed Income cannot guarantee the accuracy of such information, assure its completeness, or warrant such information will not be changed. The information contained herein is current as of the date of issuance (or such earlier date as referenced herein) and is subject to change without notice. PGIM Fixed Income has no obligation to update any or all of such information; nor do we make any express or implied warranties or representations as to the completeness or accuracy.
Any forecasts, estimates and certain information contained herein are based upon proprietary research and should not be interpreted as investment advice, as an offer or solicitation, nor as the purchase or sale of any financial instrument. Forecasts and estimates have certain inherent limitations, and unlike an actual performance record, do not reflect actual trading, liquidity constraints, fee. These materials are not intended as an offer or solicitation with respect to the purchase or sale of any security or other financial instrument or any investment management services and should not be used as the basis for any investment decision. PGIM Fixed Income and its affiliates may make investment decisions that are inconsistent with the recommendations or views expressed herein, including for proprietary accounts of PGIM Fixed Income or its affiliates.
Investing in the bond market is subject to risks, including market, interest rate, issuer, credit, inflation risk, and liquidity risk. The value of most bonds and bond strategies are impacted by changes in interest rates. Bonds and bond strategies with longer durations tend to be more sensitive and volatile than those with shorter durations; bond prices generally fall as interest rates rise, and low interest rate environments increase this risk. Reductions in bond counterparty capacity may contribute to decreased market liquidity and increased price volatility. Bond investments may be worth more or less than the original cost when redeemed. Mortgage- and asset-backed securities may be sensitive to changes in interest rates, subject to early repayment risk, and while generally supported by a government, government agency or private guarantor, there is no assurance that the guarantor will meet its obligations. High yield, lower-rated securities involve greater risk than higher-rated securities; portfolios that invest in them may be subject to greater levels of credit and liquidity risk than portfolios that do not. Investing in foreign-denominated and/or -domiciled securities may involve heightened risk due to currency fluctuations, and economic and political risks, which may be enhanced in emerging markets. Currency rates may fluctuate significantly over short periods of time and may reduce the returns of a portfolio. Commodities contain heightened risk, including market, political, regulatory and natural conditions, and may not be suitable for all investors. Diversification does not ensure against loss.
In the United Kingdom, information is issued by PGIM Limited with registered office: Grand Buildings, 1-3 Strand, Trafalgar Square, London, WC2N 5HR. PGIM Limited is authorised and regulated by the Financial Conduct Authority (“FCA”) of the United Kingdom (Firm Reference Number 193418). In the European Economic Area (“EEA”), information is issued by PGIM Netherlands B.V., an entity authorised by the Autoriteit Financiële Markten (“AFM”) in the Netherlands and operating on the basis of a European passport. In certain EEA countries, information is, where permitted, presented by PGIM Limited in reliance of provisions, exemptions or licenses available to PGIM Limited under temporary permission arrangements following the exit of the United Kingdom from the European Union. These materials are issued by PGIM Limited and/or PGIM Netherlands B.V. to persons who are professional clients as defined under the rules of the FCA and/or to persons who are professional clients as defined in the relevant local implementation of Directive 2014/65/EU (MiFID II). In certain countries in Asia-Pacific, information is presented by PGIM (Singapore) Pte. Ltd., a Singapore investment manager registered with and licensed by the Monetary Authority of Singapore. In Japan, information is presented by PGIM Japan Co. Ltd., registered investment adviser with the Japanese Financial Services Agency. In South Korea, information is presented by PGIM, Inc., which is licensed to provide discretionary investment management services directly to South Korean investors. In Hong Kong, information is provided by PGIM (Hong Kong) Limited, a regulated entity with the Securities & Futures Commission in Hong Kong to professional investors as defined in Section 1 of Part 1 of Schedule 1 (paragraph (a) to (i) of the Securities and Futures Ordinance (Cap.571). In Australia, this information is presented by PGIM (Australia) Pty Ltd (“PGIM Australia”) for the general information of its “wholesale” customers (as defined in the Corporations Act 2001). PGIM Australia is a representative of PGIM Limited, which is exempt from the requirement to hold an Australian Financial Services License under the Australian Corporations Act 2001 in respect of financial services. PGIM Limited is exempt by virtue of its regulation by the FCA (Reg: 193418) under the laws of the United Kingdom and the application of ASIC Class Order 03/1099. The laws of the United Kingdom differ from Australian laws. In Canada, pursuant to the international adviser registration exemption in National Instrument 31-103, PGIM, Inc. is informing you that: (1) PGIM, Inc. is not registered in Canada and is advising you in reliance upon an exemption from the adviser registration requirement under National Instrument 31-103; (2) PGIM, Inc.’s jurisdiction of residence is New Jersey, U.S.A.; (3) there may be difficulty enforcing legal rights against PGIM, Inc. because it is resident outside of Canada and all or substantially all of its assets may be situated outside of Canada; and (4) the name and address of the agent for service of process of PGIM, Inc. in the applicable Provinces of Canada are as follows: in Québec: Borden Ladner Gervais LLP, 1000 de La Gauchetière Street West, Suite 900 Montréal, QC H3B 5H4; in British Columbia: Borden Ladner Gervais LLP, 1200 Waterfront Centre, 200 Burrard Street, Vancouver, BC V7X 1T2; in Ontario: Borden Ladner Gervais LLP, 22 Adelaide Street West, Suite 3400, Toronto, ON M5H 4E3; in Nova Scotia: Cox & Palmer, Q.C., 1100 Purdy’s Wharf Tower One, 1959 Upper Water Street, P.O. Box 2380 - Stn Central RPO, Halifax, NS B3J 3E5; in Alberta: Borden Ladner Gervais LLP, 530 Third Avenue S.W., Calgary, AB T2P R3.
© 2023 PFI and its related entities.
2023-5729
Sign Up Now for Full Access to Articles and Podcasts!
Unlock full access to our vast content library by registering as an institutional investor .
Create an accountAlready have an account ? Sign in