
The US Insurance Investing Landscape: Midyear 2023 Check-In

Gary Zhu, CFA | Director—Insurance Portfolio Management | Global Head—Multi-Sector Insurance Deanna Leighton, CFA | Portfolio Manager—Multi-Sector Insurance Portfolio Management Dmytro Mukhin, PhD, FSA, CFA | North America Senior Insurance Strategist
A little more than halfway through 2023, it’s a good time to revisit key themes we believed would matter to insurance investors this year.
The themes range from macro considerations to investment trends and regulatory developments. Our overarching view? A reshaped opportunity set calls for a selective approach and taking risk in a disciplined way. This perspective hasn’t changed, especially with questions surrounding the future macroeconomic picture and a fair amount of volatility. Spreads on US investment-grade corporate bonds and 10-year Treasury bond yields are a case in point (Display).
A Winding Road for Yields and Spreads So Far in 2023
US Investment-Grade Corporate Credit Spreads and US Treasury Yields
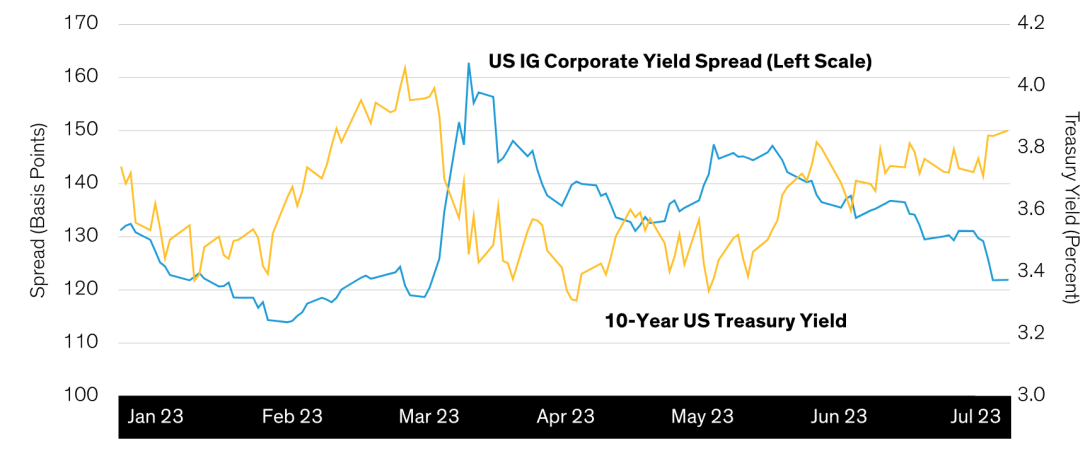
Past performance does not guarantee future results IG: investment grade As of July 7, 2023 Source: Bloomberg After several large swings this year, both are now back essentially to where they started, though the drivers varied. Credit spreads widened in the first half of May, for example, as cash sat on the sideline. Amid building confidence from a surprisingly resilient US economy, that money sought to capitalize on higher spreads, which have trended downward since. As we sit just past the midway point of the year, let’s revisit each of our four themes, how they’ve played out and where insurance investors can find value.
Stay Close to Target Duration in the Face of Continued Volatility
We’re still calling for insurers to stay close to home with interest-rate exposure. Both equities and rates have been very volatile throughout the first half of 2023 (Display), though equity volatility subsided late in June, falling to its lowest level since July 2020. As for rates, the Federal Reserve is likely closing in on the end of its hiking cycle, but the exact path and timing of a pause—or even a pivot to rate cuts—remains cloudy.
Equity Volatility Is Down, but Rates Are Still Volatile
Equity and Interest-Rate Volatility Indices
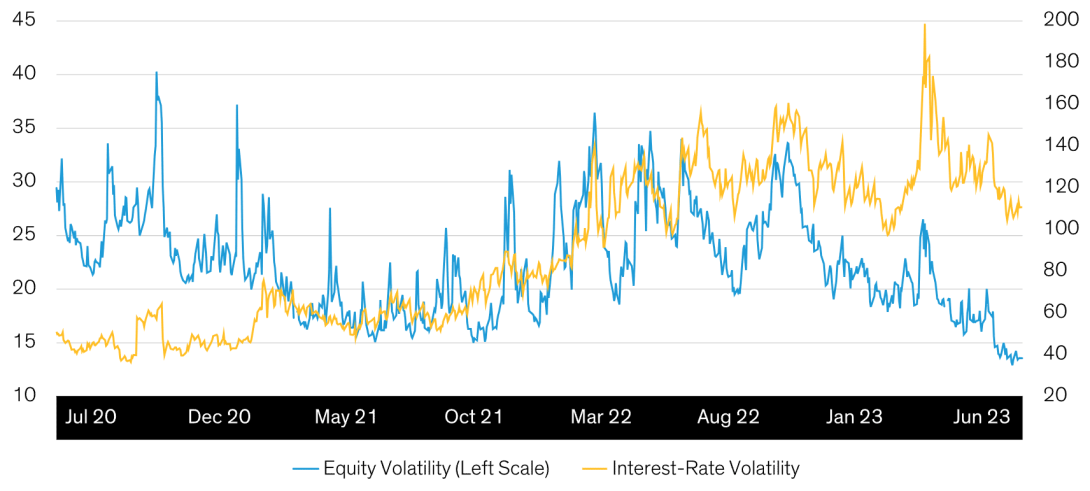
Past performance does not guarantee future results Equity volatility is represented by the VIX (Chicago Board Options Exchange Volatility Index) and interest-rate volatility by the MOVE (Merrill Lynch Option Volatility Estimate). As of July 7, 2023 Source: Bloomberg As investors await central bank policy shifts and get used to a “higher for longer” regime, we wouldn’t be surprised to see continued volatility. For insurers wishing to cushion their portfolios, we think keeping duration close to target should help. Investors with a wider tolerance for asset-liability mismatches should also ensure they’re being compensated enough for the added interest-rate volatility accompanying a US economic slowdown and continued credit softening.
Emphasize Quality and Diversification as Credit Environment Softens
Our view coming into 2023 was that corporate credit allocations should emphasize quality and diversification with a potential economic slowdown. This seems to have been validated so far, and we maintain that view. We still expect the economy to gradually return toward normal as inflation decelerates and growth slows to near zero. This could increase default risk, though default rates should ultimately be manageable by historical standards. It’s not out of the question, however, for rating agencies to take precautionary actions and downgrade investment-grade bonds on the cusp of high-yield status. These actions could bring unwanted headaches to insurers managing regulatory capital budgets, but a diversified approach and selective bond choices should help reduce any negative ratings migration. Another reason for diversification and selectivity is the sizable differences in the fortunes of various bond-market segments, even with spreads and rates ending up where they started. Shorter-maturity credit spreads haven’t declined as much as intermediate- and long-term spreads, for example, and nonfinancials have outperformed financials, especially regional and consumer-finance companies (Display).
Yield and Spread Changes Have Varied Across Fixed Income
Year-to-Date Spread/Yield Change (Basis Points)
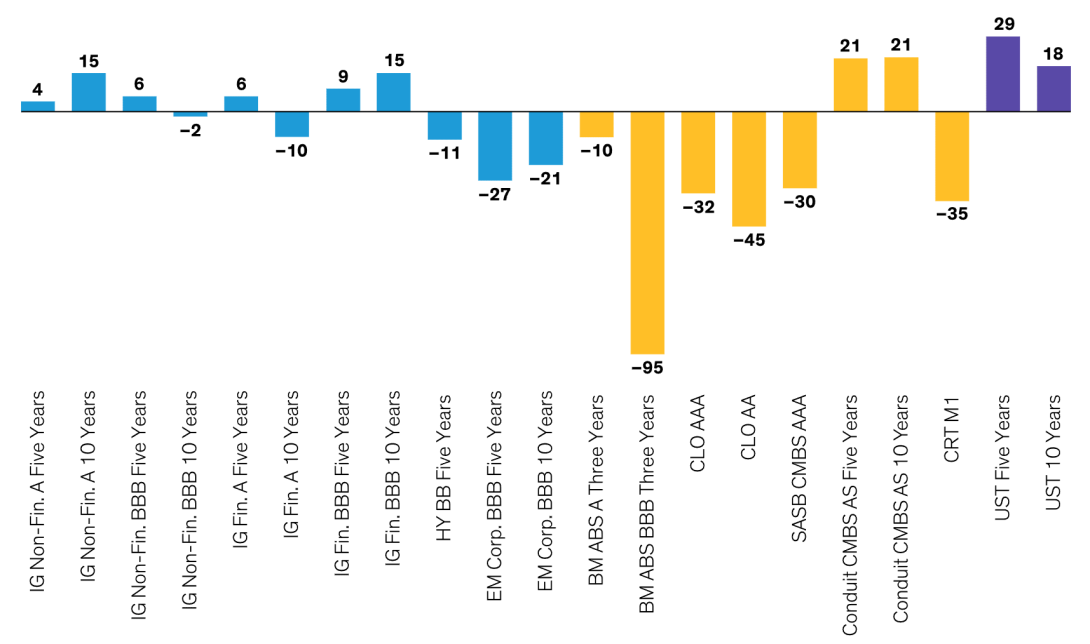
Past performance does not guarantee future results ABS is Asset-Backed Securities; AS reflects the junior AAA tranche of CMBS; BM is Benchmark; CLO is Collateralized Loan Obligation; CMBS is Commercial Mortgage-Backed Security; CRT is Credit Risk–Transfer Security; Corp. is Corporate; EM is Emerging Market; Fin. is Financial; HY is High Yield; IG is Investment Grade; Non-Fin is Non-Financial; SASB is Single-Asset Single-Borrower; UST is US Treasury. IG and HY figures reflect the US IG and US HY corporate bond market. UST reflects year-to-date change in yield; all other sectors reflect change in spread. As of June 23, 2023 Source: Bloomberg, J.P. Morgan, Wells Fargo and AB High-yield bonds have generally outperformed their investment-grade counterparts so far in 2023, particularly in the wake of the regional banking sector fallout in mid-March (Display). However, from a relative-value perspective, we remain relatively cautious on high yield as we move through the later stages of the credit cycle, when fundamental stresses increase.
Risk Asset Spreads Have Fallen the Most Since the Banking Sell-Off
Spread/Yield Change since March 17, 2023 (Basis Points)  Past performance does not guarantee future results ABS is Asset-Backed Securities; AS reflects the junior AAA tranche of CMBS; BM is Benchmark; CLO is Collateralized Loan Obligation; CMBS is Commercial Mortgage-Backed Security; CRT is Credit Risk–Transfer Security; Corp. is Corporate; EM is Emerging Market; Fin. is Financial; HY is High Yield; IG is Investment Grade; Non-Fin is Non-Financial; SASB is Single-Asset Single-Borrower; UST is US Treasury. IG and HY figures reflect the US IG and US HY corporate bond market. UST reflects year-to-date change in yield; all other sectors reflect change in spread. As of June 23, 2023 Source: Bloomberg, J.P. Morgan, Wells Fargo and AB Emerging-market (EM) debt has been a higher-beta outperformer so far, but, as we’ve said, its spread relationship with US investment-grade corporate bonds is a key input. That relationship isn’t overly compelling, so we don’t see much advantage from increasing allocations. However, we still think EM debt has value as a diversifier for insurance portfolios, with select opportunities in intermediate-term BBB corporates and higher-quality sovereign issuers rated A or higher.
Securitized Assets Still Compelling Overall, but Relative Value Matters
We see good reason for securitized assets to remain the most attractive option for insurance portfolios, though opportunities vary quite a bit among securitized segments. At the beginning of 2023, our view was that higher-yield spreads, structural protection and fundamentals in line with expectations made asset-backed securities (ABS) the most attractive securitized opportunity for insurers. For the most part, that thesis has held up, with a strong economy and jobs market bolstering investors’ confidence: spreads in BBB-rated ABS, for example, have declined markedly. Despite that strong run, high-quality tranches still look attractive. Coming into 2023, we were generally cautious on commercial real estate based on valuations, and from the perspective of conduit commercial mortgage-backed securities (CMBS), fundamental concerns have persisted, and spreads remain wide. The single-asset, single-borrower CMBS market has fared better, with spreads falling roughly 30 basis points this year, albeit with increased fragmentation among different property types. In residential real estate, credit risk–transfer security spreads have also declined, mainly because regional housing woes didn’t spread nationally and home prices showed early signs of improvement. We still believe that AA-rated collateralized loan obligations (CLO) are loss-remote and a good opportunity at current valuations. Manager selection is key, with an emphasis on stable loan platforms that have demonstrated longevity and growth potential. Regulatory work by the National Association of Insurance Commissioners (NAIC) on the modeling of CLOs and other securitized assets seems unlikely, at this point, to have much impact on most AA-rated broadly-syndicated loan CLOs. We still see substantial value remaining in securitized assets (Display). For one thing, most segments offer higher spreads than comparable investment-grade corporate bonds. And, historically speaking, the spread advantage of high-quality securitized assets versus investment-grade corporates is near the 80th percentile or higher versus the past five years, which is very attractive.
Securitized Assets Offer Strong Relative Value
Cross-Sector Spread Relationships vs. US Investment-Grade Corporates
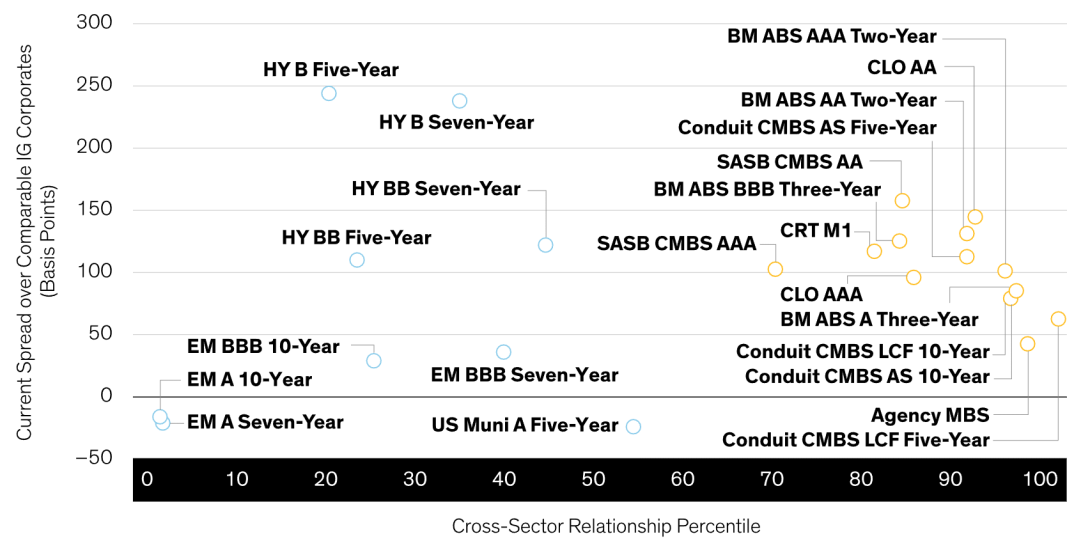
Past performance and current analysis do not guarantee future results. Cross-sector relationship percentile measures an asset’s current spread advantage over US investment-grade corporates relative to its historical advantage. A cross-sector relationship percentile of 90 indicates the 90th percentile versus the five-year historical range, so a higher percentile indicates stronger relative value. Blue circles indicate credit asset classes; yellow circles indicate securitized asset classes. ABS is Asset-Backed Securities; AS reflects the junior AAA tranche of CMBS; BM is Benchmark; CLO is Collateralized Loan Obligation; CMBS is Commercial Mortgage-Backed Security; CRT is Credit Risk–Transfer Security; EM is Emerging Market; HY is High Yield; LCF is Last Cash Flow; SASB is Single-Asset Single-Borrower. HY figures reflect the US HY corporate bond market. As of June 23, 2023 Source: Bloomberg, J.P. Morgan, Wells Fargo and AB Agency mortgage-backed securities (MBS) are an extreme example. They tend to offer lower spreads than US investment-grade corporates but now offer almost 50 basis points more—near the 100th percentile historically. Possible headwinds from technical conditions could keep these spreads on the higher side, but we think insurance investors who can accept convexity risk should consider agency MBS as a viable trade-off, given the likely risk of downward credit-rating migration in corporate bonds.
Regulatory Decision: Capital Treatment for Residual Tranches of Structured Securities
We previously outlined three important initiatives for the NAIC in 2023, and there hasn’t been much more than conversations on two of them.
The first is a revised definition of bonds that could trigger equity treatment on some securities currently classified as fixed income. The second is a new proposal on how to treat notes or equity interests issued by some funds, which could end their advantageous capital charges. To be fair, we didn’t expect an answer yet: it will take time for the NAIC and industry to work through the issues, given the potential material impact on insurers’ portfolios. We’ll continue to monitor these efforts.
The NAIC has, however, reached an interim and long-term solution on the third initiative: insurers’ capital treatment of the residual tranches of structured securities. The winning approach was suggested in a June 9, 2023 letter from the Texas Department of Insurance (Appendix 2, page 11). The NAIC will maintain the 30% base charge for residual tranches for 2023, adding a 15% sensitivity-test factor.
The sensitivity test is to be removed in 2024 (the factor will be set to zero), with the base charge increasing to 45% unless new data or analyses support a different charge. The interim solution isn’t particularly rigorous or quantitatively driven, but nevertheless a welcome development. Our view on this issue hasn’t changed much since the NAIC originally proposed the rule change: it’s unlikely to materially affect the majority of insurers—even those with the highest exposures.
The views expressed herein do not constitute research, investment advice or trade recommendations and do not necessarily represent the views of all AB portfolio-management teams. Views are subject to change over time.
Sign Up Now for Full Access to Articles and Podcasts!
Unlock full access to our vast content library by registering as an institutional investor .
Create an accountAlready have an account ? Sign in