AEW Capital Management -

U.S. Economic and Property Market Outlook: Growth is Fundamental

AEWFeatured

Michael Acton, CFA® - Head of Research & Strategy, North America


The U.S. economy continues to expand at a moderate pace despite geopolitical uncertainty, trade friction, and renewed inflation pressure. The key story remains the AI-led investment cycle, which is now an important driver of business spending and broader economic activity.

Summary

  • Growth remains positive, but uneven. Real GDP grew at a 1.5% annualized rate in Q2, supported by solid consumption and continued AI-related capital spending, even as trade and inventory effects weighed on headline growth.

  • Labor availability is becoming the bigger constraint. Job growth has reaccelerated modestly in 2026, but labor force growth has turned negative in five of the past six months and participation has fallen from 62.8% at year-end 2023 to 61.5% in June.

  • Inflation and rates remain the main macro headwinds. Inflation has reaccelerated with energy shocks tied to the Iran conflict, real yields have moved higher, and the 30-year Treasury yield ended July at its highest level in twenty years.

  • Commercial real estate fundamentals remain generally resilient. NPI total returns have been positive for eight consecutive quarters, driven primarily by income rather than appreciation, while most sectors are still expected to generate moderate positive NOI growth over the next three to five years.

  • In this environment, fundamentals matter more. With rates likely to stay higher for longer, income growth, capital discipline, sector selection, and market-level differentiation should matter more than cap rate compression or financial engineering.

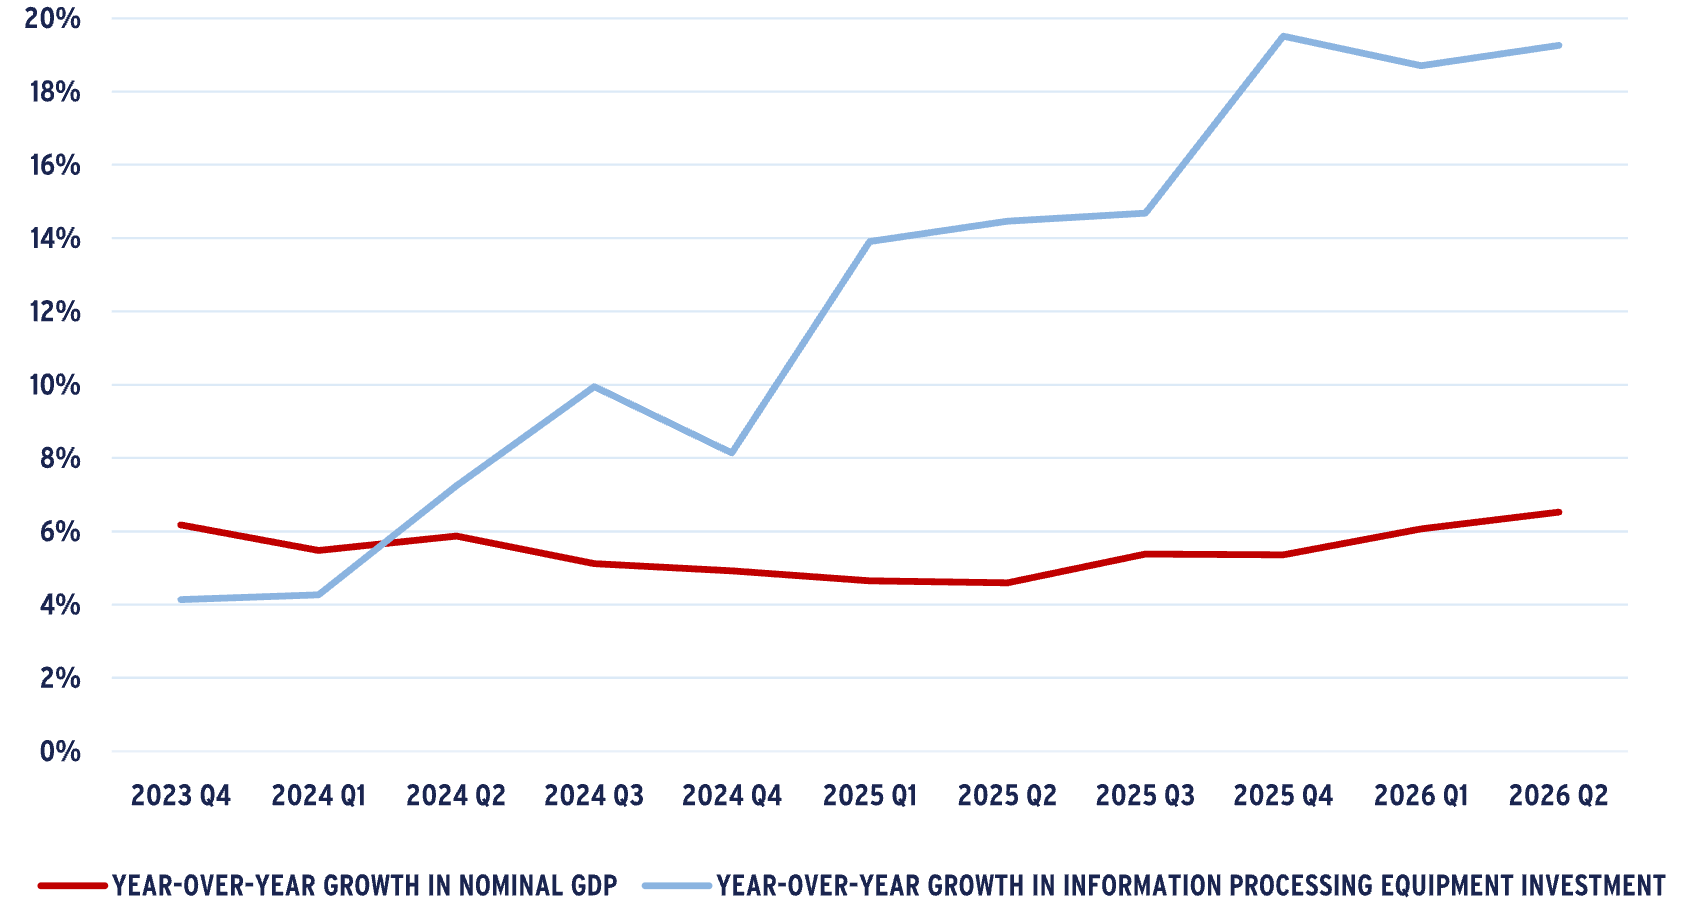
Despite significant headwinds from the on-again, off-again war with Iran, heightened energy market volatility, and renewed trade uncertainty, the U.S. economy continues to expand. Real GDP grew at a 1.5% annualized rate during the second quarter, supported by 3.2% real consumption growth and offset by drags from trade and inventories. The underlying engine of growth remains the outsized AI-driven capex boom at the center of the current late-cycle expansion. This investment continues to increase at an annual rate of nearly 20%, even as investors increasingly question the durability of the cycle.


FIGURE 1: GROWTH IN INFORMATION PROCESSING EQUIPMENT INVESTMENT AND NOMINAL GDP
Image
Line graph comparing growth in nominal GDP and information processing equipment investment

Source: Bureau of Economic Analysis (BEA)
 

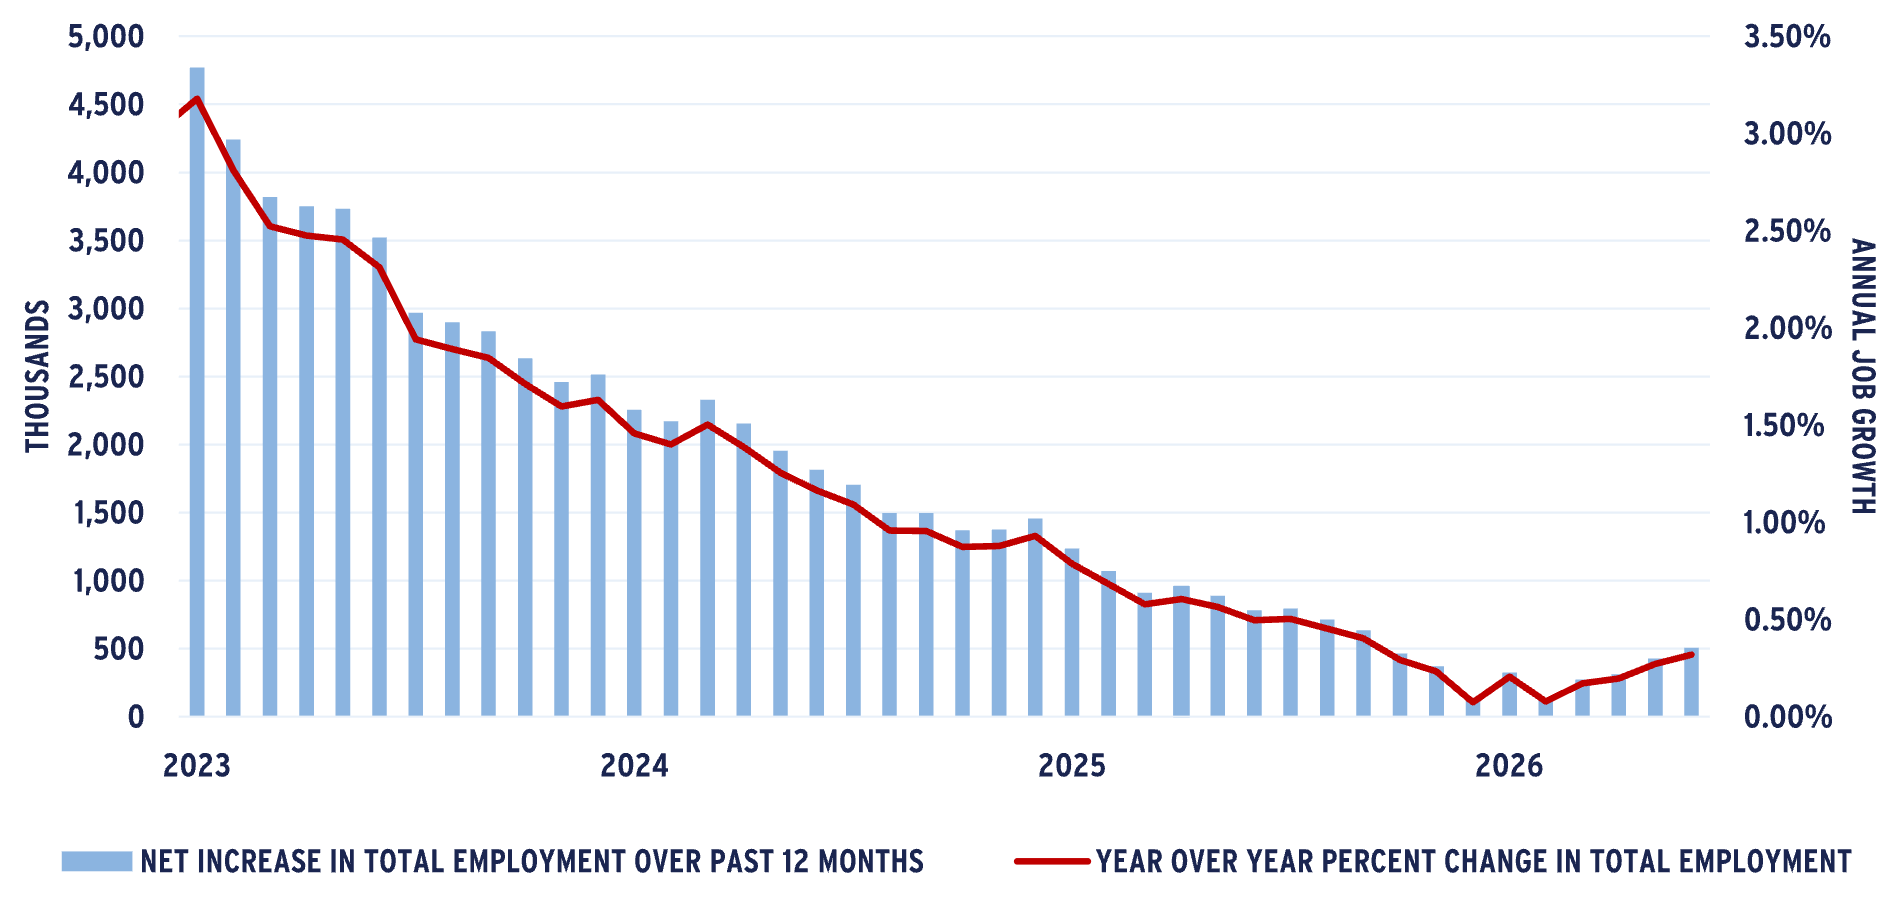
U.S. job growth, which had been slowing for several years, likely bottomed at the end of 2025 with near-zero year-over-year growth and has reaccelerated, albeit moderately, over the first six months of this year.
 

FIGURE 2: U.S. MONTHLY EMPLOYMENT GROWTH
Image
Bar chart showing decrease in U.S. monthly employment growth

Source: Bureau of Labor Statistics (BLS), as of June 2026
 

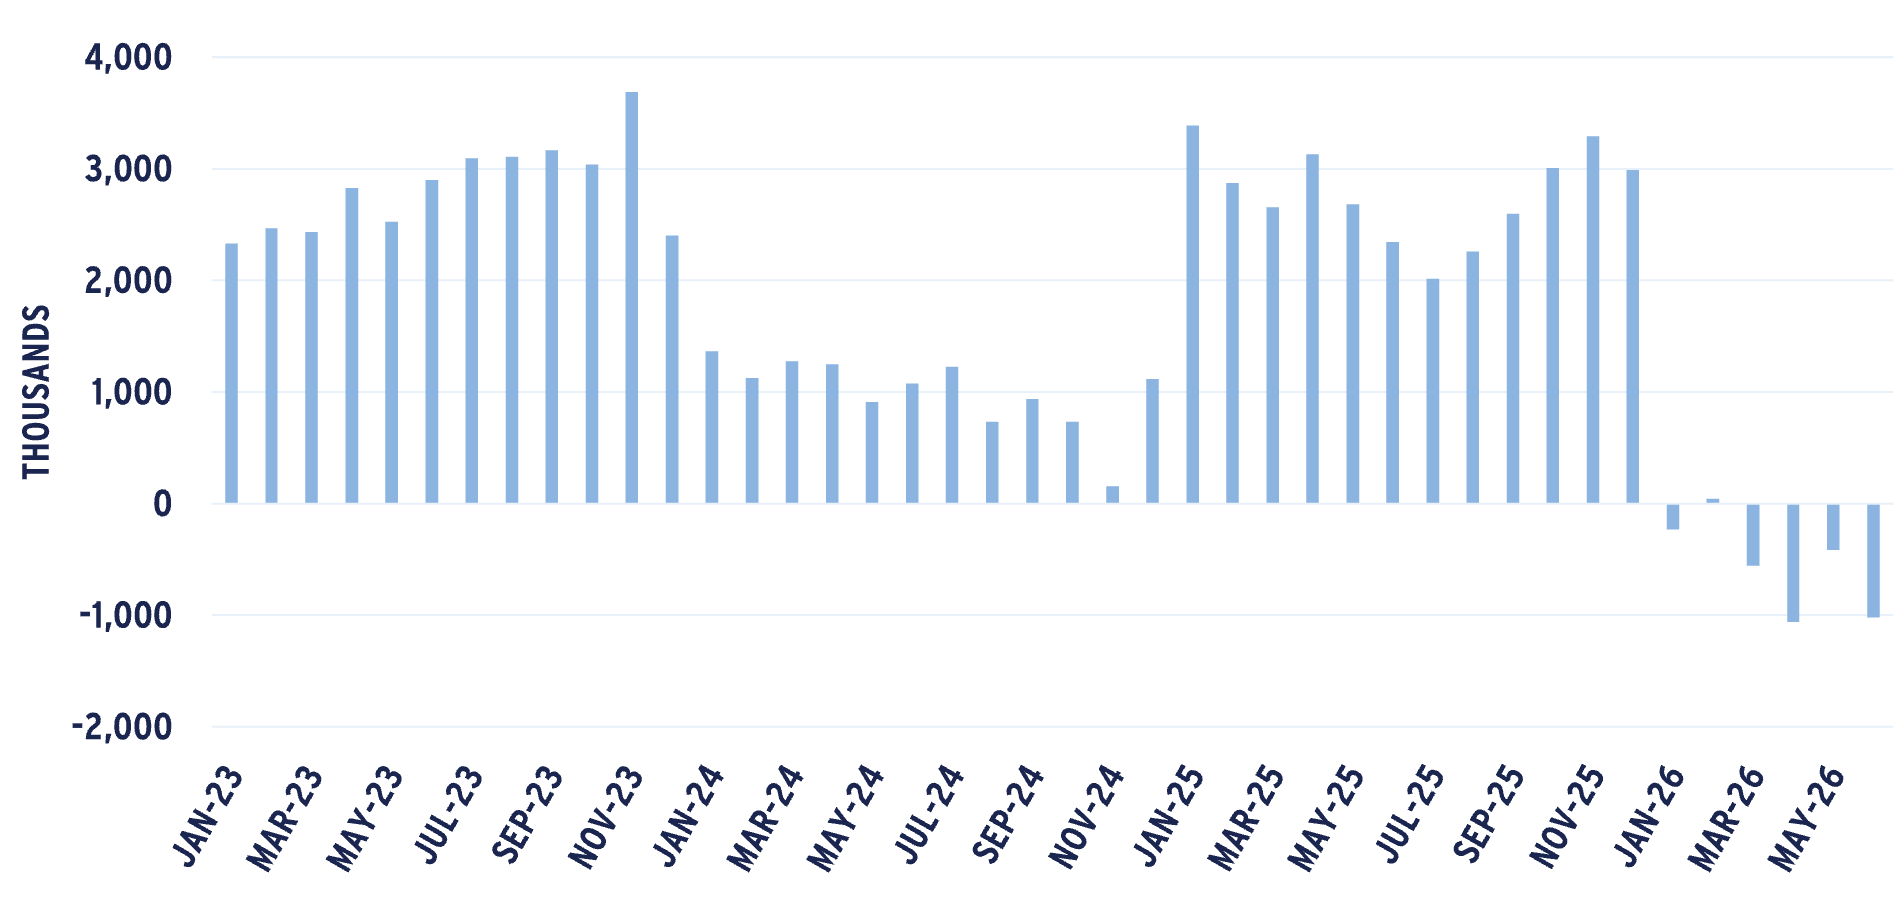
Regardless of employer demand for labor, the greatest constraint on near-term employment growth will likely be labor availability. So far in 2026, the U.S. labor force has recorded negative year-over-year growth in five of the past six months, a phenomenon typically observed only during severe economic events such as the global financial crisis (GFC) or the COVID-19 pandemic.


FIGURE 3: U.S. MONTHLY LABOR FORCE GROWTH (YEAR-OVER-YEAR CHANGE)
Image
Bar chart showing US monthly labor force growth

Source: Bureau of Labor Statistics (BLS)
 

Labor force growth, or contraction, is shaped by two factors: changes in the working-age population, typically defined as ages 15 to 64, and the degree to which working-age people choose to participate in the workforce. Current projections from the Census Bureau show little or no growth in the working-age population over this decade as the tail end of the Baby Boom, people currently age 62 to 80, fully exits the labor force over the next several years while the smaller Gen Alpha cohort, people currently under age 16, enters the working-age group. Recent changes to U.S. immigration policy and enforcement likely increase the downside risk to current working-age population growth projections, particularly with respect to foreign-born workers.

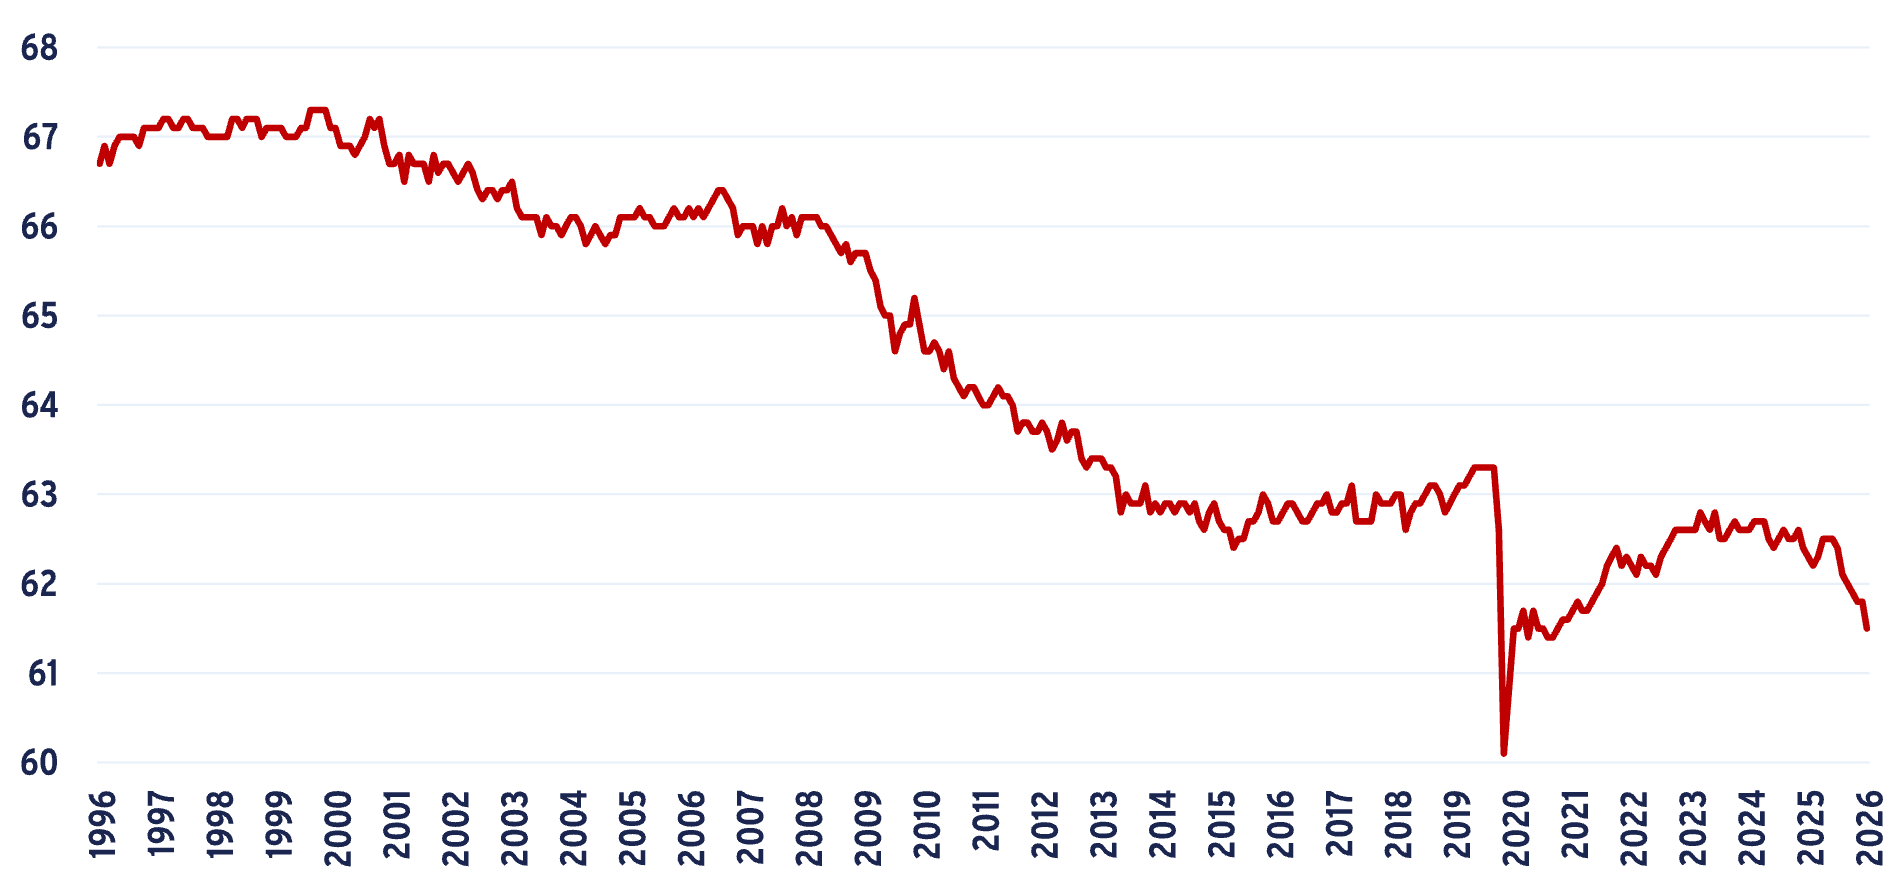
More significantly, U.S. labor force participation rates, while recovered somewhat from the pandemic period, have been falling steadily since the beginning of the century. After reaching a post-pandemic high of 62.8% at the end of 2023, the overall U.S. labor force participation rate declined to 61.5% in June, with the pace of decline accelerating since the beginning of 2025.
 

FIGURE 4: U.S. LABOR FORCE PARTICIPATION RATE
Image
Line graph showing US labor force participation rate decrease over the last 30 years

Source: Bureau of Labor Statistics (BLS), as of June 2026
 

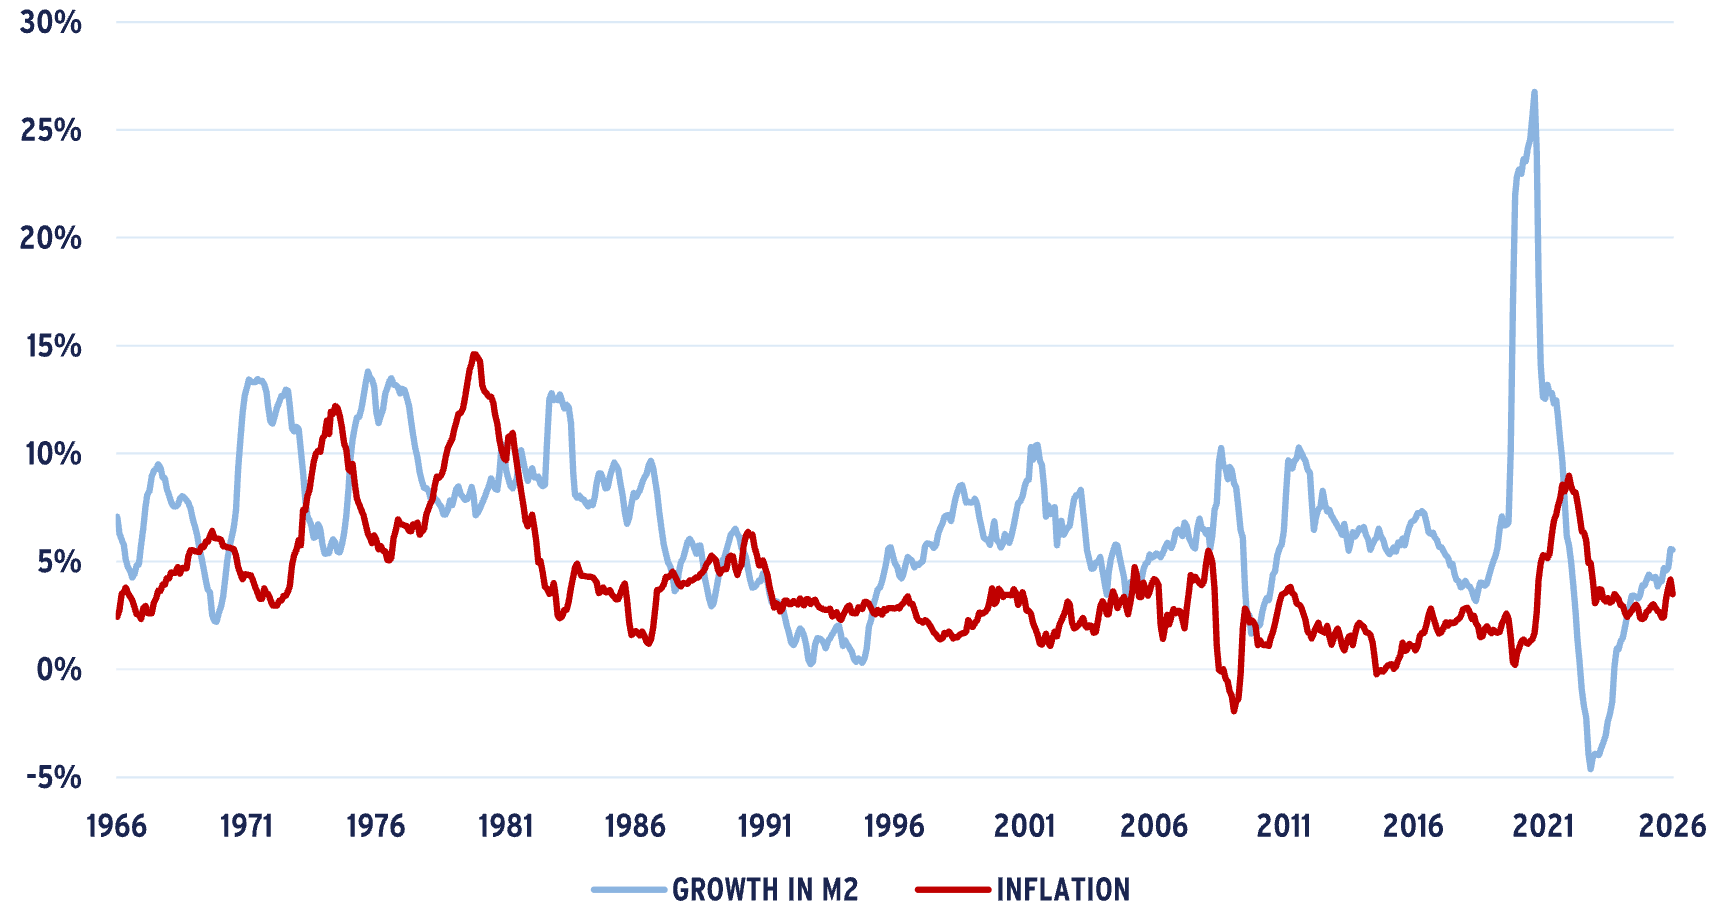
Left unchanged, current labor force trends are likely to contribute negatively to the larger issue of continued higher inflation. U.S. inflation surged during and immediately after the COVID period, in part reflecting a broad timing mismatch between demand and supply across the economy. In response to fears of collapsing final demand, the U.S. government flooded the economy with direct transfer payments to stimulate consumer and business spending, but increased supply, or production, lagged. The more significant inflationary impact during this period, however, came directly from growth in the money supply as the Federal Reserve monetized government borrowing to facilitate these payments. Between the end of 2019 and the end of 2022, the total U.S. money supply increased approximately 40%, roughly twice the increase in nominal GDP over this period.


FIGURE 5: U.S. MONEY SUPPLY GROWTH AND INFLATION
Image
Graph showing US money supply growth and inflation

Sources: Federal Reserve, Bureau of Labor Statistics (BLS), as of June 2026
 

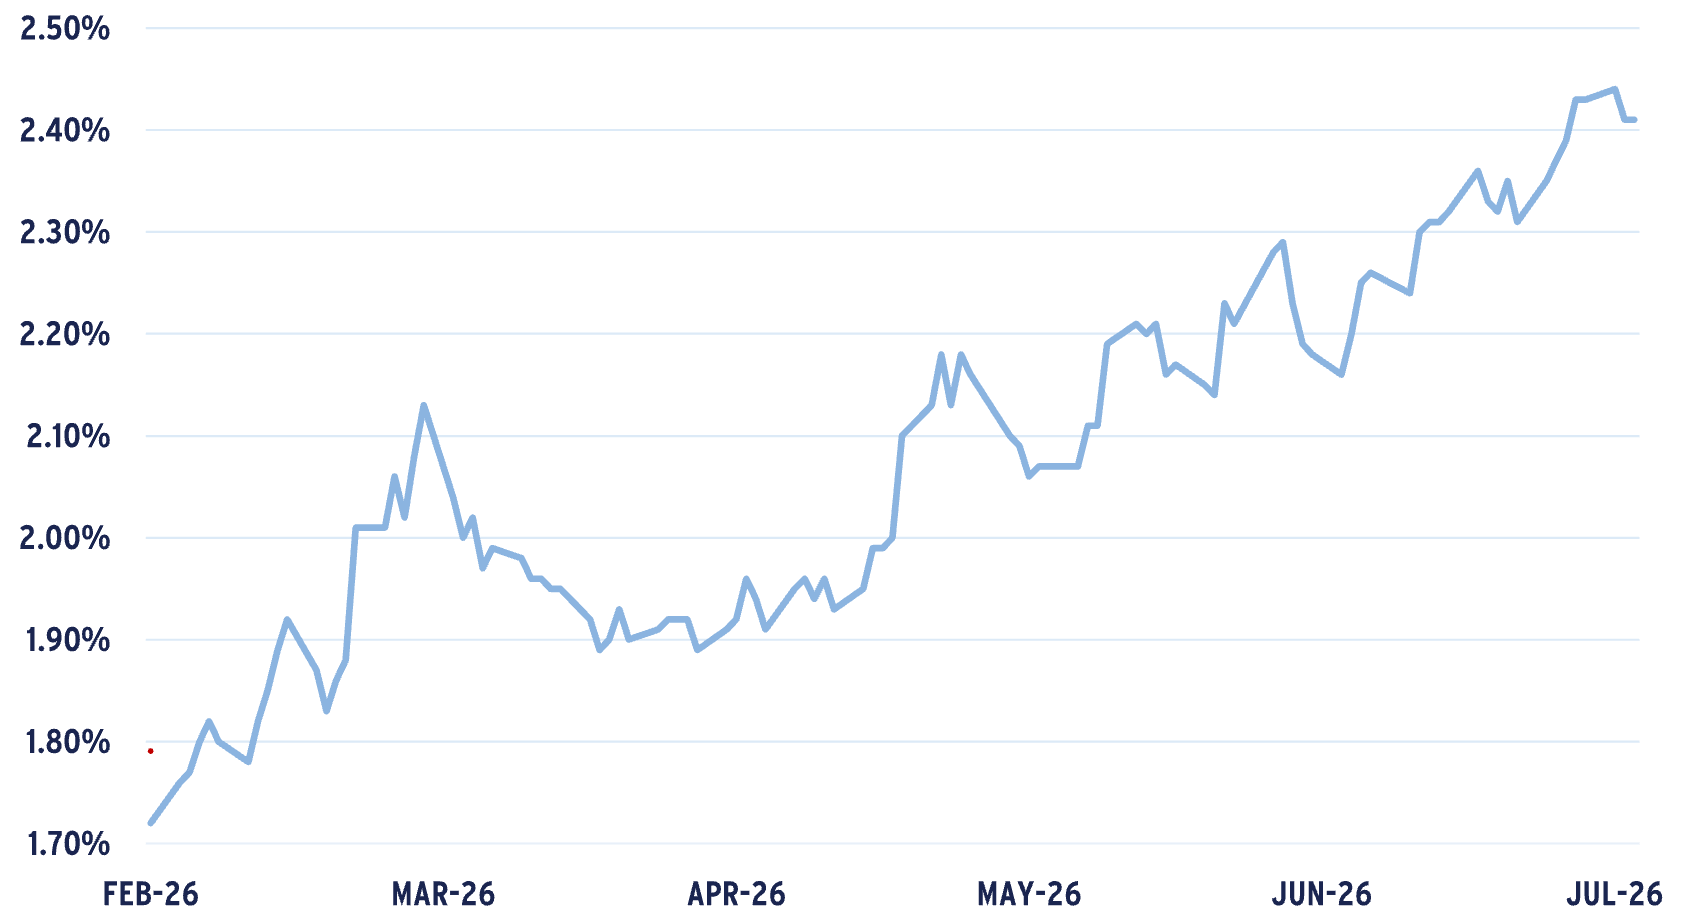
While overall inflation has retreated from post-pandemic highs, it has reaccelerated in recent months in response to energy supply shocks related to the war with Iran. Initially, markets viewed this as a temporary phenomenon, likely to fade as the expected “brief” war concluded. As the war enters its sixth month, markets continue to reassess the temporary nature of the conflict and its impacts on energy prices and broader inflation. To this point, since the day before the war began, February 27, U.S. real yields have moved steadily higher, increasing by roughly 70 basis points and accelerating since mid-May.
 

FIGURE 6: INFLATION-INDEXED 10-YEAR YIELD
Image
Line graph showing increasing inflation-indexed 10-year yield over 2026

Source: Treasury.gov
 

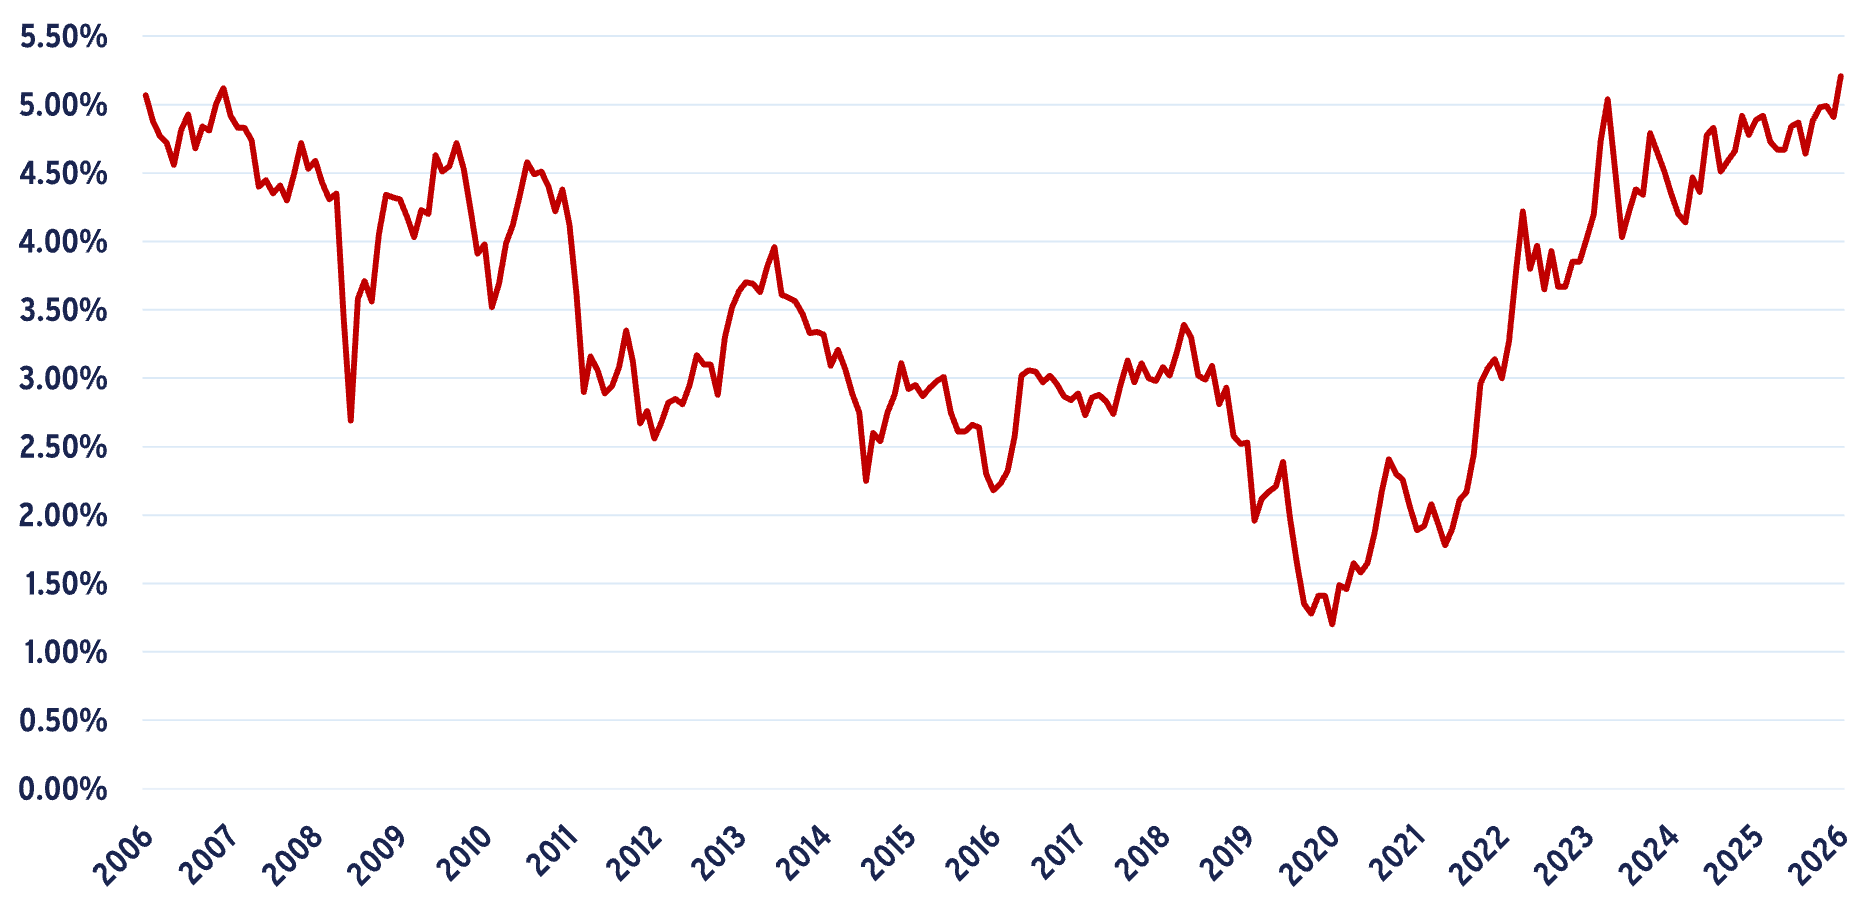
Currently, we do not anticipate a near-term interest rate reduction by the Federal Reserve or any meaningful decline in longer rates. To this point, the yield on the 30-year U.S. Treasury bond finished July at the highest level in twenty years, rising above the high watermark of the post-pandemic inflation spike.  
 

FIGURE 7: 30 YEAR TREASURY BOND YIELD
Image
Graph showing 30 year treasury bond yield

Source: Treasury.gov, as of June 2026


Read More from AEW Capital Management


1 CoStar National Office Report 2026Q1
2 CoStar National Office Report
3 CBRE-EA Total Retail Market History 2Q2026
4 CBRE-EA Total Retail Market Fundamentals History 2Q2026
5 CBRE-EA Total Retail Market Fundamentals History 2Q2026

For more information, please contact:
MICHAEL ACTON, CFA®

Managing Director, Head of Research & Strategy, North America

michael.acton@aew.com

+1.617.261.9577

JAY STRUZZIERY, CFA®
Head of Investor Relations
jay.struzziery@aew.com
+1.617.261.9326

This material is intended for information purposes only and does not constitute investment advice or a recommendation. The information and opinions contained in the material have been compiled or arrived at based upon information obtained from sources believed to be reliable, but we do not guarantee its accuracy, completeness or fairness. Opinions expressed reflect prevailing market conditions and are subject to change. Neither this material, nor any of its contents, may be used for any purpose without the consent and knowledge of AEW. There is no assurance that any prediction, projection or forecast will be realized.

Share this post

Sign Up Now for Full Access to Articles and Podcasts!

Unlock full access to our vast content library by registering as an institutional investor

Register

Contacts


AEW Capital Management

For nearly 45 years, AEW Capital Management, L.P. (AEW) has provided real estate investment management services to investors worldwide. As one of the world’s largest real estate investment advisors¹, AEW and its affiliates manage $85.9 billion in private real estate equity, debt and listed securities across North America, Europe and Asia (as of December 31, 2025). Grounded in research and experienced in the complexities of the real estate and capital markets, AEW actively manages portfolios in both the public and private property markets and across the risk/return spectrum. AEW and its affiliates have offices in Boston, Los Angeles, Denver, London, Paris, Hong Kong, Seoul, Singapore, Sydney and Tokyo, as well as additional offices in eight European cities. For more information, please visit www.aew.com.

¹Source: “2025 IREI.Q Real Estate Managers Guide”. The Guide, published annually by Institutional Real Estate, Inc., ranks real estate managers based on the gross value of real estate AUM ($m) as of December 31, 2024. As of December 31, 2025. AEW includes (i) AEW Capital Management, L.P. and its subsidiaries and (ii) affiliated company AEW Europe and its subsidiaries. AEW Europe and AEW Capital Management, L.P. are commonly owned by Natixis Investment Managers and operate independently from each other. Total AEW AUM of $85.9 billion includes $42.5 billion in assets managed by AEW Europe and its affiliates, $3.5 billion in regulatory assets under management of AEW Capital Management, L.P., and $39.9 billion in assets for which AEW Capital Management, L.P. and its affiliates provide (i) investment management services to a fund or other vehicle that is not primarily investing in securities (e.g., real estate), (ii) non-discretionary investment advisory services (e.g., model portfolios) or (iii) fund management services that do not include providing investment advice.

Chad Nettleship
Insurance, Investor Relations
chad.nettleship@aew.com

617.261.9485


2 Seaport Lane
Boston, MA 02210


View the contributor page

Image
AEW.png

Sign Up Now for Full Access to Articles and Podcasts!

Unlock full access to our vast content library by registering as an institutional investor .

Create an account

Already have an account ? Sign in

Ѐ Ё Ђ Ѓ Є Ѕ І Ї Ј Љ Њ Ћ Ќ Ѝ Ў Џ А Б В Г Д Е Ж З И Й К Л М Н О П Р С ΄ ΅ Ά · Έ Ή Ί Ό Ύ Ώ ΐ Α Β Γ Δ Ε Ζ Η Θ Ι Κ Λ Μ Ν Ξ Ο Π Ρ Ё Ђ Ѓ Є Ѕ І Ї Ј Љ Њ Ћ Ќ Ў Џ А Б В Г Д Е Ж З И Й К Л М Н О П Р С Т У Ф Х Ц Ч Ш Ā ā Ă ă Ą ą Ć ć Ĉ ĉ Ċ ċ Č č Ď ď Đ đ Ē ē Ĕ ĕ Ė fi fl œ æ ß