We're currently experiencing email delivery delays. For urgent matters, please contact us directly at lindsay@insuranceaum.com.

Pioneer Investments -

Agency Mortgage-Backed Securities (MBS) Market - September 2025

VCMFeatured

Tyler Patla Senior Vice President, Deputy Director of Core Fixed Income, Director of Agency Mortgages, Portfolio Manager


Agency MBS Continued Outperformance in September

August’s investor excitement over a dovish shift from the Federal Reserve continued into September, as weakening employment data and modest inflation readings allowed the Fed to execute its first rate cut of the year. Anticipation of further easing drove Treasury yields lower and lifted risk asset prices. Data around economic fundamentals were more mixed. Labor market readings remained soft, but consumer spending was particularly resilient. Real consumption growth for Q2 was revised upward, with July and August data indicating stronger spending momentum. The Fed's updated Summary of Economic Projections revealed higher expected growth and inflation compared to June forecasts, suggesting the Federal Open Market Committee (FOMC) was not easing due to a weakening baseline outlook. Instead, Federal Reserve Chairman Powell justified the move through a risk assessment lens and cited increased downside risks to employment and diminished upside risks to inflation. This nuanced explanation left investors questioning whether the interest rate cut marked the beginning of an aggressive easing cycle or simply a calibrated adjustment to evolving monetary policy risk dynamics. As a result, longer-term yields rose as the Fed cut short-term rates, eliminating the policy transmission to mortgage rates that Washington had been hoping for – a topic we explore in this piece.

Continuing August’s strong run, the agency MBS market outperformed Treasuries and kept pace with other risk assets in September. Despite a flattening yield curve, short-term implied interest rate volatility continued to fall with the first Fed cut of the year, and investors broadly felt both the supply-demand and fundamental outlooks for the sector continued to improve. The Bloomberg US MBS Index gained 1.22% on the month, reflecting a 0.35% excess return to Treasuries. Sector option-adjusted spread (OAS) tightened by 4bp to +31bp. After current coupon led August’s tightening, lower coupons that still make up a preponderance of the agency MBS market performed best in September, tightening by 8bp to 10bp.

How Can the Government Lower Mortgage Rates?

The Trump administration has made it an explicit goal to lower mortgage rates as a means to mitigate what it has labeled a housing affordability crisis. Its main effort towards this goal so far has been by encouraging the Federal Reserve to lower the effective Fed Funds rate. Unfortunately, the primary mortgage rate does not have a particularly strong correlation with Fed Funds, as illustrated in the graph on the right. In fact, mortgage rates have risen 3 of the 4 times the Fed cut rates over the past two years.

Instead, the primary mortgage rate can be broken down into three pieces:

  1. Benchmark rate, often 7-to-10-year US Treasuries, which more closely match the duration and weighted average life of a 30-year amortizing mortgage
  2. Mortgage spreads, which reflect investors’ appetite and assessment of the value of borrowers’ prepayment option, influenced by expected rate volatility and yield curve shape
  3. Primary-secondary spread, reflecting the rate difference between MBS prices and the mortgage rate, encompassing guarantee fees, mortgage servicing rights, and originator profits

Mortgage Rates Track Treasuries, Not Fed Funds
Image
Graph showing that mortgage rates track treasuries

Source: Pioneer Investments, Bloomberg, as of September 30, 2025
 

If trying to induce a lower Fed Funds rate does not impact the mortgage rate, how could the federal government influence it? Here are five potential levers the federal government could pull via the Treasury, Federal Reserve, or the Federal Housing Finance Agency’s (FHFA’s) control over the government sponsored entities (GSEs) Fannie Mae and Freddie Mac, each with its potential benefits and challenges:

Image
Table stating pros and cons of various fed strategies

Among these five, we don’t think any are probable, but think the second—the FHFA instructs Fannie Mae and Freddie Mac to expand their portfolios closer to their asset caps—is most likely to occur. All this said, we believe any combination of these efforts would be unlikely to move the mortgage rate more than 0.25% to 0.50%. That would not make a substantial dent in a housing market whose prices have risen 56% since 2020 and mortgage rates that have risen from 2.75% at the lows to 6.25% currently, implying a 135% increase in monthly mortgage payments in that time. Since the structural housing shortage, which is the largest driver of the decade’s home price increases, is primarly due to state and local zoning and building constraints, the federal government’s impact is likely to be limited. 

Outlook: Improving Technicals and Fundamentals Reflected in Valuations 

In July’s commentary, we highlighted that our outlook for agency MBS was constructive, but dependent on macro factors and monetary policy. As these factors shifted dovishly in August and September, agency MBS performance excelled, both relative to Treasuries and other spread assets. While spreads are now close to the tights of the past couple of years, this move rationally reflects a change in technical and fundamental outlook. While we no longer find spreads compelling on a standalone basis and have been content to take profits on recent outperformance, a constructive outlook for demand and the potential for governmental intervention motivate us to maintain a benchmark weight.
 

Bloomberg US MBS Index Regressions
Image
Graph showing bloomberg US MBS index regressions

Source: Pioneer Investments, Bloomberg, as of September 30 , 2025, 2025
 

The argument against:

  • Nominal spreads are relatively tight:  By some metrics, MBS spreads are around the tightest they have been over the past 3 years. We believe a longer-term perspective, a comparison to alternative spread assets, and the improved technical outlook justify these valuations. However, it would be reasonable for investors to consider selling agency MBS in a risk-off scenario, particularly for investors whose alternative is US Treasuries and for asset managers sitting at historic overweights to the sector.
  • Hearty demand is not guaranteed:  Despite a constructive backdrop, aggregate agency MBS demand could still disappoint. Active allocators could opportunistically reduce, and we are also wary of continued de-dollarization from overseas investors in response to geopolitics, trade wars, threats to central bank independence, and public trust in federally published economic statistics.
  • Potential prepayment regime change in a rally: Recent data have indicated benign prepayment risk, but the situation could change if a weaker economy drives interest rates lower across the curve. While our data analysis assuages some of our fears on this front, consolidation and innovation among several aggressive mortgage originators could yield increased technologically-driven operating efficiencies in the next refi wave. Such a trend could decrease sector performance, but increase the potential value of security selection.

In MBS’s favor:

  • Stronger relative value to investment-grade alternatives: Despite recent outperformance, agency MBS remains historically attractive versus corporate bonds, which are significantly tighter than agency MBS when compared to their respective long-term averages by nearly every metric. As a result, we are more bullish on agency MBS beta as a positive contributor to an aggregate, multi-sector, or multi-asset portfolio than we are versus Treasury or cash benchmarks.
  • A stronger supply-demand dynamic: if the Federal Reserve continues its rate cuts, MBS would become an increasingly attractive asset class for some of its larger investor basis. For domestic banks, the carry on MBS relative to interest on excess reserves (IOER) and other short-term alternatives would expand, along with easing regulatory standards. Meanwhile, the currency hedging costs for overseas investors would decrease.
  • Potential administrative action: as discussed above, the Trump administration seeks to lower mortgage rates. Many potential avenues would involve attempting to tighten the mortgage spreads relative to Treasuries, most notably by instructing Fannie Mae and Freddie Mac to expand their portfolios. We do not advocate owning the sector in anticipation of an uneconomic actor moving the market, but it is a risk worth considering for the asset class’s potential outcome distribution.
     
Despite Recent Tightening, Agency MBS Spreads Still Historically Wide to Investment Grade Corporates
Image
Graph comparing MBS Nominal spreads against IG Corporate OAS


Overall, while we continue to find agency MBS to be an attractive alternative to credit, we feel a neutral allocation to most benchmarks is prudent at this time. A more supportive technical dynamic has already moved MBS tighter, but the sector could struggle to find support in a reflation-induced, bear flattening curve environment. In the interim, our strongest conviction is in specified pools with characteristics we find underappreciated by the market, particularly for higher coupons with the most model risk premium, as well as in floating-rate collateralized mortgage obligations. For now, we prefer to to retain the flexiblity to reduce on short-term outperformance and are willing to add more if spreads widen due to technical factors or exogenous event risk.

Image
A series of graphs showing Spread Levels vs. 5 Year Averages, Prepayment Factors, Index Data

Source: Bloomberg, as of September 30, 2025 2Index Data: Bloomberg US MBS Index, Bloomberg GNMA Index, Bloomberg US Aggregate Corporate Average OAS, Bloomberg US Investment Grade ABS Index, Bloomberg US Investment Grade CMBS Index.
3S&P/Experian First Mortgage Default Index, MBA Refinance Index.
4The characteristics are of the representative account (gross, USD) in the US Agency MBS composite. Gross-of-fees returns are presented before management and custodial fees but after any transaction costs.
 

Pioneer US Agency MBS Strategy Performance (as ofSeptember 30, 2025)
Image
Bar chart showing Pioneer US Agency MBS Strategy Performance

Source: Pioneer Investments, as of September 30, 2025
Performance prior to April 1, 2025 occurred while the portfolio management team was affiliated with a prior firm. Such members of the portfolio management team were responsible for investment decisions at the prior firm and the decision-making process has remained intact. Gross-of-fees returns are presented before management and custodial fees but after any transaction costs. The composite net-of-fees returns reflect net of model fees and are calculated in the same manner as gross of fee returns using the Time Weighted Rate of Return method. Actual fees may vary depending on, among other things, the applicable fee schedule and portfolio size.
Please refer to the GIPS® Report for additional information. Past performance is no guarantee of future results.


Read More From Pioneer Investments


The views expressed in this presentation are those of Pioneer Investments, a Victory Capital Investment Franchise, and are subject to change at any time. These views should not be relied upon as investment advice, as securities recommendations, or as an indication of trading intent on behalf of any strategy. Future results may differ significantly than those stated.
The services and any securities described in this document may not be registered for sale with the relevant authority in your jurisdiction and may not be regulated or supervised by any governmental or similar authority in your jurisdiction. Where unregistered, they may not be sold or offered except in the circumstances permitted by law. Pioneer Investments is not making any representation nor does this document constitute a representation with respect to (i) the eligibility of any recipients of this document to acquire any securities or any services described herein in any jurisdiction or (ii) the eligibility of any recipients of this document to receive this document in any jurisdiction. If you are in doubt about the content of this document or your eligibility, you should obtain independent professional advice.
Each portfolio is actively managed. Sector allocations will vary over other periods and do not reflect a commitment to an investment policy or sector. Holdings are subject to change due to active management. This should not be construed as a recommendation to buy or sell the securities listed.
Performance shown is past performance, which is no guarantee of future results. Current performance may be lower or higher than the performance data quoted.
This document and any subsequent information (whether written or verbal) provided by Pioneer Investments are private and confidential and are for the sole use of the recipient. Such documentation and information is not to be distributed to the public or to other third parties and the use of the documentation and/or information provided by anyone other than the recipient is not authorized. The recipient will notify Pioneer Investments immediately upon the discovery of any unauthorized use or redistribution of the materials contained in this submission or information subsequently provided in connection with this submission.
Advisory Services offered by Victory Capital Management Inc.
©2025 Victory Capital Management Inc.
20251009 -4891809

Image
Composite report

Share this post

Sign Up Now for Full Access to Articles and Podcasts!

Unlock full access to our vast content library by registering as an institutional investor

Register

Contacts


Pioneer Investments

Pioneer Investments manages $128 billion in assets and has a long-standing history of innovation with deep expertise managing fixed income portfolios and creating customized solutions within the more opportunistic areas of the securitized market.

Pioneer Investments’ culture of innovation, in the securitized market, originated at Smith Breeden, where its founders developed early option-adjusted spread modeling techniques for MBS valuation. The innovative approach continues under Victory Capital, which manages over $8.4 billion for insurance companies. We are focused on delivering competitive risk-adjusted returns, while considering the accounting, regulatory, and capital management needs of our insurance clients to create long-term partnerships.  We understand the unique needs of insurers, and we provide customized and efficient risk-based capital solutions that align with insurers' risk tolerances and investment objectives.

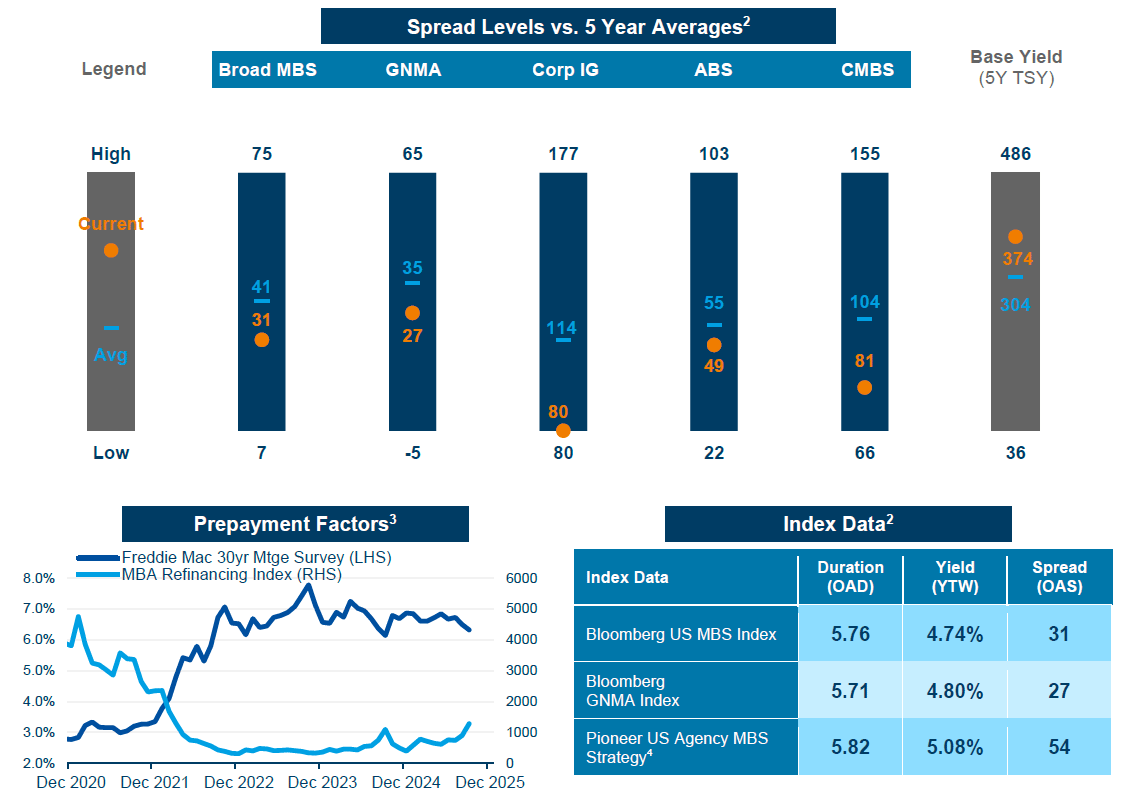
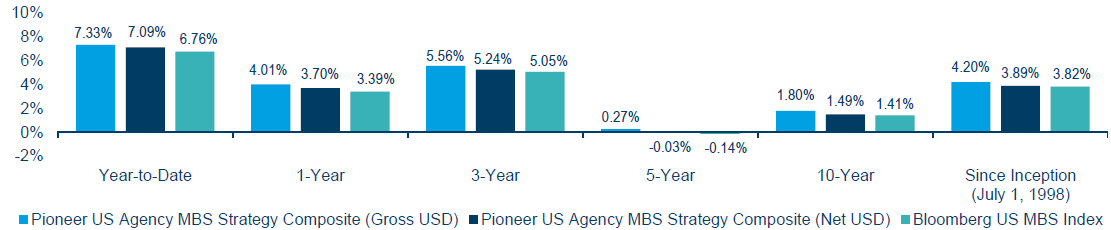
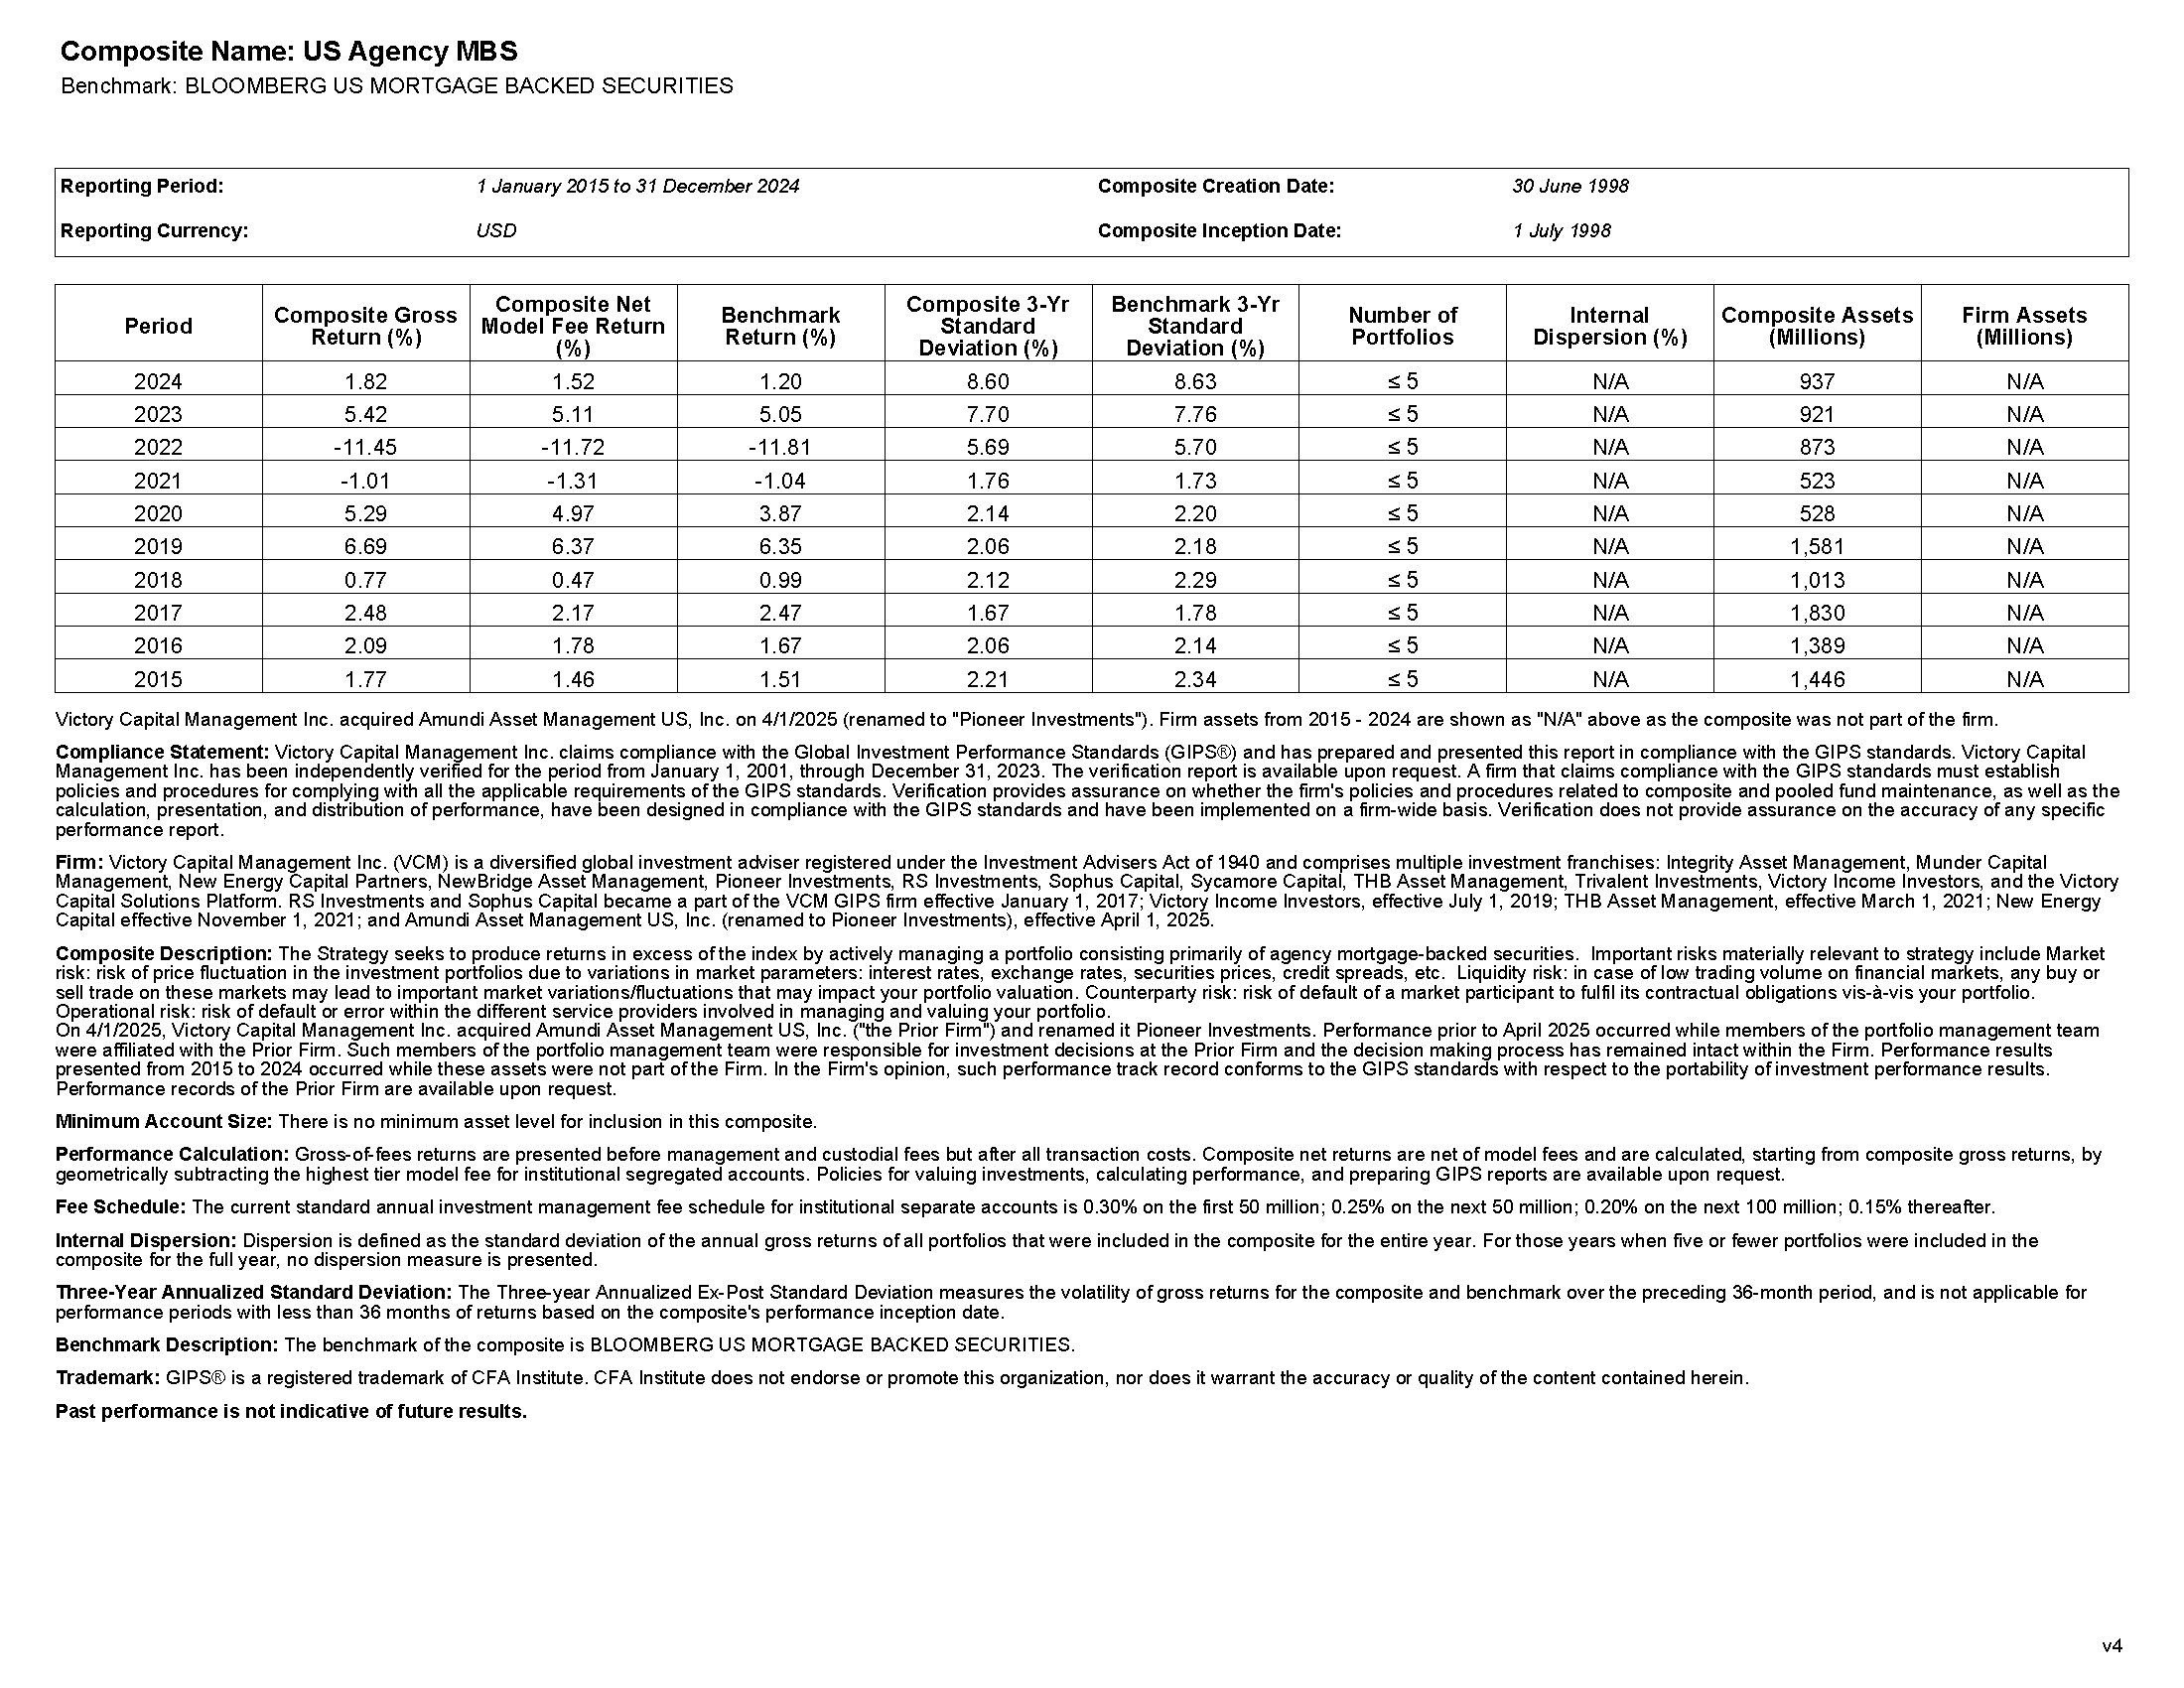
Source: Pioneer Investments, a Victory Capital Investment Franchise, as of September 30, 2025
 

Jay Alexander, CFA, CAIA
Managing Director, Institutional Markets
jalexander@vcm.com
+1 (612) 965-5426
 
Emma White
Director, Institutional Markets
ewhite@vcm.com
+1 (617) 422-4569

Marko Komarynsky
Director, Institutional Markets
mkomarynsky@vcm.com
+1 (210) 697-3613

View the contributor page

Sign Up Now for Full Access to Articles and Podcasts!

Unlock full access to our vast content library by registering as an institutional investor .

Create an account

Already have an account ? Sign in

Ѐ Ё Ђ Ѓ Є Ѕ І Ї Ј Љ Њ Ћ Ќ Ѝ Ў Џ А Б В Г Д Е Ж З И Й К Л М Н О П Р С ΄ ΅ Ά · Έ Ή Ί Ό Ύ Ώ ΐ Α Β Γ Δ Ε Ζ Η Θ Ι Κ Λ Μ Ν Ξ Ο Π Ρ Ё Ђ Ѓ Є Ѕ І Ї Ј Љ Њ Ћ Ќ Ў Џ А Б В Г Д Е Ж З И Й К Л М Н О П Р С Т У Ф Х Ц Ч Ш Ā ā Ă ă Ą ą Ć ć Ĉ ĉ Ċ ċ Č č Ď ď Đ đ Ē ē Ĕ ĕ Ė fi fl œ æ ß