Key Takeaways
- We believe the Fed’s balance sheet normalization process carries underappreciated risks.
- The assumption of a benign balance sheet runoff is dependent on a single historical example in 2017-2019.
- A recession could take place before the balance sheet runoff is adequately completed or sufficient rate hikes have been made.
- We expect elevated market volatility as the balance-sheet normalization process remains a poorly understood tool.
Introduction
The Fed’s discussions of balance sheet normalization have stirred up markets and become front and center in monetary policy debates. The Fed appears to be convincing markets that balance sheet normalization will be a benign event, but we worry about market complacency on this front.
We view the balance-sheet unwinding as a potentially risky, yet necessary, process. We believe the Fed would like to reduce its balance sheet in order to be well-positioned for the next recession. We worry there is a chance that either the Fed falls short of its monetary tightening goals or it achieves its monetary tightening goals while stifling economic growth. The balance sheet normalization process is likely less well-understood than the markets currently believe it to be. We also believe that the market expectations of an aggressive hiking cycle may underestimate balance sheet normalization effects.
Balance Sheet Normalization by any Other Name
The Fed has its own balance sheet listing its assets (e.g., government securities and the credit it lends to member banks and other financial institutions) and liabilities (e.g., currency in circulation and bank reserves held at commercial banks). The Fed’s balance sheet reflects the scope and scale of Fed market operations, which can directly impact the economy and financial markets.
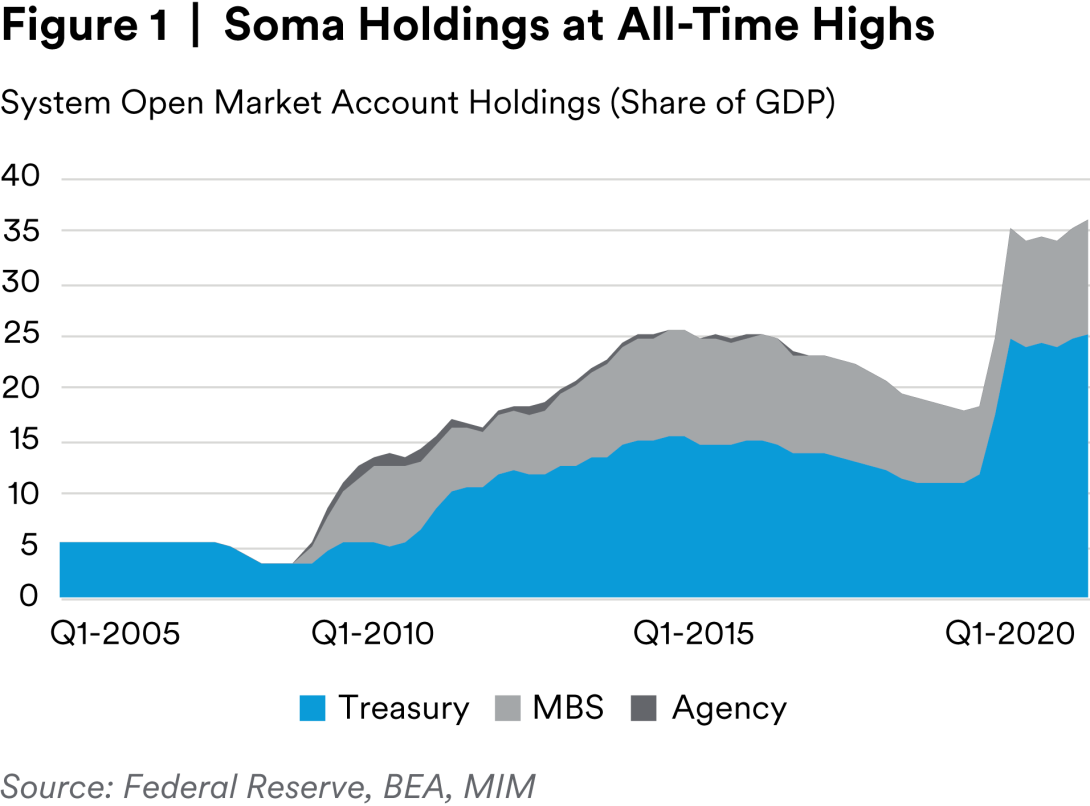
The size of the Fed’s balance sheet is just under $9 trillion, or roughly 36% of Gross Domestic Product (GDP), comprised primarily of securities held within the System Open Market Account (SOMA). These assets form the collateral supporting the liabilities of the Federal Reserve System, namely currency (dollars) and bank reserves. There are strict legal limits regarding which assets the Federal Reserve can and cannot hold on their balance sheet and, as a result, the primary holdings have traditionally been U.S. Treasury securities—from Treasury Bills to 30-year Bonds.
As the economy recovers from the Covid-19 pandemic, the Federal Reserve has started to share their views on deflating their balance sheet, which was inflated massively to stabilize the market and economy during the pandemic. This balance sheet normalization— or balance sheet runoff, unwinding or quantitative tightening (QT)— can be done passively, through decreasing reinvestment of U.S. Treasury securities and mortgage-backed securities. Alternatively, it can be done actively, including sales of asset holdings, where the Federal Reserve’s Desk sells the securities they own to primary dealers. We do not expect the latter to happen in the upcoming normalization process.
It took the Federal Reserve four years to start the balance sheet reduction in 2017, from the first tapering in 2013. In June 2017, the FOMC announced that balance sheet normalization would start soon. In October 2017, the runoff process began, starting at $10B per month ($6B Treasuries, $4B MBS) and gradually increasing to $50B per month. In March 2019, the FOMC slowed the pace of normalization and in October 2019 the Fed resumed Treasury purchases to grow the balance sheet again, marking the end of balance sheet normalization.
The Fed’s Likely Actions
Total SOMA holdings stand at around 36% of GDP, ten percentage points higher than the prior peak. As a result, the pace of QT this time is generally expected to be faster than in the prior round.1 The U.S. economy and financial system are more robust in this recovery than in the one after the Global Financial Crisis (GFC), and the amount of accommodation that needs to be removed is likely much higher.
There is lack of consensus on how much balance sheet runoff the Fed wants to allow. Estimates range from $1.6 trillion to $2.7 trillion. The main uncertainty is that the traditional rule of thumb of balance sheet to GDP holdings appears to be non-stationary. Historically (up until 2008), the balance sheet had roughly been 6% of GDP, an amount which was sufficient for the economy to function without bank funding issues on most days. During the Great Financial Crisis, the balance sheet peaked at 25% of GDP before the Fed began to allow their balance sheet to roll off. These roll offs continued until the balance sheet reached just under 18% of GDP. The higher level was thought to be needed due to regulatory and other changes in the economy that dictated more cash was required for the proper functioning of the economy.
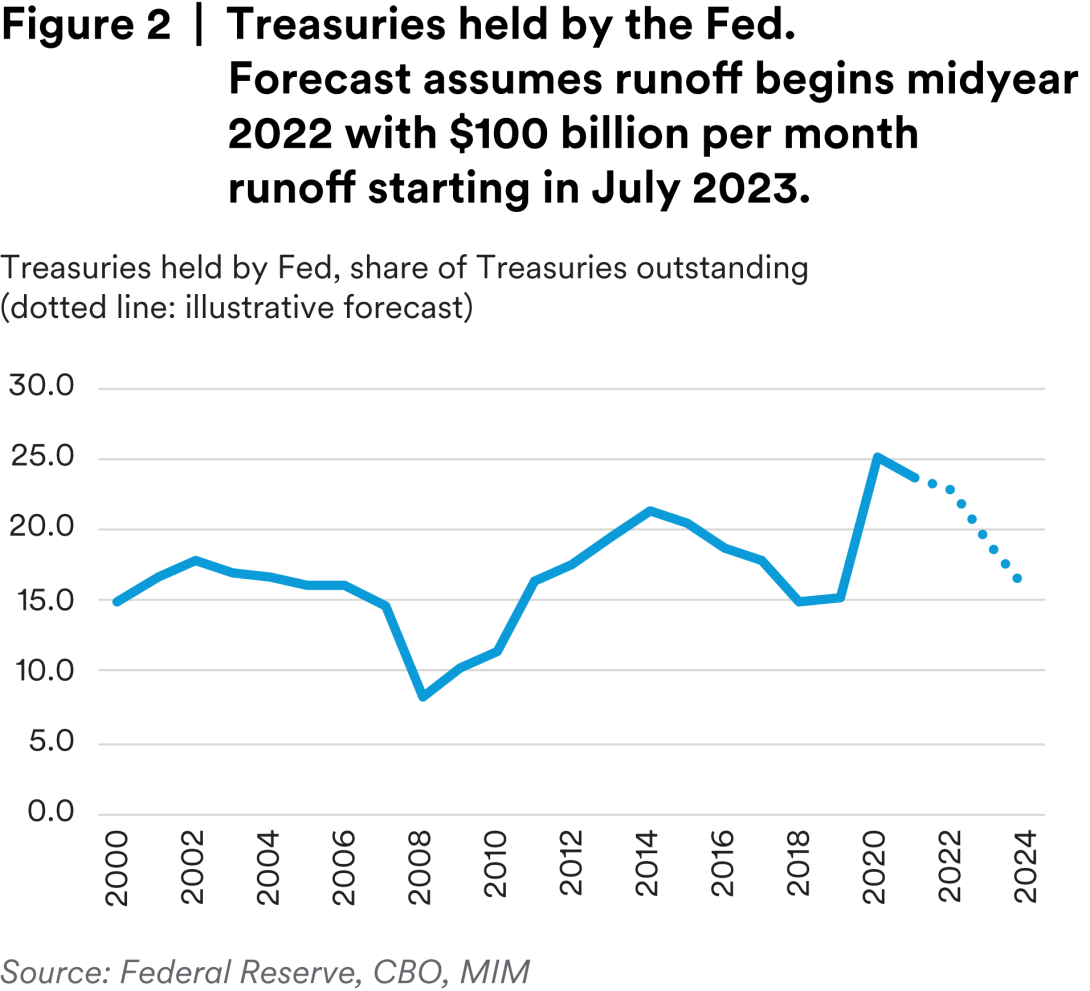
The Fed holdings of Treasuries as a share of total Treasuries outstanding have been somewhat more stationary and may prove to be a useful rule of thumb. Post-GFC this ratio returned to its pre-crisis ratio of 15%, so we view this as a possibly relevant metric for determining the Treasuries’ runoff endpoint. According to this metric, we would see approximately $1.8 trillion in Treasuries runoff.
Such a metric would be silent on MBS runoff since it references Fed’s participation in the Treasuries market only, but MBS runoff has generally been approximately two-thirds of the Treasuries runoff.
According to the principles on balance sheet reduction published on January 26 at the conclusion of the January FOMC meeting, the FOMC sees the Fed Funds rate as its main policy tool, while the balance sheet is meant to play a subordinate role. The FOMC appears ready to move on rates in the March meeting and begin permitting the balance sheet runoff some time thereafter. Given Chair Powell’s discussion of the matter, we expect that the start to the runoff would begin around mid-year, but we would not rule out an earlier start. Most market observers are expecting the runoff to begin before the end of this year.1
As of the last Summary of Economic Projections update in December, the Fed itself expects three hikes in 2022, with more to come in 2023. However, recent commentary from Fed officials suggest they are considering more hikes this year and markets do expect an even more rapid pace of rate hikes, with at least 150 bps worth of hikes priced in by year-end 2022. We worry that this rate hike assumption is overdone and takes an overly benign view of the balance sheet runoff.
Some have attempted to quantify the effect of runoff on long run Treasury yields. Researchers at the Kansas City Fed have estimated an approximately 1 bp increase on the term premium for every $27 billion in balance sheet reduction, with other researchers finding similar results.2
Given an ultimate runoff of approximately $1.8 trillion, this rule of thumb number would yield upward pressure on 10-year rates of about 70 bps. An additional bump of approximately that amount from the 10 year’s lows prior to the December FOMC meeting’s surprising turn seems like a reasonable expectation. However, this cannot be taken as anything more than illustrative of a possible balance sheet normalization outcome given the high degree of uncertainty about balance sheet normalization effects.
FOMC Expectations
The FOMC appears to be hoping for several things from their policy stance. First, they appear convinced that they must act to combat inflation. Although they remain assured that long run inflation expectations remain well-anchored, they have acknowledged that inflation has run too high for too long and requires monetary policy intervention.3
Second, they appear quite motivated to return to policy normalization rapidly, both in terms of the balance sheet and a federal funds rate that is high enough to combat the next downturn. To achieve normalization, they may be hoping to normalize the balance sheet with minimal disruption to financial markets and the economy more generally, hence Chair Powell’s expressed desire for it to run “in the background.” This despite the fact that the balance sheet runoff is generally expected to be substantially faster than the one done in 2017-2019.
The Fed is also likely motivated to raise rates as much as it can without hurting the economy, in order to get back to a more historically normal interest rate environment. Historically, the FOMC has needed at least 550 bps worth of fed funds cuts in order to counter recession effects.4 We expect that the Fed would most likely need to implement both fed funds cuts and QE in the next recession.
There is a very thin literature on quantitative tightening/ balance sheet normalization and is largely based on the single, post-GFC set of events.5 A few key findings appear relevant:
Yield curve inversion may be mitigated by pulling the timing of balance sheet normalization forward relative to a fed funds tightening. In other words, the sequencing of monetary policy matters. Yield curve inversion is a risk for financial institutions and avoiding one could provide a healthier recovery. This research may be behind the Fed’s determination to begin balance sheet runoff earlier in the tightening cycle.
Signaling effects are likely weaker in QT than QE. Quantitative easing is viewed by the markets as a strong signal of a long period of low fed funds rates; as such, QE announcements tend to reduce long term rates. Quantitative tightening lacks the signaling ability since naturally fed funds hikes are on the table in such an environment.
Duration effects may be weaker under QT. These have been an important driver of rate declines during QE; the Fed purchased primarily long duration assets so the remaining securities available in the market therefore had a somewhat shorter duration and have been observed to drive down yields across multiple markets, with portfolio rebalancing effects a channel through which QE operated. Reversing the process may not have the same effects, as markets are likely functioning more smoothly during recovery than during QE, and QT effects may be restricted to Treasuries and MBS.
Generally, it appears that quantitative tightening does not simply have the opposite effects of quantitative easing. There are a few other notable asymmetries. The balance sheet runoff is expected to be relatively gradual, whereas during quantitative easing the Fed injected a lot of money very quickly into the economy. Moreover, when the global economy was hit by the pandemic, all economies’ monetary policy eased at the same time. However, every economy has had a different recovery speed, so when the Fed begins monetary tightening, other economies are likely to still be conducting QE.
Risks on the way out
Quantitative tightening, even more than quantitative easing, is a very new tool for central banks. While the Fed is proceeding with the best understanding available, a number of things could still go wrong.
Yield curve inversion could still happen. Although the Fed may be moving the timing of balance sheet runoff up partly in order to manage yield curve inversion, forces aside from the Fed’s actions could still put pressure on the yield curve. First, the Fed does expect to raise the fed funds rate soon. Short-term yields would likely rise as the fed funds rate rises. The discussion of balance sheet normalization has not brought about very large increases in longer term rates. Longer term rates would likely need to respond more forcefully to Fed normalization announcements to escape a flattening of the yield curve.
Second, the yield curve provides a barometer of expectations; if a recession is imminent, the Fed’s intervention would likely not prevent a yield curve inversion.
More generally, recession risks lead to yield curve inversion; fighting against yield curve inversion does not reduce recession risk. Obviously yield curve inversion risks to financial institutions and related financial stability are a separate point that bears watching.
Finally, Treasury issuance is expected to decline because we don’t expect any major fiscal stimulus bills to pass. While we still expect some form of the Build Back Better Bill to pass, it would be a more phased-in bill than the emergency measures passed in the height of the pandemic crisis. The smaller supply would be expected to push up prices for Treasuries, depressing rates, yet another reason for a potential yield curve flattening.
The balance sheet normalization could work “too well”. The normalization could have stronger effects than most market participants are currently expecting. That would mean fewer rate hikes this time around. Although the Fed does not appear as worried as in the last round,6 the fed funds rate may not be raised sufficiently away from the zero lower bound in this business cycle to eliminate the possibility of quantitative easing in the next recession. If the recovery weakens, and the balance sheet normalization proves to be more powerful than most observers are currently forecasting, then it’s possible that the Fed would only be able to minimally raise rates in this cycle. This would set it up for another round of quantitative easing during the next recession since there would be little room for rate cuts.
Increased volatility. As the Fed removes itself from being the overwhelming force in the Treasury market, the market will likely become more volatile as other participants (a) are not all buy-and-hold investors like the Fed and will therefore trade more and provide more day-to-day price variation, and (b) are likely more skittish and responsive to changes in perceived risk. This is likely to add market risk; the Fed does tend to respond to heightened market risk, even when it prefers not to. Each of these situations could lead to the FOMC reducing its expected monetary tightening path.Although markets are expecting approximately 150 bps worth of hikes, there could be risk to the downside if the robust economic recovery is threatened.
Persistent inflation. We expect inflation to ease in the second half of the year. However, there is something of a mismatch between the Fed’s tools and the causes of inflation. Monetary policy generally applies the brakes to inflation by raising the cost of spending via higher borrowing rates. Although tighter monetary conditions are expected to reduce demand, the supply side problems of this particular bout of inflation are not fully addressed by higher rates. Moreover, the spending coming from saved stimulus funds may also not be fully halted by higher rates.
Conclusion
The Fed may succeed in persuading markets that balance sheet normalization is a non-event, without substantial macroeconomic or market effects. This may be reflecting a favorable view of the strength of the ongoing recovery, or the impression—surmised from the post-financial crisis period—that balance sheet normalization is a relatively benign process.
We are not so sanguine. We are worried that (1) the recovery will be more difficult and less robust than most observers expect, (2) the benign assumption of the balance sheet runoff is highly dependent on only one historical example, and (3) a recession could take place before the balance sheet runoff is adequately completed or sufficient rate hikes have been made.
Endnotes
1 For example, UBS expects balance sheet runoff to begin in Q2 2022 for a total of $2 trillion, Deutsche Bank expects it to begin in July for a total of $1.6 trillion, Goldman Sachs in June for a total of $2.2-2.7 trillion.
2 Troy Davig and A. Lee Smith, “Forecasting the Stance of Monetary Policy under Balance Sheet Adjustments,” Federal Reserve Bank of Kansas City, May 10, 2017. Goldman Sachs (“Early Thoughts on Fed Balance Sheet Runoff,” December 14, 2021) estimates a number somewhat of an outlier to the downside, extrapolating effects from QE studies that it takes $57 billion in balance sheet reduction to lead to a 1 bp increase in yields.
3 FOMC Minutes January 25-26, 2022.
4 This excludes the GFC onset period, where the Fed Funds rate could be reduced by “only” 500 bps until it reached the zero lower bound.
5 A. Lee Smith and Victor J. Valcarcel, “The Financial Market Effects of Unwinding the Federal Reserve’s Balance Sheets,” KC Fed Research Working Papers, January 2022; Karlye Dilts Stedman and Chaitri Gulati, “When Normalizing Monetary Policy, the Order of Operations Matters,” KC Fed Economics Bulletin, October 14, 2021.
6 FOMC Meeting Minutes September 2015.
Read More
Disclaimer
This material is intended solely for Institutional Investors, Qualified Investors and Professional Investors. This analysis is not intended for distribution with Retail Investors. This document has been prepared by MetLife Investment Management (“MIM”)1 solely for informational purposes and does not constitute a recommendation regarding any investments or the provision of any investment advice, or constitute or form part of any advertisement of, offer for sale or subscription of, solicitation or invitation of any offer or recommendation to purchase or subscribe for any securities or investment advisory services. The views expressed herein are solely those of MIM and do not necessarily reflect, nor are they necessarily consistent with, the views held by, or the forecasts utilized by, the entities within the MetLife enterprise that provide insurance products, annuities and employee benefit programs. The information and opinions presented or contained in this document are provided as of the date it was written. It should be understood that subsequent developments may materially affect the information contained in this document, which none of MIM, its affiliates, advisors or representatives are under an obligation to update, revise or affirm. It is not MIM’s intention to provide, and you may not rely on this document as providing, a recommendation with respect to any particular investment strategy or investment. Affiliates of MIM may perform services for, solicit business from, hold long or short positions in, or otherwise be interested in the investments (including derivatives) of any company mentioned herein. This document may contain forward-looking statements, as well as predictions, projections and forecasts of the economy or economic trends of the markets, which are not necessarily indicative of the future. Any or all forward-looking statements, as well as those included in any other material discussed at the presentation, may turn out to be wrong. All investments involve risks including the potential for loss of principle and past performance does not guarantee similar future results. Property is a specialist sector that may be less liquid and produce more volatile performance than an investment in other investment sectors. The value of capital and income will fluctuate as property values and rental income rise and fall. The valuation of property is generally a matter of the valuers’ opinion rather than fact. The amount raised when a property is sold may be less than the valuation. Furthermore, certain investments in mortgages, real estate or non-publicly traded securities and private debt instruments have a limited number of potential purchasers and sellers. This factor may have the effect of limiting the availability of these investments for purchase and may also limit the ability to sell such investments at their fair market value in response to changes in the economy or the financial markets. In the U.S. this document is communicated by MetLife Investment Management, LLC (MIM, LLC), a U.S. Securities Exchange Commission registered investment adviser. MIM, LLC is a subsidiary of MetLife, Inc. and part of MetLife Investment Management. Registration with the SEC does not imply a certain level of skill or that the SEC has endorsed the investment advisor. This document is being distributed by MetLife Investment Management Limited (“MIML”), authorised and regulated by the UK Financial Conduct Authority (FCA reference number 623761), registered address 1 Angel Lane, 8th Floor, London, EC4R 3AB, United Kingdom. This document is approved by MIML as a financial promotion for distribution in the UK. This document is only intended for, and may only be distributed to, investors in the UK and EEA who qualify as a “professional client” as defined under the Markets in Financial Instruments Directive (2014/65/EU), as implemented in the relevant EEA jurisdiction, and the retained EU law version of the same in the UK.
For investors in the Middle East: This document is directed at and intended for institutional investors (as such term is defined in the various jurisdictions) only. The recipient of this document acknowledges that (1) no regulator or governmental authority in the Gulf Cooperation Council (“GCC”) or the Middle East has reviewed or approved this document or the substance contained within it, (2) this document is not for general circulation in the GCC or the Middle East and is provided on a confidential basis to the addressee only, (3) MetLife Investment Management is not licensed or regulated by any regulatory or governmental authority in the Middle East or the GCC, and (4) this document does not constitute or form part of any investment advice or solicitation of investment products in the GCC or Middle East or in any jurisdiction in which the provision of investment advice or any solicitation would be unlawful under the securities laws of such jurisdiction (and this document is therefore not construed as such).
For investors in Japan: This document is being distributed by MetLife Asset Management Corp. (Japan) (“MAM”), 1-3 Kioicho, Chiyoda-ku, Tokyo 102-0094, Tokyo Garden Terrace KioiCho Kioi Tower 25F, a registered Financial Instruments Business Operator (“FIBO”) under the registration entry Director General of the Kanto Local Finance Bureau (FIBO) No. 2414.
For Investors in Hong Kong S.A.R.: This document is being issued by MetLife Investments Asia Limited (“MIAL”), a part of MIM, and it has not been reviewed by the Securities and Futures Commission of Hong Kong (“SFC”). MIAL is licensed by the Securities and Futures Commission for Type 1 (dealing in securities), Type 4 (advising on securities) and Type 9 (asset management) regulated activities.
For investors in Australia: This information is distributed by MIM LLC and is intended for “wholesale clients” as defined in section 761G of the Corporations Act 2001 (Cth) (the Act). MIM LLC exempt from the requirement to hold an Australian financial services license under the Act in respect of the financial services it provides to Australian clients. MIM LLC is regulated by the SEC under US law, which is different from Australian law.
MIMEL: For investors in the EEA, this document is being distributed by MetLife Investment Management Europe Limited (“MIMEL”), authorised and regulated by the Central Bank of Ireland (registered number: C451684), registered address 20 on Hatch, Lower Hatch Street, Dublin 2, Ireland. This document is approved by MIMEL as marketing communications for the purposes of the EU Directive 2014/65/EU on markets in financial instruments (“MiFID II”). Where MIMEL does not have an applicable cross-border licence, this document is only intended for, and may only be distributed on request to, investors in the EEA who qualify as a “professional client” as defined under MiFID II, as implemented in the relevant EEA jurisdiction. The investment strategies described herein are directly managed by delegate investment manager affiliates of MIMEL. Unless otherwise stated, none of the authors of this article, interviewees or referenced individuals are directly contracted with MIMEL or are regulated in Ireland. Unless otherwise stated, any industry awards referenced herein relate to the awards of affiliates of MIMEL and not to awards of MIMEL.
1 MetLife Investment Management (“MIM”) is MetLife, Inc.’s institutional management business and the marketing name for subsidiaries of MetLife that provide investment management services to MetLife’s general account, separate accounts and/or unaffiliated/ third party investors, including: Metropolitan Life Insurance Company, MetLife Investment Management, LLC, MetLife Investment Management Limited, MetLife Investments Limited, MetLife Investments Asia Limited, MetLife Latin America Asesorias e Inversiones Limitada, MetLife Asset Management Corp. (Japan), and MIM I LLC, MetLife Investment Management Europe Limited, Affirmative Investment Management Partners Limited and Raven Capital Management LLC.