At approximately $5.2 trillion, just over half the size of the U.S. corporate bond market, the U.S. commercial mortgage market is home to a variety of attractive investment opportunities.1 Commercial banks and life insurance companies hold the majority of U.S. private commercial mortgages. In the past, the substantial organizational infrastructure required to access and underwrite them has limited institutional investors’ ability to invest in this asset class. Today, new commercial mortgage investment vehicles are emerging every year, and the asset class is becoming more accessible to a broader range of investors. Also, as financial institutions become more familiar with the asset class, more options for leveraging commercial mortgage loan (CML) investments are becoming available. We believe this increased accessibility and familiarity has emerged at an opportune time, as many institutional investors, from public and private pension funds to foundations and endowments, remain under-allocated to the sector and are seeking income-oriented strategies.
Private commercial mortgages can offer multi-asset class portfolios several key benefits, including enhanced portfolio diversification, the potential for favorable risk-adjusted returns, and characteristics that make them attractive for liability-driven investing. Although the commercial mortgage space can be less transparent and more illiquid than other major asset classes, we believe platforms with experience, resources, and scale are able to better source and manage commercial mortgage investments. Additionally, experienced managers have historically been better able to limit losses during downturns, in our opinion. As a result, we believe private commercial mortgages can achieve risk-adjusted returns that few other asset sectors can match.
Commercial Mortgages in a Modern Multi-Asset Portfolio2
We believe commercial mortgages can make an important contribution to a modern multi-asset portfolio by acting as a strong diversifier due to their low correlation to other major asset classes (Figure 1).3 It can be difficult to make like-for-like comparisons across asset classes given the differences in trading frequency, valuation methodology, duration, and index construction. We believe, however, that the correlation and return analysis shown in Figure 1 reflects the general relationships between the total returns of the major asset classes.
Figure 1 | Correlation of Total returns for U.S. Commercial Mortgages Versus Major Asset Classes: 1998-4Q20213
| | Commercial Mortgages | Core Equity Real Estate | CMBS | Stocks | Single-A Corporate Bonds | Gov't Bonds | Private Equity |
|---|
| Commercial Mortgages | 1.00 | 0.07 | 0.73 | -0.10 | 0.42 | 0.38 | -0.03 |
|---|
| Core Equity Real Estate | | 1.00 | 0.07 | 0.17 | -0.19 | -0.04 | 0.33 |
|---|
| Investment Grade CMBS | | | 1.00 | 0.22 | 0.59 | 0.14 | 0.13 |
|---|
| Stocks | | | | 1.00 | 0.07 | -0.60 | 0.67 |
|---|
| Investment Grade Corporate Bonds | | | | | 1.00 | 0.49 | -0.07 |
|---|
| Government Bonds | | | | | | 1.00 | -0.47 |
|---|
| Private Equity | | | | | | | 1.00 |
|---|
Source: See endnote 3 for data sources.
Data as of 2021Q4.
With the exception of Commercial Mortgage Backed Securities (CMBS), private commercial mortgages exhibit relatively low correlations with all other major asset classes. The average correlation of commercial mortgages across our select universe of assets classes is 0.25. The total returns of private commercial mortgages and those of CMBS are correlated primarily because the performance of both is dependent on property cash flows and both are fixed income products. A modest degree of correlation also exists between the returns of commercial mortgages and single-a rated corporate bonds and government bonds.4
The correlation to corporate bonds is due partially to the role of major U.S. corporations as tenants in institutional quality properties. More importantly though, commercial mortgages have fixed income features such as coupon payments, interest rate sensitivity, and credit risk attributes they share with both corporate and government bonds. The correlation between commercial mortgages and bonds is not higher because important differences exist between the two asset classes. First, commercial mortgage performance is driven by the performance of the underlying real estate asset, while public corporate bond performance is driven by the performance of the issuing company. Second, commercial real estate is the underlying collateral and security for a commercial mortgage; corporate bonds are typically unsecured. As a result, commercial mortgages have higher recovery rates and lower loss rates relative to public corporate bonds.5 Third, while the two asset classes are impacted by broader economic factors, corporate bond performance is most closely linked to GDP growth and the corporate tax rate, while real estate’s primary drivers are employment and inflation.
Between 2009 and 2021, the commercial mortgage portfolios of large publicly traded insurance companies achieved a weighted average cumulative loss rate of 1.7%.6 This compares to a 13.3% credit loss rate for the universe of investment grade and below investment grade corporate bonds during the same period.7 Lower loss rates for insurance company mortgage portfolios are heavily influenced by higher recovery rates. During 2009 – 12, the period directly following the Global Financial Crisis, life insurance companies experienced a commercial mortgage recovery rate of 80%, significantly higher than comparable assets classes during normal periods. Their 80% recovery rate compares to a historical average recovery rate of 61.4% for senior secured public corporate bonds and 46.9% for unsecured public corporate bonds between 1987 and 2021.8 Given the lag of defaults and recoveries, it is still too early to get a complete picture of commercial mortgage recovery rates resulting from the pandemic.
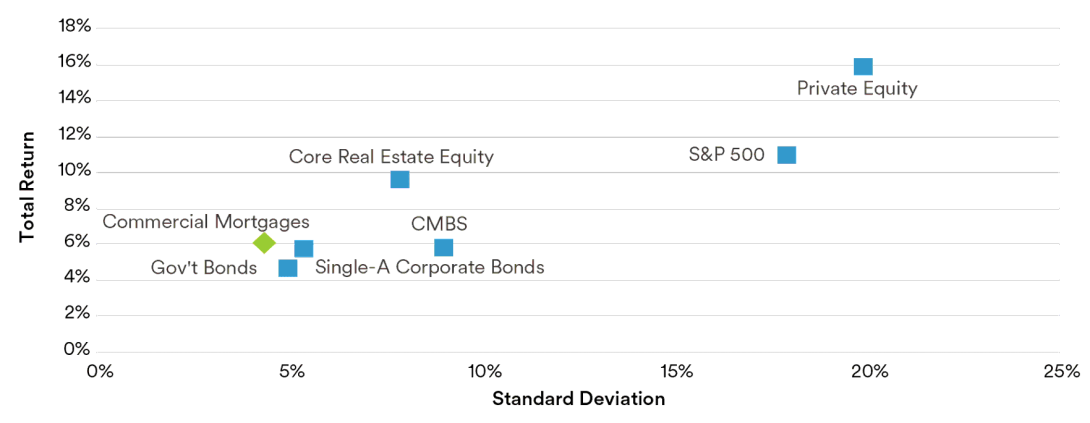
Figure 2 | Historical Average Returns and Risk by Asset Class
Source: See endnote 2 for data sources. Calculations are made from 1998-2021Q4.
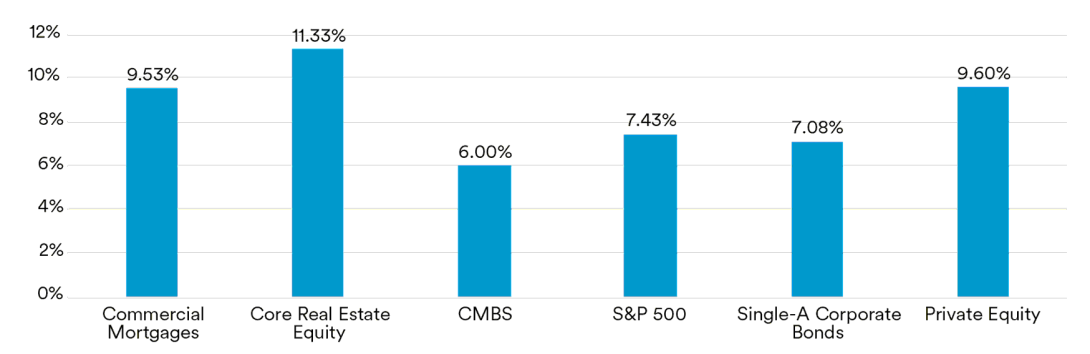
Figure 3 | M-Squared Risk-Adjusted Returns by Asset Class
Source: See endnote 2 for data sources. Calculations are made from 1998-2021Q4.
In addition to acting as a portfolio diversifier and exhibiting lower historical loss rates commercial mortgages have also provided one of the highest risk-adjusted returns among the major asset classes (Figure 2). A major contributor to this is the low historical volatility of commercial mortgages. Like other fixed income products, commercial mortgages typically derive their total returns primarily from income. That income is usually generated from multitenanted properties with staggered lease terms. Leasing to multiple tenants ensures that in many cases the vacancy of a single floor or suite is unlikely to decrease a property’s income below the required level of debt service. Further, staggered lease terms can allow landlords to gradually increase rents paid by their tenants to reflect inflation and supply/demand dynamics, typically increasing debt service coverage ratios over time. This can result in a less volatile and more reliable income stream that can help meet debt service requirements. Stocks and private equity have historically exhibited more volatility because their total returns are driven primarily by appreciation. As a result, the structural benefits of commercial mortgages may be most evident during volatile periods.
In Figure 3, commercial mortgages have the third highest risk-adjusted return using the M-squared calculation measure. The M-squared or Modigliani risk ratio gives us the riskadjusted return by multiplying the Sharpe ratio by the standard deviation of the benchmark and adding the risk-free rate. We calculate the benchmark by allocating a one-seventh weight to each of the seven asset classes in our sample. The asset allocation of a benchmark can change depending on the risk and return profile of a given investor.
Commercial mortgages performed comparatively well during the last two downturns (Figure 4). During the GFC, from 2008Q1 to 2009Q4, commercial mortgages exhibited one of the highest risk-adjusted return of any major asset class. Investment grade corporate bonds and government bonds produced similar profiles. Non-fixed income instruments saw low or negative total returns as well as heightened volatility. During the pandemic-related recession, which we classify as 2020Q1-2021Q4, Commercial mortgages experienced the lowest standard deviation of any of our select asset classes. Commercial mortgages ended up with the fourth highest return/risk ratio behind stocks, core real estate equity, and private equity. We suspect that including 2022, the total returns for the equity asset classes (Stocks, Private Equity, Core Real Estate Equity) would be lower.
Figure 4 | Total Returns and Standard Deviations During Recent Downturns: 2008Q1-2009Q4 & 2020Q1-2021Q4
| | 2008Q1-2009Q4 | 2020Q1-2021Q4 |
|---|
| Annual Total Return | Annual Standard Deviation | Return / Risk Ratio | Annual Total Return | Annual Standard Deviation | Return / Risk Ratio |
|---|
| Commercial Mortgages | 4.9% | 7.7% | 0.64 | 4.1% | 3.6% | 1.13 |
|---|
| Core Equity Real Estate | -11.9% | 7.4% | -1.60 | 9.4% | 4.9% | 1.90 |
|---|
| Investment Grade CMBS | -0.5% | 18.3% | -0.03 | 3.3% | 3.6% | 0.90 |
|---|
| Stocks | -10.7% | 27.0% | -0.40 | 29.0% | 23.3% | 1.24 |
|---|
| Investment Grade Corporate Bonds | 4.5% | 13.4% | 0.33 | 3.9% | 7.0% | 0.56 |
|---|
| Government Bonds | 4.7% | 8.0% | 0.59 | 2.7% | 7.0% | 0.39 |
|---|
| Private Equity | -7.1% | 17.1% | -0.41 | 27.6% | 13.7% | 2.01 |
|---|
Source: See endnote 2 for data sources. Return/Risk ratio calculated by dividing annual total returns by annual standard deviation throughout the time period.
Commercial Mortgages Provide Attractive Yields
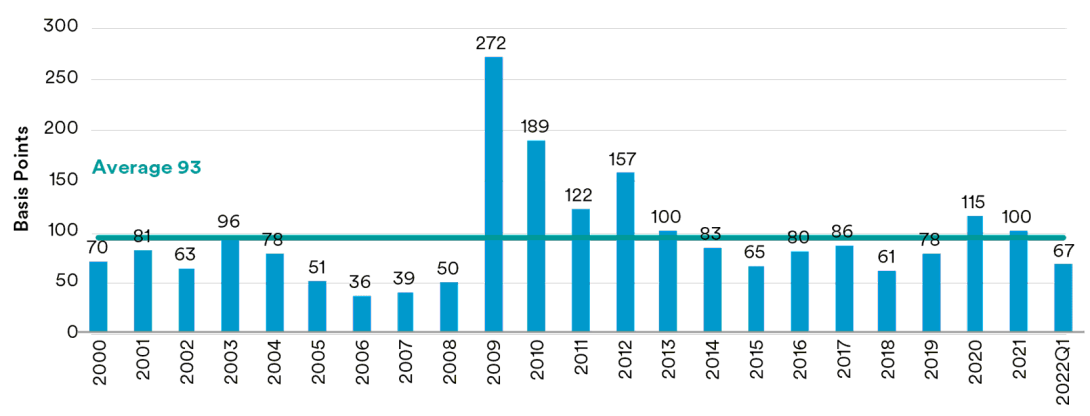
Commercial mortgages have historically delivered a spread premium relative to public corporate bonds with similar risk profiles (Figure 5). Since 2000, fixed rate U.S. commercial mortgages originated by U.S. life insurance companies provided, on average, a 93 basis point spread premium over single-A public corporate bonds.9 There are several reasons for this phenomenon.
Higher costs associated with originating and servicing loans can partially explain the spread premium commercial mortgages provide relative to similar term and risk public corporate bonds. Since these direct commercial mortgages are not publicly traded, investors may also demand a spread premium to compensate for a lack of liquidity. This liquidity premium can vary materially by investor and mortgage features including property type and loan size. The importance of liquidity can vary by investor type and be significantly influenced by the nature of the liabilities being matched, and the overall role that commercial mortgage investments play in the investor’s portfolio. We believe the premium the asset class offers today more than compensates for illiquidity and servicing costs, and represents an attractive relative value opportunity.
Figure 5 | ACLI Commercial Mortgage Spread Premium Over Comparable Public Corporate Bonds (Non-Financial Index)
Source: ACLI Commercial Mortgage Commitments Historical Database (Fixed Rate Mortgages), Bloomberg U.S. Credit Corp ex Financials A1-A3 Index. We use an ex-financials index due to the volatility of financial sector spreads experienced during the GFC.
Real estate borrowers typically include annual rent increases and in some cases inflation increases which can improve the credit quality of the mortgage. With higher income typically comes higher valuations which can lower default risk at maturity. Real estate has typically performed well during times of inflation as discussed in our prior report How Inflation and Rising Interest Rates Impact Real Estate.
Liability-Driven Investing
A compelling case also can be made for the inclusion of commercial mortgages within a Liability-Driven Investing (LDI) framework. LDI’s primary goal is to match assets to liabilities while maximizing risk-adjusted returns. On the former point, commercial mortgages are an effective and versatile option. Loans can be originated as either fixed or floating rate and can carry the full gambit of short or long durations. Terms of 3, 5, 7, and 10 years are all common, and longer durations of 15 or 30 years are available as well. The spread pickup offered by commercial mortgages can also be attractive to those seeking to boost their risk-adjusted returns. As discussed earlier in this paper, commercial mortgages have historically offered some of the highest returns among fixed income investments at a lower level of risk. Recognizing this, many LDI investors have begun to increase their allocations to the commercial mortgage sector in recent years.
Institutional investors have historically allocated between 5% and 10% to real estate.10 For investors who have the ability to reduce their portfolio’s liquidity with commercial mortgages, we believe this level is likely too low. As illustrated above, commercial mortgages can offer a higher yield to comparably rated corporate bonds. Commercial mortgages can be superior to other debt investment options given their historically lower loss rates, lower total return volatility, higher income yields, and relative security of coupon payments.
The Commercial Mortgage Investment Opportunity is Sizeable
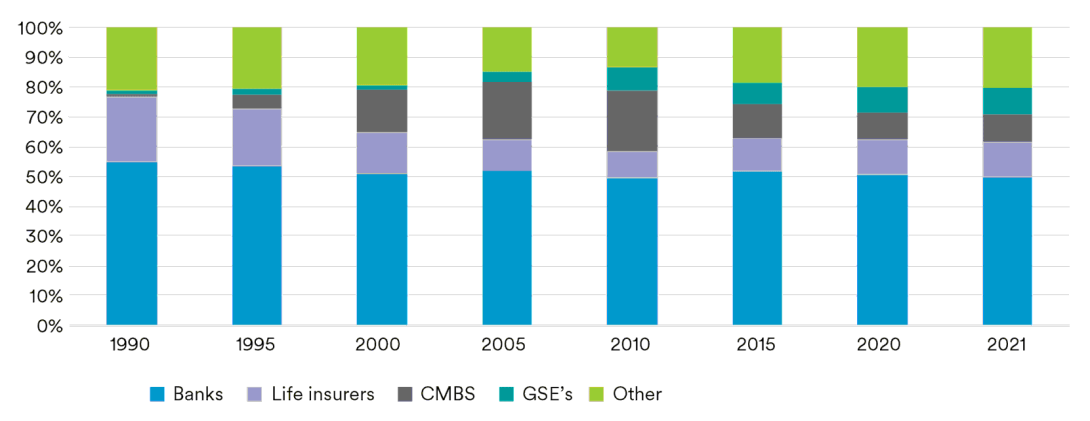
The size of the commercial and multifamily residential mortgage market places it on par with other institutional asset classes. Commercial and multifamily mortgages comprise $5.2 trillion, or 28%, of the entire U.S. mortgage market.11 By comparison, the U.S. corporate bond market is valued at $10.0 trillion.12 The commercial mortgage market has grown since 1990 at roughly 5% annually, with the strongest growth occurring in the early 2000’s. Since 1990, banks, life insurance companies, and CMBS investors have consistently held more than 70% of the commercial mortgages outstanding (Figure 6). However, the government sponsored enterprises (GSE) have been increasing their share of the market in recent years.
Figure 6 | Commercial Mortgages Outstanding: 1990-2021
Source: Federal Reserve Flow of Funds, Tables L219, L220. Data as of 2021.
Active Risk Management
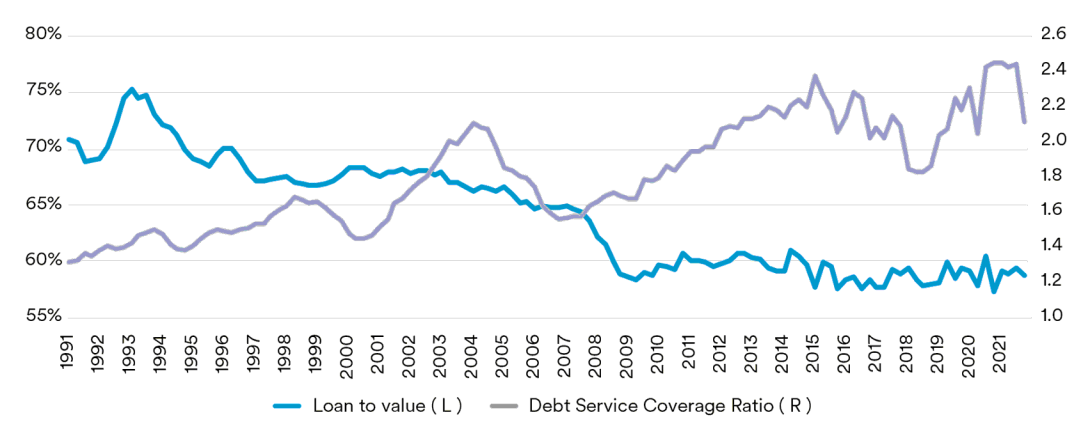
In the 1980s and early 1990s, the quality of commercial mortgages held by publicly traded life insurance companies was similar to BBB-rated corporate bonds, according to public filings. Currently, commercial mortgages held by publicly-traded insurance companies, on average, are comparable to single-A rated corporate bonds due to improvements in credit quality, underwriting, and risk management.13 According to data from the ACLI, the LTV ratio of commercial mortgages held by publicly-traded life insurance companies fell in the mid-1990s, while debt service coverage (DSC) ratios rose (Figure 7).
Figure 7 | Loan-to-Value and Debt Service Coverage Ratios, at Orgination, for Life Insurance Companies
Source: American Countil of Life Insurers. Data as of 2022Q1.
While aggregate life insurance company commercial mortgage performance has been strong in the recent decade, not all lenders have achieved the same level of success. As Figure 8 illustrates, between 2009 and 2022Q1 annualized losses ranged from 0.041% up to 0.24% across our anonymized list of ten major publicly traded life insurance companies. This considerable disparity in performance cannot simply be explained by different risk levels or strategies, as even firms with the worst performance in this group in terms of loss rate exhibited relatively similar LTVs and DSCRs. The dispersion in cumulative loss rates is due, in part, to each insurance company’s selection of assets, markets, and sponsors, and the application of their risk management frameworks to that process.
Figure 8 | Publicy Traded U.S. Life Insurance Company Average Annualized Loss Rate: 2009-2022Q2
Source: Analysis from publicly available SEC filings. See endnote 15. Numbers 2-10 represent anonymized publicly traded life insurance companies that are peers to MetLife.
Outside of the life company space, the contrast in performance becomes even more evident. Between 2009 and 2022Q1, the weighted average annualized loss rate was 0.10% for our ten company subset of publicly-traded life insurance companies.14 This compares to a 0.57% weighted average annualized loss rate for banks during the same time period.15 Banks tend to originate commercial mortgages for smaller properties through their local branches, many of which are located in secondary and tertiary markets that lack liquidity during times of stress and carry significant refinancing risk as a result. Bank-originated commercial mortgages are also often shorter term and floating rate to better match bank liabilities, thus reducing the ability of long term increases in net operating income to improve debt service coverage ratios. CMBS investments, while offering diversification, often do so by including properties across a range of quality and locations. By making single whole loans, life insurers have the ability to be more deliberate about asset and market selection and are more motivated to do so as they will be holding those loans to maturity.
Conclusion
We believe private commercial mortgages can fit well in a multi-asset portfolio due to their historically favorable risk-adjusted returns vis-à-vis other asset classes, as well as their attractive income return, inflation cushion, and lower loss rates versus public corporate bonds with similar risk profiles. They can also be an effective tool for liability-driven investing due to the ability to lend at both fixed and floating rates of short, medium, and long durations. Critical to performance is the combination of choosing the right assets, markets, and sponsors as well as being able to directly source, and manage a portfolio of commercial mortgages. In addition, the ability to move up and down the risk spectrum, seeking the most attractive risk-adjusted returns throughout real estate cycles is very important. Given the unique attributes and at times opaque nature of the commercial mortgage market, selecting an investment platform with the ability to adjust to a variety of market conditions can be a critical determinant of success.
Endnotes
1 Federal Reserve Flow of Funds, 2021Q4
2 The commercial mortgage data shown in Figures 1, 2, 3, and 4 come from the Giliberto-Levy Commercial Mortgage Performance Index which models senior commercial mortgage performance based on the American Council of Life Insurers (ACLI) commitments data and is most comparable to the single-A rated corporate and CMBS universe. The commercial mortgage loss data is collected from publicly available SEC filings from life insurance companies. While the commercial mortgages held by these publicly traded life insurance companies have a single A corporate credit risk profile, on average, they also hold below investment grade mortgages as well as subordinated commercial mortgages which are below investment grade.
3 The indices used for each asset class are: Commercial Mortgages, Giliberto-Levy Commercial Mortgage Performance Index which is comprised of fixed-rate commercial mortgage loans held on balance sheets of institutions such as life insurance companies and pension funds; Government Bonds, Bloomberg U.S. Treasury Index; Bloomberg Single-A rated Corporate Bond Index; Core Equity Real Estate, NCREIF Property Index (NPI); Stocks, S&P 500 Total Return Index; Commercial Mortgage-Backed Securities, Barclays Capital U.S. Investment-Grade CMBS Index, Private Equity, Cambridge Associates LLC U.S. Private Equity Index; Hedge Funds, HFRI Hedge Fund Index; International Stocks, MSCI EAFE Index. Data is from 1997Q1-2022Q1. 1997 is used as a starting point as it was the first time data was consistently available across these asset classes.
4 The Giliberto-Levy Commercial Mortgage Performance (GLCMP) Index models commercial mortgage performance based on the American Council of Life Insurers (ACLI) commitments data.
5 Moody’s Investor Services, “Annual Default Study: Corporate Default and Recovery Rates, 1920 – 202020 (Excel Data).
6 The analysis is from publicly available SEC filings and includes only life insurance companies whose commercial mortgage portfolios were largely comprised of investment grade and below investment grade senior loans and to a lesser extent included exposure to below investment grade subordinated loans. The data includes only public insurance companies that report loss rates and delinquencies in their SEC filings. These life insurance companies include Allstate, AIG, Ameriprise, Genworth, Lincoln, MetLife, Principal, Protective, Prudential, and Unum.
7 Moody’s Investor Services, “Annual default study: Following a sharp rise in 202, corporate defaults will drop in 2021”
8 Ibid.
9 ACLI Commercial Mortgage Commitments Historical Database (Fixed Rate Mortgages), Bloomberg U.S. Credit Corp ex Financials A1 – A3 Index. Spread premiums are gross, not net of fees.
10 Federal Reserve Selected Assets and Liabilities of Commercial Banks in the United States. ACLI Invested Assets Portfolio Profile 2020. PREA Investor Report 2017. 2021 NACUBO-TIAA Study of Endowments.
11 Federal Reserve Flow of Funds, L 219, L 220, 2020Q1.
12 Securities Industry and Financial Markets Association, U.S. Bond Market Issuance and Outstanding.
13 Morgan Stanley Fixed Income Research, “Commercial Mortgage Defaults: 30 Years of History”, September 2004 and Berkshire Investment Advisors, “Fixed Income Investment: The Commercial Mortgage Alternative”, September 1993.
14 Internal MetLife Analysis.
15 The Federal Reserve Board.
Disclosures
This material is intended solely for Institutional Investors, Qualified Investors and Professional Investors. This analysis is not intended for distribution with Retail Investors. This document has been prepared by MetLife Investment Management (“MIM”)1 solely for informational purposes and does not constitute a recommendation regarding any investments or the provision of any investment advice, or constitute or form part of any advertisement of, offer for sale or subscription of, solicitation or invitation of any offer or recommendation to purchase or subscribe for any securities or investment advisory services. The views expressed herein are solely those of MIM and do not necessarily reflect, nor are they necessarily consistent with, the views held by, or the forecasts utilized by, the entities within the MetLife enterprise that provide insurance products, annuities and employee benefit programs. The information and opinions presented or contained in this document are provided as the date it was written. It should be understood that subsequent developments may materially affect the information contained in this document, which none of MIM, its affiliates, advisors or representatives are under an obligation to update, revise or affirm. It is not MIM’s intention to provide, and you may not rely on this document as providing, a recommendation with respect to any particular investment strategy or investment. Affiliates of MIM may perform services for, solicit business from, hold long or short positions in, or otherwise be interested in the investments (including derivatives) of any company mentioned herein. This document may contain forward-looking statements, as well as predictions, projections and forecasts of the economy or economic trends of the markets, which are not necessarily indicative of the future. Any or all forward-looking statements, as well as those included in any other material discussed at the presentation, may turn out to be wrong. All investments involve risks including the potential for loss of principle and past performance does not guarantee similar future results. Investing in the strategies discussed herein are subject to various risks which must be considered prior to investing. These risks may include, but are not limited to Liquidity Risk, Interest Rate Risk, Credit Risk, Prepayment Risk, and Counterparty Risk. In the U.S. this document is communicated by MetLife Investment Management, LLC (MIM, LLC), a U.S. Securities Exchange Commission registered investment adviser. MIM, LLC is a subsidiary of MetLife, Inc. and part of MetLife Investment Management. Registration with the SEC does not imply a certain level of skill or that the SEC has endorsed the investment advisor. This document is being distributed by MetLife Investment Management Limited (“MIML”), authorised and regulated by the UK Financial Conduct Authority (FCA reference number 623761), registered address Level 34 One Canada Square London E14 5AA United Kingdom. This document is approved by MIML as a financial promotion for distribution in the UK. This document is only intended for, and may only be distributed to, investors in the UK and EEA who qualify as a “professional client” as defined under the Markets in Financial Instruments Directive (2014/65/EU), as implemented in the relevant jurisdiction, and the retained EU law version of the same in the UK. For investors in the Middle East: This document is directed at and intended for institutional investors (as such term is defined in the various jurisdictions) only. The recipient of this document acknowledges that (1) no regulator or governmental authority in the Gulf Cooperation Council (“GCC”) or the Middle East has reviewed or approved this document or the substance contained within it, (2) this document is not for general circulation in the GCC or the Middle East and is provided on a confidential basis to the addressee only, (3) MetLife Investment Management is not licensed or regulated by any regulatory or governmental authority in the Middle East or the GCC, and (4) this document does not constitute or form part of any investment advice or solicitation of investment products in the GCC or Middle East or in any jurisdiction in which the provision of investment advice or any solicitation would be unlawful under the securities laws of such jurisdiction (and this document is therefore not construed as such). For investors in Japan: This document is being distributed by MetLife Asset Management Corp. (Japan) (“MAM”), a registered Financial Instruments Business Operator (“FIBO”). For Investors in Hong Kong: This document is being issued by MetLife Investments Asia Limited (“MIAL”), a part of MIM, and it has not been reviewed by the Securities and Futures Commission of Hong Kong (“SFC”). For investors in Australia: This information is distributed by MIM LLC and is intended for “wholesale clients” as defined in section 761G of the Corporations Act 2001 (Cth) (the Act). MIM LLC exempt from the requirement to hold an Australian financial services license under the Act in respect of the financial services it provides to Australian clients. MIM LLC is regulated by the SEC under US law, which is different from Australian law.
1 MetLife Investment Management (“MIM”) is MetLife, Inc.’s institutional management business and the marketing name for subsidiaries of MetLife that provide investment management services to MetLife’s general account, separate accounts and/or unaffiliated/third party investors, including: Metropolitan Life Insurance Company, MetLife Investment Management, LLC, MetLife Investment Management Limited, MetLife Investments Limited, MetLife Investments Asia Limited, MetLife Latin America Asesorias e Inversiones Limitada, MetLife Asset Management Corp. (Japan), and MIM I LLC
L0922025716[exp0924][All States], L0922025471[exp0824][All States], L0922025506[exp0924][All States], L0922025453[exp0924][All States], L0922025521[exp0824][All States]