DWS
Bernard F. Ryan, CFA
Insurance Coverage
bernie.ryan@dws.com
617-295-2105
dws.com/InsuranceAM
875 Third Avenue
New York, NY 10022


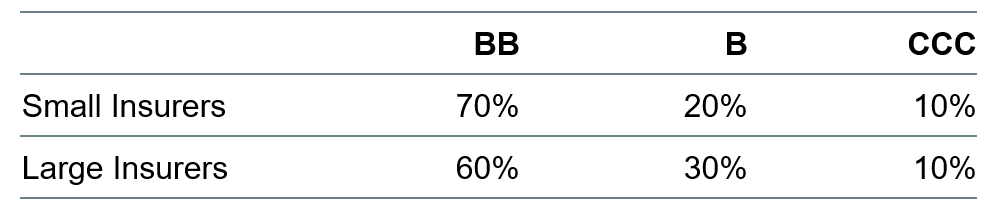
Insurance companies have historically allocated toward higher quality yield instruments. Over the past decade, amid a persistent low interest rate environment, insurance companies have gradually increased their allocations outside of investment grade bonds into primarily the higher quality end of the high yield corporate bonds. As insurance companies grow in size, their allocations to high yield have tended to increase, resulting in insurance companies making up an increasing segment of the high yield market. One trend we have observed is more insurance companies opting to adjust or customize their high yield allocations. Given their strong empirical performance, Fallen Angels have become an alternative option for high yield investors looking to allocate primarily to the higher ratings cohort of the market. In this paper, we plan on comparing a Fallen Angels strategy to upper-tier high yield strategies consistent with how insurance companies are currently allocated within the high yield space. Since we see a difference between smaller and larger insurance companies on their high yield investments, we distinguish between “smaller insurers” and “larger insurers” by ratings-based allocation mixes shown in Figure 1. For Fallen Angels, this paper will highlight the composition, performance, and characteristics of the ICE BofA Fallen Angel High Yield Index cohort of the ICE BofA U.S. High Yield index.
FIGURE 1
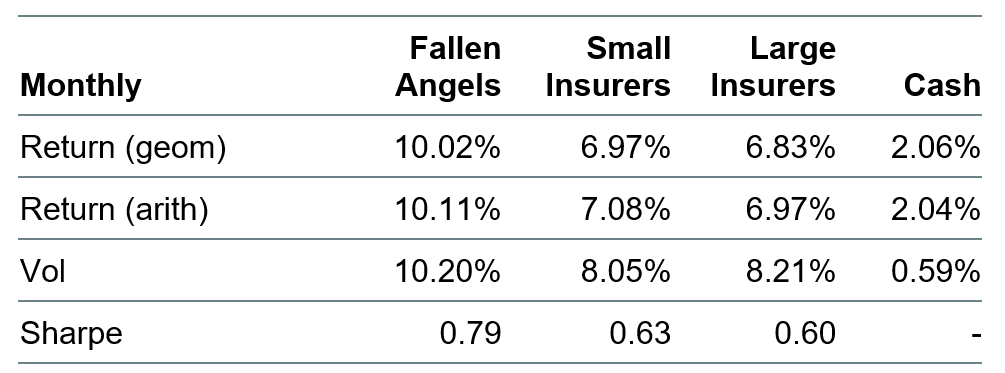
Since 1996, the inception of the ICE BofA Fallen Angel High Yield Index, Fallen Angels have generated favourable absolute and risk-adjusted returns, especially as compared with how small and large insurance companies invest in high yield. Fallen Angels were able to generate roughly 3% excess returns per annum over allocations consistent with smaller and larger insurers over this period with modestly higher volatility (see Figure 2), As with its other corporate bond indices, the ICE BofA Fallen Angel High Yield Index rebalances at the end of each month, adding in recently downgraded names based on composite rating as well as removing defaulted securities from its constituents1.
FIGURE 2. RETURN, VOLATILITY AND SHARPE RATIO OF U.S. CREDIT INDICES
When looking at calendar-year returns Figure 3, shows that Fallen Angels outperformed small and large insurance companies in 16 and 17 of the 24 years (including 2020 through the end of May), respectively, and generated a higher Sharpe ratio than both small and large insurers in 15 of the 24 years.
FIGURE 3. CALENDAR YEAR RETURN AND SHARPE RATIO OF FALLEN ANGELS AND SMALL AND LARGE INSURERS
| Return | Sharpe | |||||
| Returns | Fallen angels | Small insurers | Large insurers | Fallen angels | Small insurers | Large insurers |
| 1997 | 15.67% | 13.49% | 13.45% | 2.32 | 2.10 | 2.11 |
| 1998 | 7.26% | 4.58% | 4.08% | 0.54 | (0.05) | (0.12) |
| 1999 | 0.76% | 1.94% | 2.03% | (1.37) | (0.92) | (0.86) |
| 2000 | ‒1.43% | ‒1.92% | ‒2.90% | (1.11) | (1.64) | (1.72) |
| 2001 | 25.86% | 7.70% | 6.68% | 2.09 | 0.41 | 0.30 |
| 2002 | ‒2.40% | ‒2.23% | ‒1.81% | (0.17) | (0.30) | (0.26) |
| 2003 | 34.67% | 23.61% | 24.26% | 3.80 | 4.03 | 4.08 |
| 2004 | 11.48% | 9.88% | 9.99% | 2.24 | 2.23 | 2.30 |
| 2005 | 2.68% | 2.88% | 2.93% | (0.03) | (0.00) | 0.01 |
| 2006 | 15.23% | 11.02% | 11.18% | 2.86 | 2.47 | 2.60 |
| 2007 | 0.20% | 2.18% | 2.26% | (0.77) | (0.48) | (0.46) |
| 2008 | ‒25.77% | –23.78% | ‒24.64% | (1.14) | (1.44) | (1.48) |
| 2009 | 64.88% | 50.00% | 50.25% | 3.41 | 4.04 | 3.92 |
| 2010 | 17.95% | 14.98% | 14.88% | 2.26 | 2.24 | 2.22 |
| 2011 | 3.48% | 5.17% | 5.02% | 0.47 | 0.63 | 0.61 |
| 2012 | 21.58% | 15.06% | 15.13% | 5.44 | 4.17 | 4.14 |
| 2013 | 9.25% | 6.44% | 6.67% | 1.83 | 1.36 | 1.42 |
| 2014 | 7.08% | 3.78% | 3.38% | 1.72 | 0.87 | 0.79 |
| 2015 | ‒3.24% | ‒3.16% | ‒3.55% | (0.55) | (0.52) | (0.58) |
| 2016 | 25.97% | 15.79% | 16.16% | 2.70 | 2.79 | 2.78 |
| 2017 | 10.42% | 7.36% | 7.32% | 3.70 | 3.37 | 3.26 |
| 2018 | ‒4.78% | ‒2.43% | ‒2.34% | (1.49) | (1.35) | (1.28) |
| 2019 | 17.33% | 14.83% | 14.69% | 2.74 | 2.56 | 2.49 |
| 2020 | 15.02% | 7.20% | 6.70% | 0.86 | 0.53 | 0.49 |
Source: Bloomberg, ICE BAML Indices, DWS as of 12/31/2020. Forecasts are not a reliable indicator of future returns. Forecasts are based on assumptions, estimates, views and hypothetical models or analyses, which might prove inaccurate or incorrect.
As illustrated in Figure 4, in calmer markets, Fallen Angels are historically comparable to spreads on ratings-based allocations of insurance companies. The average OAS over this period for the Fallen Angels index was 490bps as compared to 466bps and 485bps for small and larger insurers, respectively. As with insurance companies’ generally higher-rated bias within their high yield allocations, Fallen Angels is predominantly BB-rated (roughly ¾ of the index market value on average), having been downgraded from Investment Grade (see Figure 12).
FIGURE 4. HISTORICAL OPTIONS-ADJUSTED SPREAD OF U.S. FALLEN ANGELS AND SMALLER AND LARGE INSURERS
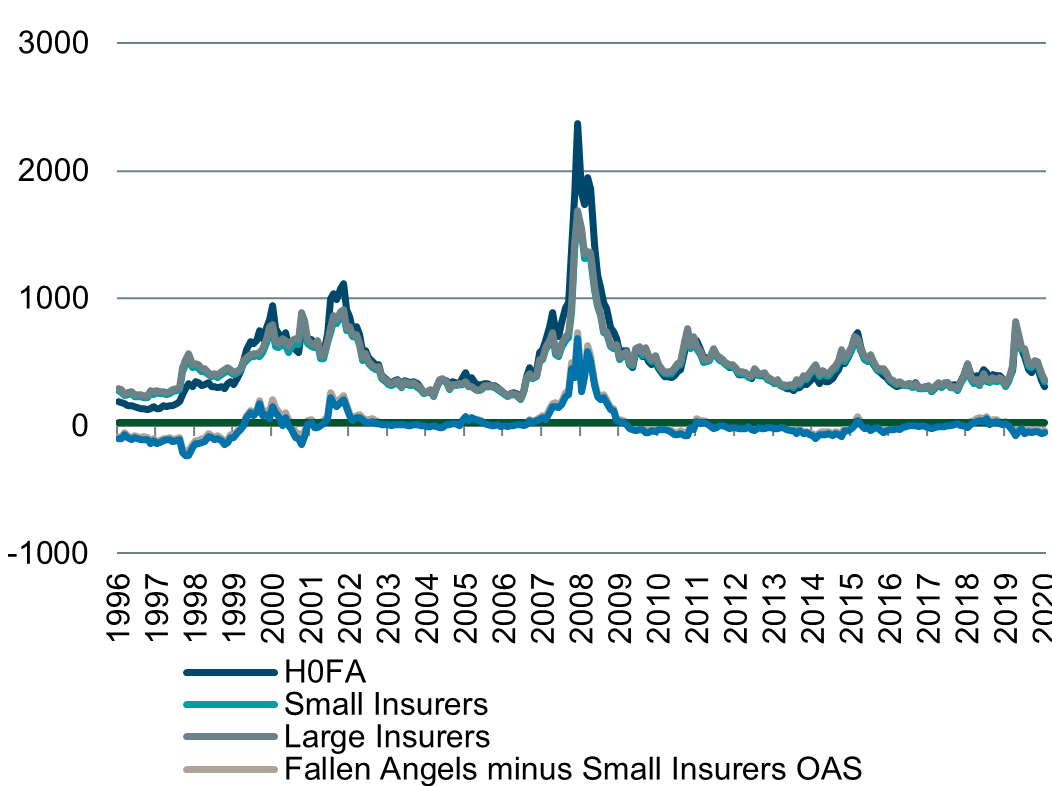
FIGURE 5. HISTORICAL OPTIONS-ADJUSTED SPREAD OF U.S. FALLEN ANGELS AND SMALLER AND LARGE INSURERS
Source: ICE BAML Indices, DWS Calculations as of 12/31/2020.
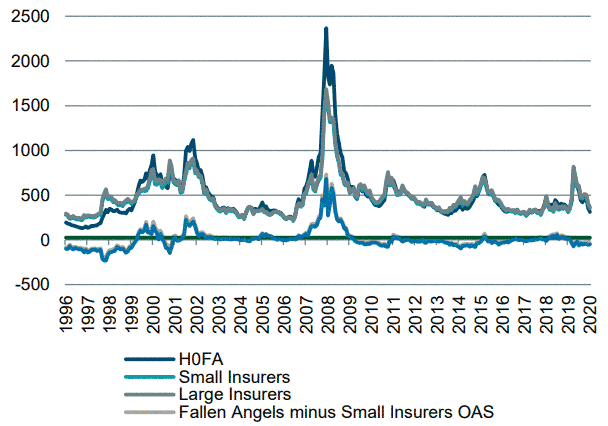
FIGURE 6. HISTORICAL OPTIONS-ADJUSTED SPREAD OF U.S. FALLEN ANGELS AND SMALLER AND LARGE INSURERS
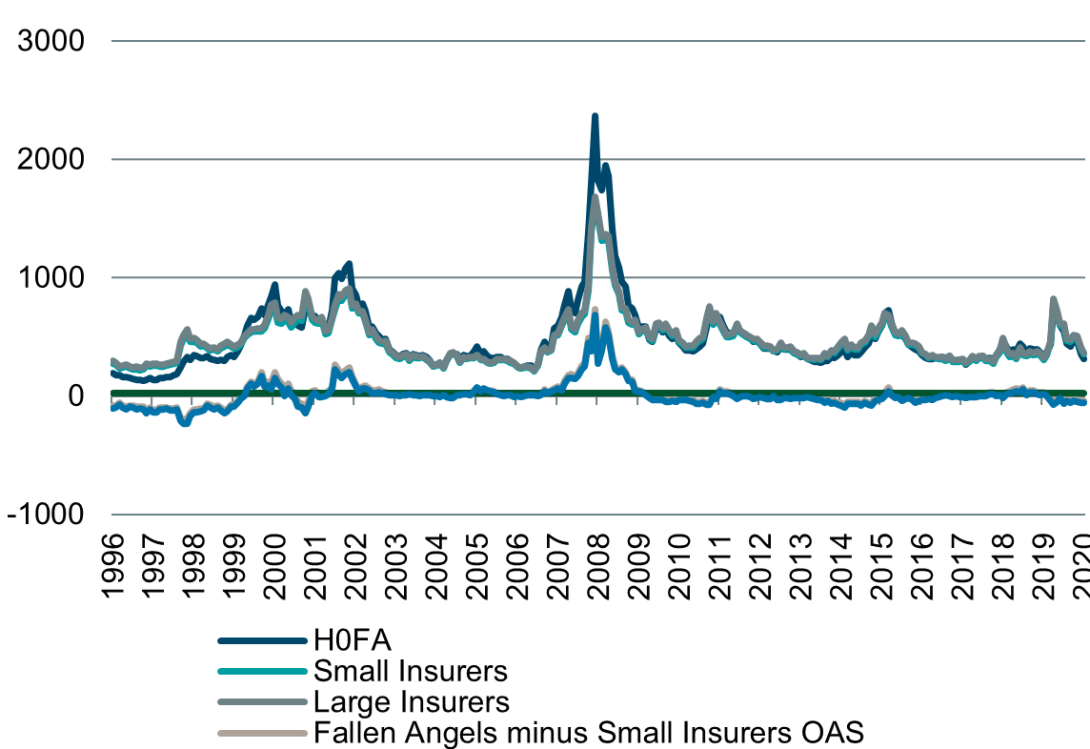
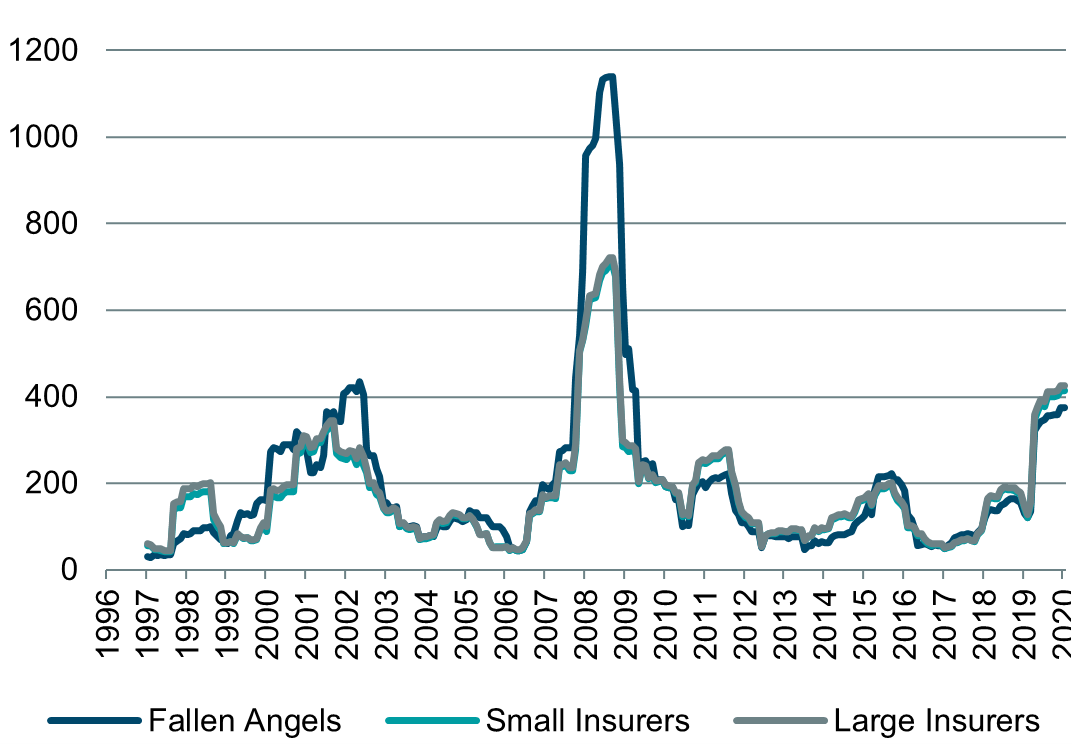
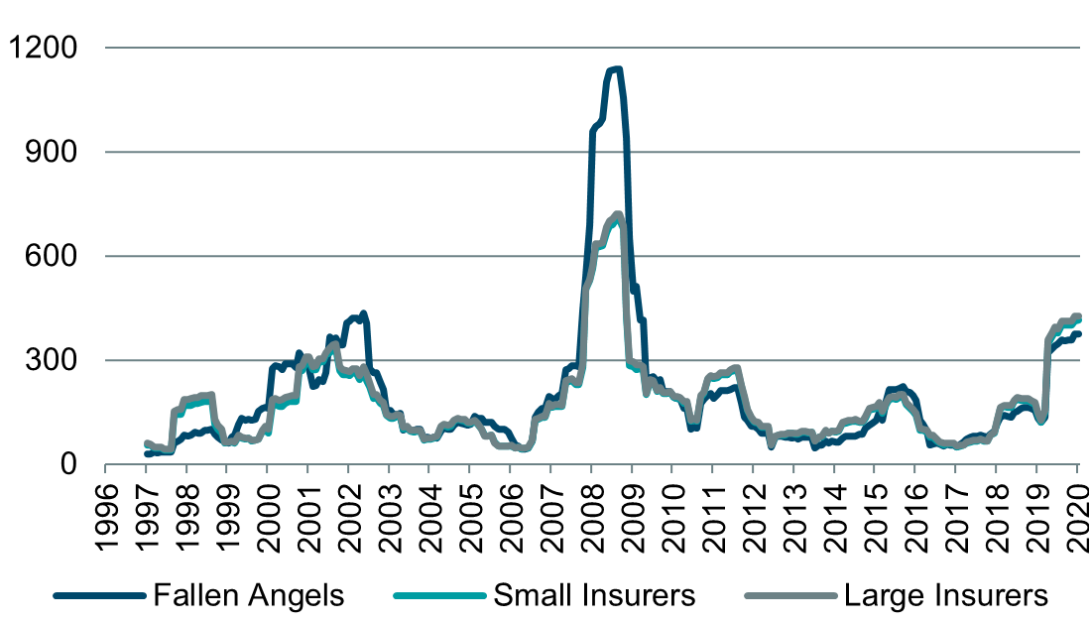
However, during periods of turmoil, Fallen Angels spreads have, at times, widened to levels higher than small and large insurers. Figure 5 and Figure 6 show the historical differential in OAS between the Fallen Angels index and small and large insurers. As noted, while Fallen Angels on average trades in line with small and large insurers, Fallen Angels OAS has widened beyond them on a few occasions over the past 24 years, most notably in 2000 (tech bubble) 2002 (telecoms) and 2008 (global financial crisis).
Another way of explaining these spikes in relative risk is to look at rolling spread volatility. Figure 7 shows higher levels of spread volatility for U.S., Fallen Angels in periods of idiosyncratic industry stress such as 2002, 2006, 2008, and 2016.
FIGURE 7. HISTORICAL 12M ROLLING SPREAD VOLATILITY OF U.S. FALLEN ANGELS AND SMALL AND LARGE INSURERS
What exacerbates these moves is the fact that Fallen Angels issues, due to having been issued with investment grade ratings, are typically longer dated maturity and therefore longer duration credits than are bonds issued with High Yield ratings. 8 illustrates the historical modified duration of Fallen Angels as compared to small and large insurers and U.S. Investment Grade Corporates. Historically, the index duration of the index has shortened during periods of strong credit fundamentals due to the lack of new “issues” (downgrades, in this case) and the increasing number of bonds trading to call as prices rise. During periods of market stress, however, the index duration has, at times, extended as a function of significant downgrade activity (see Figure 8). During these periods, heightened levels of spread volatility, combined with this spread duration extension risk, can subject the Fallen Angels universe to outsized downside price risk at times.
FIGURE 8. HISTORICAL MODIFIED DURATION OF U.S. CREDIT INDICES
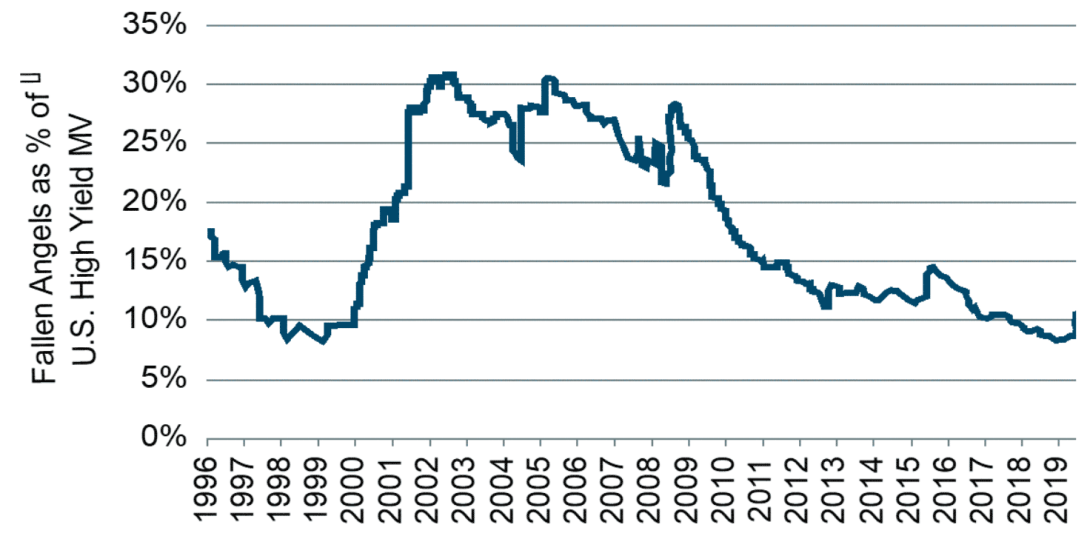
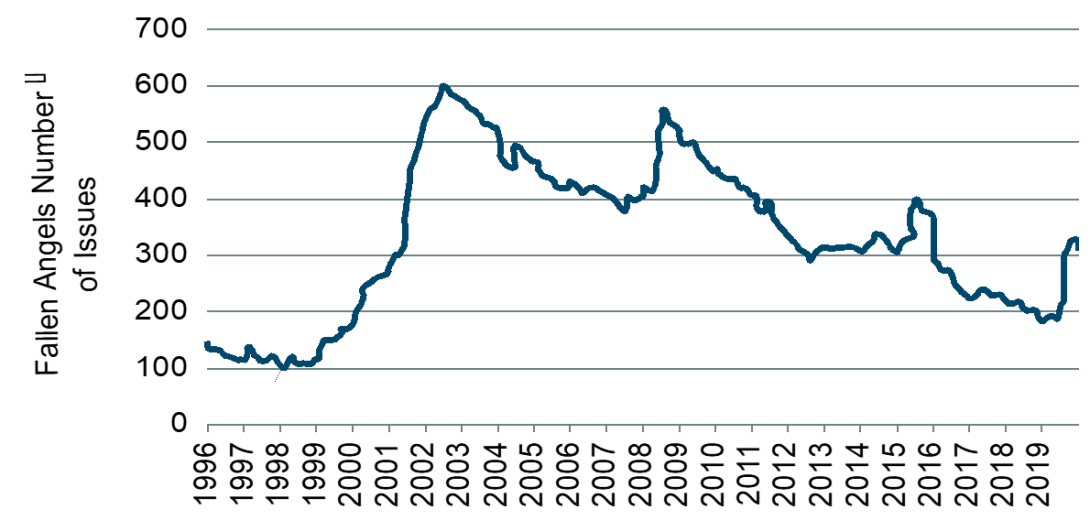
As shown in Figure 9, Fallen Angels have, on average, accounted for roughly 15–20% of the U.S. High Yield market over the past 25 years. Throughout the early and mid-2000s, Fallen Angels grew to make up nearly 30% of the aggregate high yield market. The number of Fallen Angels issues can be rather chunky (see Figure 11), although absent a significant pickup in defaults, the average longer maturity of these credits means that the market value of the index tends to be more stable following significant downgrade cycles.
FIGURE 9. PERCENTAGE WEIGHT OF FALLEN ANGELS AS A PROPORTION OF U.S. HIGH YIELD
The clustered nature of Fallen Angels downgrades results in more dynamic shifts in the industry composition of the Fallen Angels universe, as shown in Figure 10. Increases in issuance have typically coincided with either significant macroeconomic events such as the tech bubble (2000) and the global financial crisis (2008) or idiosyncratic sector-specific headwinds such as automotives (2005) and energy (2016).
Investors looking to purchase the Fallen Angels index in its entirety should be aware of this industry concentration risk that has historically been exacerbated in periods of credit stress.
FIGURE 10. MONTHLY INDEX COMPOSITION OF THE U.S. FALLEN ANGELS INDEX BY MARKET VALUE
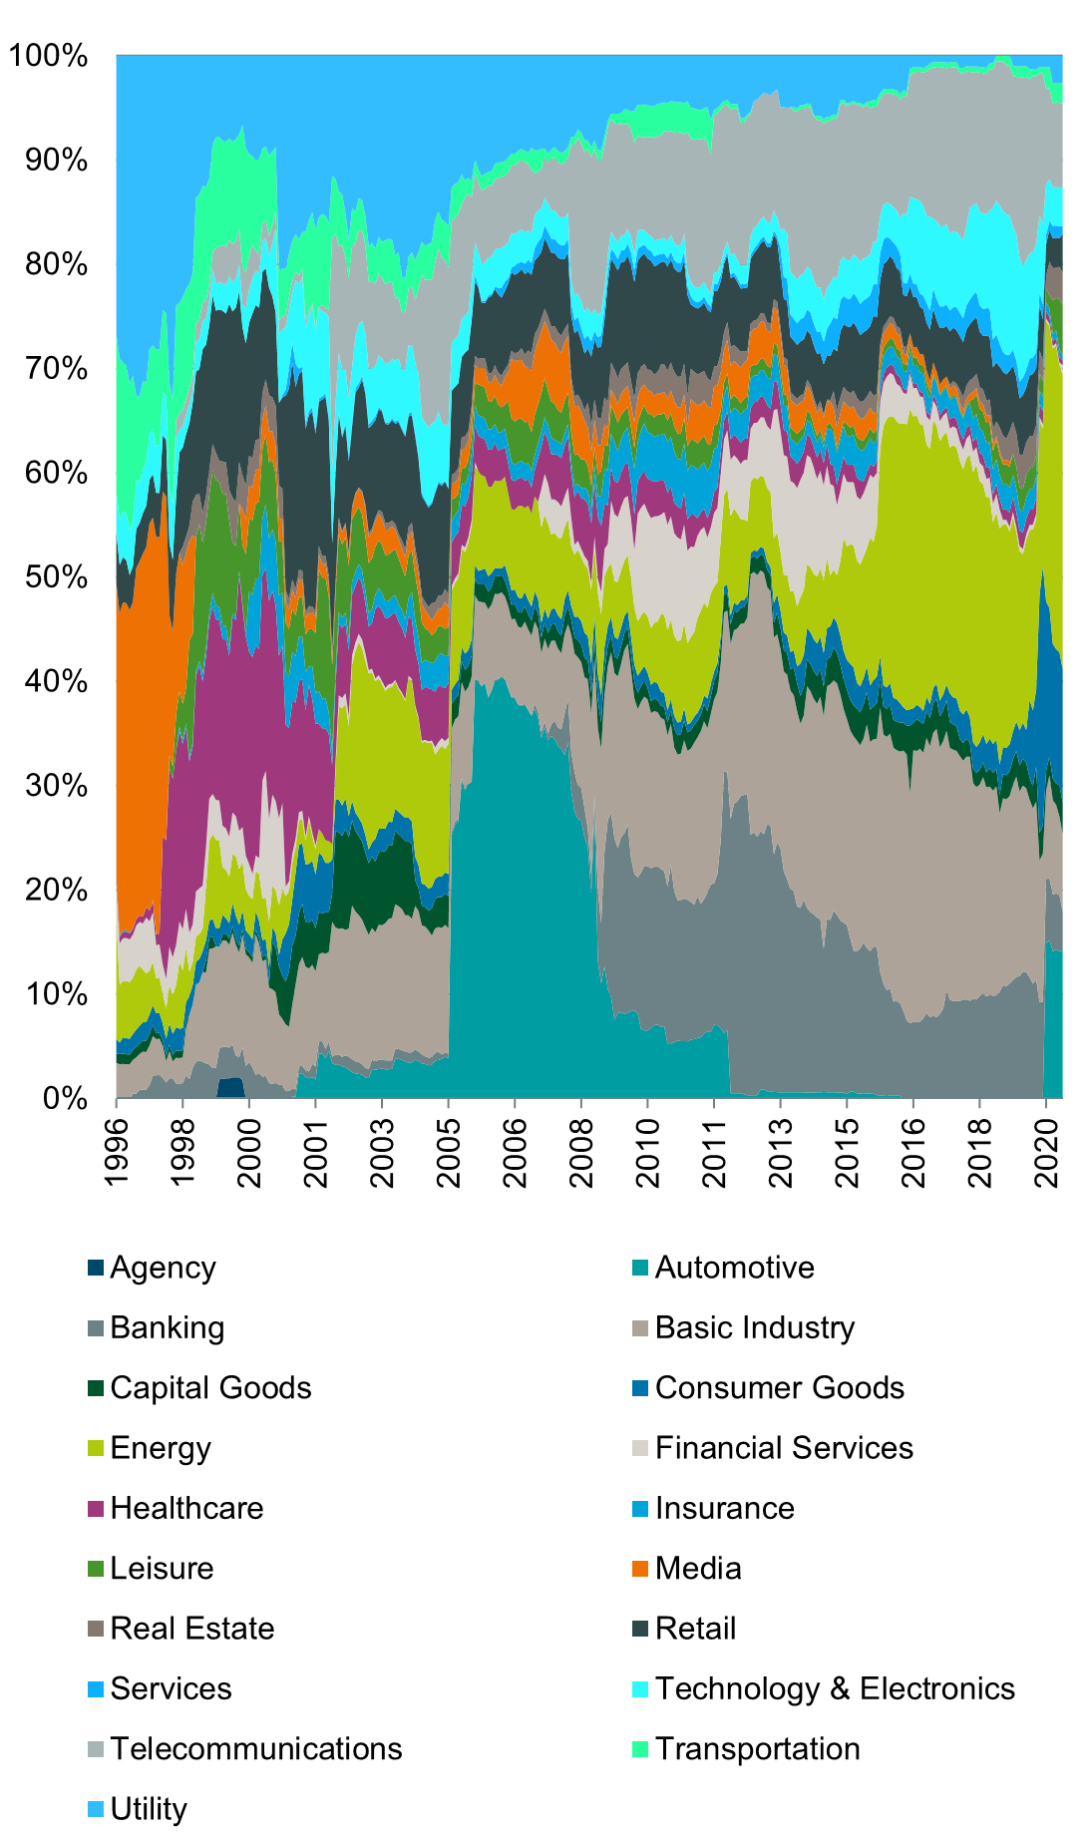
FIGURE 11. NUMBER OF ISSUES WITHIN THE U.S. FALLEN ANGELS INDEX
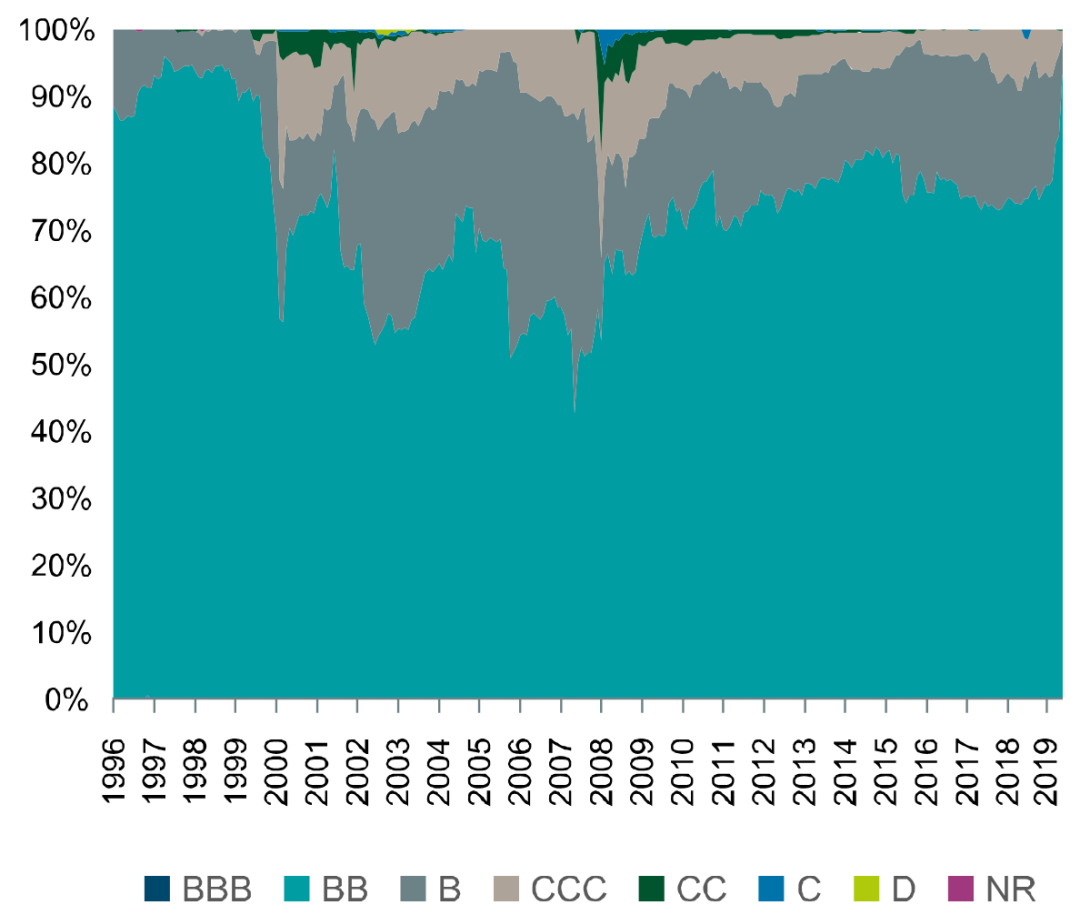
As mentioned previously, by virtue of Fallen Angels being downgraded legacy Investment Grade issues, the characteristics of the index will vary from a more static ratings-weighted approach in a few noticeable ways. Most obviously, the average credit rating for the Fallen Angels Index will skew heavily toward upper tier high yield as a function of migration from investment grade. As a result of investment grade issuance, the average duration of a Fallen Angel typically sits somewhere between U.S. High Yield and U.S. IG.
FIGURE 12. HISTORICAL RATINGS COMPOSITION OF THE U.S. FALLEN ANGELS INDEX BY MARKET VALUE
Perhaps a sign of behavioural biases or forced-selling by stricter investment mandates, the month preceding downgrade on average fare very poorly for Fallen Angels corporate bonds.
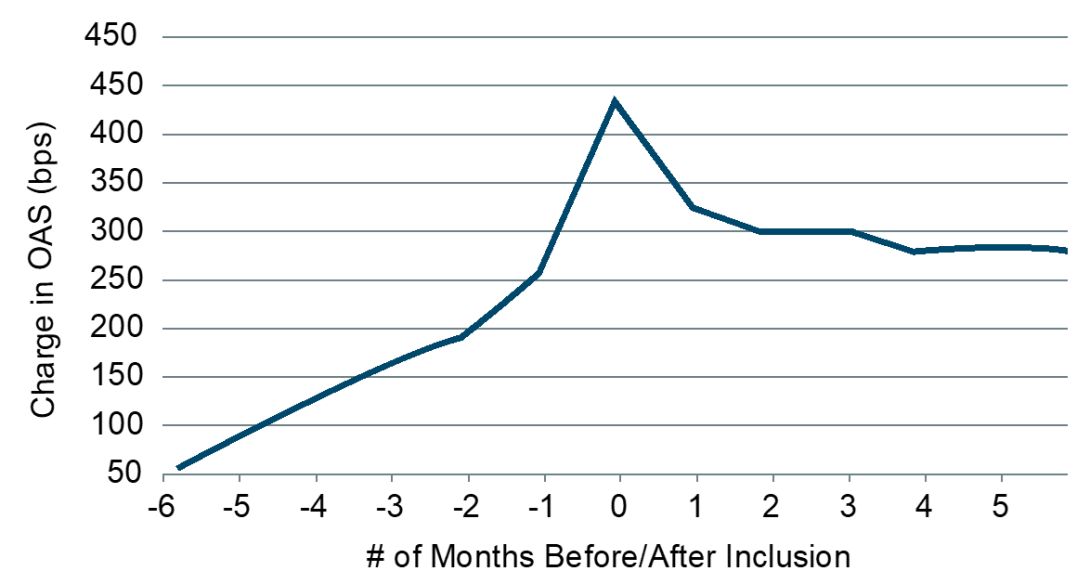
Figure 13 shows the average spread activity in the 6 months prior to and 6 months immediately following downgrade to High Yield. As the figure illustrates, average spread widen-ing for an issuer in this period leading up to downgrade was 384bps. For investors willing to either hold or buy recently downgraded issues, recovery in Fallen Angel OAS was sharpest in the first month following index inclusion at roughly 110bps. This suggests that despite spread widening leading up to the downgrade, ratings-agnostic, opportunistic buyers of credit are quick to step into the market2. Also, the date when a fallen angel enters high yield index varies between providers. For example, the Markit iBoxx USD High Yield Index, bonds downgraded to high yield are held in a 3 month ratings stabilization period before entering the index. Some of the other indexes wait one month. This may be part of the reason for the big drop off in OAS after one month in Figure 13.
FIGURE 13. AVERAGE ISSUER CHANGE IN OPTIONS-ADJUSTED SPREAD 6 MONTHS PRIOR TO AND 6 MONTHS FOLLOWING DOWNGRADE FROM INVESTMENT GRADE TO HIGH YIELD
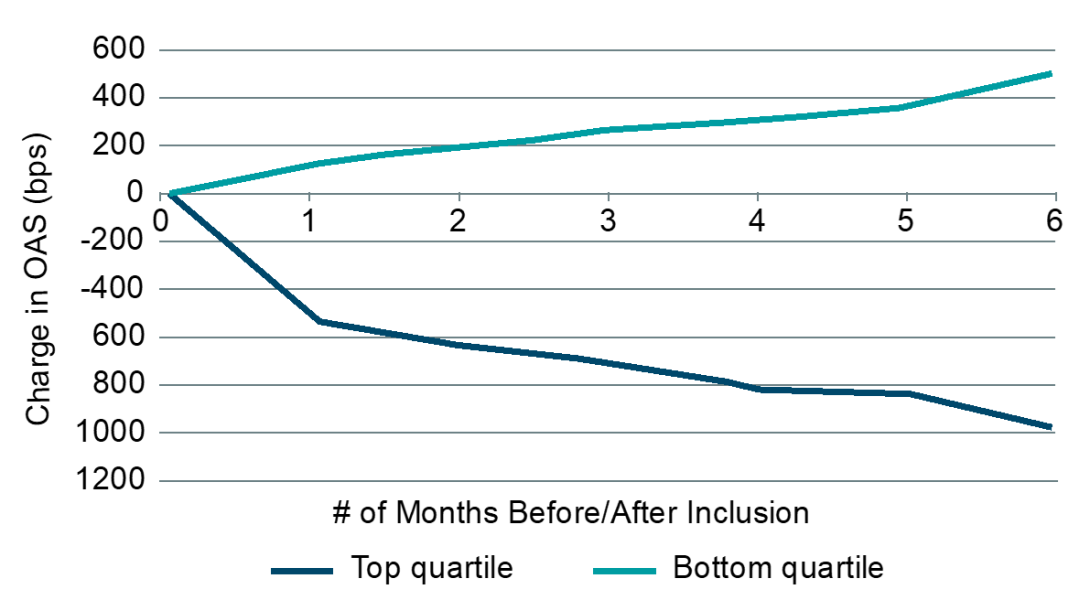
As with any asset experiencing significant price pressure and fundamental weakness, buying Fallen Angels does not come without its own risks. While the average spread recovery immediately following downgrade has been general positive for buyers, the potential for buying “falling knives” remains a risk for indiscriminate buyers of these credits. This can be demonstrated through the dispersion in spread activity across the universe of Fallen Angels issuers. Figure 14 shows the spread behaviour of the top and bottom quartiles as ranked based on the change in spread from 6 months prior to downgrade until the time of downgrade. As shown, there is a significant differential in spread activity for top quartile versus bottom quartile issuers. While the average spread action has generally been positive, the bottom quartile, which is a significant portion of the underlying issuers, experienced continuing weakness in spreads, culminating in average spread widening of about 500bps.
FIGURE 14. CHANGE IN OPTIONS-ADJUSTED SPREAD FOR TOP VERSUS BOTTOM QUINTILE ISSUERS FOR THE 6 MONTHS FOLLOWING DOWNGRADE FROM INVESTMENT GRADE TO HIGH YIELD
Insurance companies appear to already be investing in high-yield akin to a fallen angel approach. Our observation is that investing in Fallen Angels, in many cases, can outweigh the risks of investing in a broader high-yield despite an average higher overall credit rating. Opportunistic buyers of the asset class have been, on average, rewarded by strong spread rallying post-downgrade. Given the nature of purchasing downgraded securities, which often demonstrates a strong negative momentum bias in fundamentals and in price terms, indiscriminate purchasing of Fallen Angels can result in the ownership of fundamentally impaired credits. As such, avoiding exposure to deteriorating credits—either through fundamental investing or through a more systematic approach—can help opportunistic investors invest in Fallen Angels while potentially mitigating the risk of significant drawdown risk and default loss potential.
1 Index constituent composite ratings are updated once a month as part of the rebalancing process. Composite rating changes take effect on the last calen-dar day of the month based on information available up to and including the rebalancing lock-out date (the third business day prior to the last business day of the month). Rating upgrades or downgrades occurring after that day will not be considered in the current month rebalancing and will get incorporated at the following month’s rebalancing. For example, assuming there are no Global Holidays in between, if August 31 fell on a Friday the rebalancing lock-out date would occur on August 28. Therefore, a bond that was downgraded to below investment grade on August 28 would transition from the investment grade Index to the high yield Index at the August 31 rebalancing. Conversely, if the bond was downgraded on August 29, it would remain in the investment grade Index for the month of September and transition to high yield at the September 30 rebalancing. Composite ratings are the simple averages of ratings from Moody’s, S&P and Fitch.
2 Since the rebound in spreads is generally pronounced in the first couple of months immediately following downgrade, strategies that are able to purchase these corporates quickly have the potential to benefit more significantly from the speed of recovery.


Risk disclosure
Bonds are subject to interest rate risk. When interest rates rise, bond prices fall; generally the longer a bond’s maturity, the more sensitive it is to this risk. Bonds may also be subject to call risk, which is the risk that the issuer will redeem the debt at its option, fully or partially, before the scheduled maturity date. The market value of debt instruments may fluctuate, and proceeds from sales prior to maturity may be more or less than the amount originally invested or the maturity value due to changes in market conditions or changes in the credit quality of the issuer. Bonds are subject to the credit risk of the issuer. This is the risk that the issuer might be unable to make interest and/or principal payments on a timely basis. Bonds are also subject to reinvestment risk, which is the risk that principal and/or interest payments from a given investment may be reinvested at a lower interest rate. Investing in high yield bonds, which tend to be more volatile than investment grade fixed income securities, is speculative. These bonds are affected by interest rate changes and the creditworthiness of the issuers, and investing in high yield bonds poses additional credit risk, as well as greater risk of default.
Investments are subject to various risks, including market fluctuations, regulatory change, possible delays in repayment and loss of income and principal invested. The value of investments can fall as well as rise and may not recover the amount originally invested at any point in time. Furthermore, substantial fluctuations of the value of the investment are possible even over short periods of time.
Disclaimer
DWS is the brand name of DWS Group GmbH & Co. KGaA and its subsidiaries under which they operate their business activities. The respective legal entities offering products or services under the DWS brand are specified in the respective contracts, sales materials and other product information documents. DWS, through DWS Group GmbH & Co. KGaA, its affiliated companies and its officers and employees (collectively “DWS”) are communicating this document in good faith and on the following basis.
This document has been prepared without consideration of the investment needs, objectives or financial circumstances of any investor. Before making an investment decision, investors need to consider, with or without the assistance of an investment adviser, whether the investments and strategies described or provided by DWS Group, are appropriate, in light of their particular investment needs, objectives and financial circumstances. Furthermore, this document is for information/discussion purposes only and does not constitute an offer, recommendation or solicitation to conclude a transaction and should not be treated as giving investment advice.
The document was not produced, reviewed or edited by any research department within DWS and is not investment research. Therefore, laws and regulations relating to investment research do not apply to it. Any opinions expressed herein may differ from the opinions expressed by other legal entities of DWS or their departments including research departments.
The information contained in this document does not constitute a financial analysis but qualifies as marketing communication. This marketing communication is neither subject to all legal provisions ensuring the impartiality of financial analysis nor to any prohibition on trading prior to the publication of financial analyses. This document contains forward looking statements. Forward looking statements include, but are not limited to assumptions, estimates, projections, opinions, models and hypothetical performance analysis. The forward looking statements expressed constitute the author‘s judgment as of the date of this document. Forward looking statements involve significant elements of subjective judgments and analyses and changes thereto and/ or consideration of different or additional factors could have a material impact on the results indicated. Therefore, actual results may vary, perhaps materially, from the results contained herein. No representation or warranty is made by DWS as to the reasonableness or completeness of such forward looking statements or to any other financial information contained in this document. Past performance is not guarantee of future results.
We have gathered the information contained in this document from sources we believe to be reliable; but we do not guarantee the accuracy, completeness or fairness of such information. All third party data are copyrighted by and proprietary to the provider. DWS has no obligation to update, modify or amend this document or to otherwise notify the recipient in the event that any matter stated herein, or any opinion, projection, forecast or estimate set forth herein, changes or subsequently becomes inaccurate.
Investments are subject to various risks, including market fluctuations, regulatory change, possible delays in repayment and loss of income and principal invested. The value of investments can fall as well as rise and you might not get back the amount originally invested at any point in time. Furthermore, substantial fluctuations of the value of any investment are possible even over short periods of time. The terms of any investment will be exclusively subject to the detailed provisions, including risk considerations, contained in the offering documents. When making an investment decision, you should rely on the final documentation relating to any transaction.
No liability for any error or omission is accepted by DWS. Opinions and estimates may be changed without notice and involve a number of assumptions which may not prove valid. DWS or persons associated with it may (i) maintain a long or short position in securities referred to herein, or in related futures or options, and (ii) purchase or sell, make a market in, or engage in any other transaction involving such securities, and earn brokerage or other compensation.
DWS does not give taxation or legal advice. Prospective investors should seek advice from their own taxation agents and lawyers regarding the tax consequences on the purchase, ownership, disposal, redemption or transfer of the investments and strategies suggested by DWS. The relevant tax laws or regulations of the tax authorities may change at any time. DWS is not responsible for and has no obligation with respect to any tax implications on the investment suggested.
This document may not be reproduced or circulated without DWS written authority. The manner of circulation and distribution of this document may be restricted by law or regulation in certain countries, including the United States.
This document is not directed to, or intended for distribution to or use by, any person or entity who is a citizen or resident of or located in any locality, state, country or other jurisdiction, including the United States, where such distribution, publication, availability or use would be contrary to law or regulation or which would subject DWS to any registration or licensing requirement within such jurisdiction not currently met within such jurisdiction. Persons into whose possession this document may come are required to inform themselves of, and to observe, such restrictions.
© 2021 DWS International GmbH
In Hong Kong, this document is issued by DWS Investments Hong Kong Limited and the content of this document has not been reviewed by the Securities and Futures Commission.
© 2021 DWS Investments Hong Kong Limited
In Singapore, this document is issued by DWS Investments Singapore Limited and the content of this document has not been reviewed by the Monetary Authority of Singapore.
© 2021 DWS Investments Singapore Limited
In Australia, this document is issued by DWS Investments Australia Limited (ABN: 52 074 599 401) (AFSL 499640) and the content of this document has not been reviewed by the Australian Securities Investment Commission.
© 2021 DWS Investments Australia Limited
For investors in Bermuda
This is not an offering of securities or interests in any product. Such securities may be offered or sold in Bermuda only in compliance with the provisions of the Investment Business Act of 2003 of Bermuda which regulates the sale of securities in Bermuda. Additionally, non-Bermudian persons (including companies) may not carry on or engage in any trade or business in Bermuda unless such persons are permitted to do so under applicable Bermuda legislation.
© 2021 DWS Group GmbH & Co. KGaA. All rights reserved. I-080845-1
Unlock full access to our vast content library by registering as an institutional investor
RegisterUnlock full access to our vast content library by registering as an institutional investor .
Create an accountAlready have an account ? Sign in